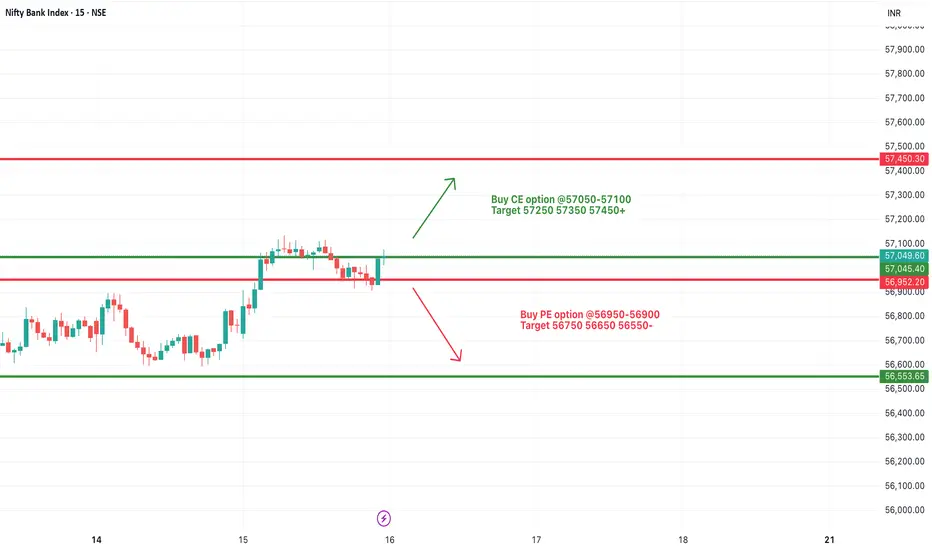
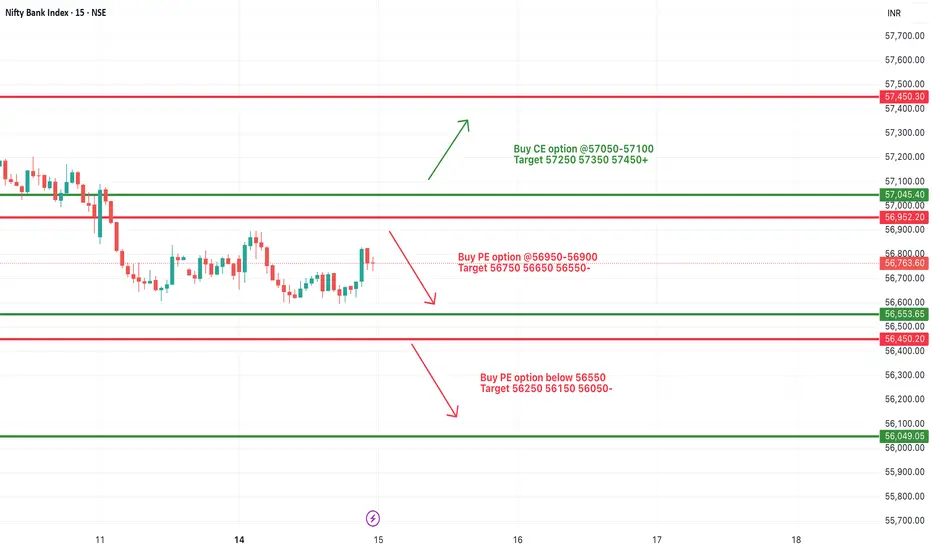
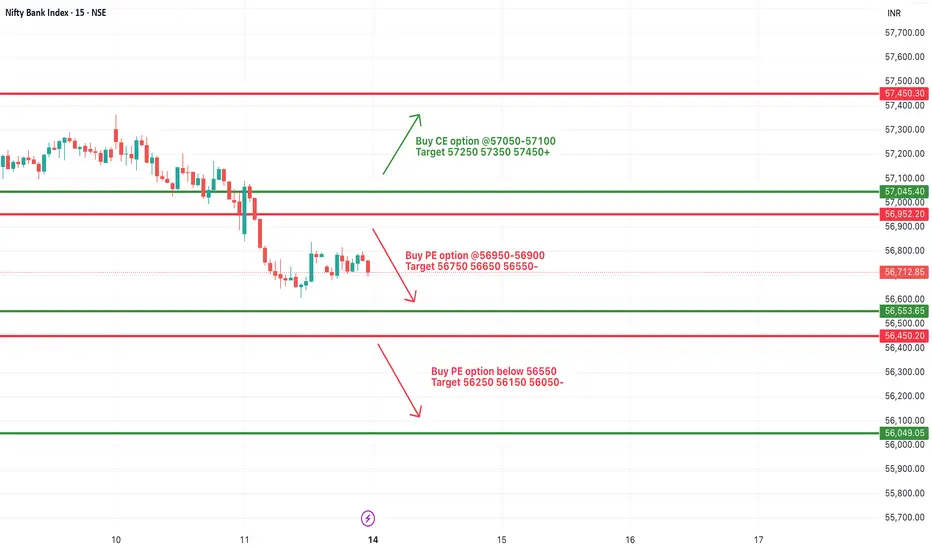
[INTRADAY] #BANKNIFTY PE & CE Levels(16/07/2025)Bank Nifty is expected to begin the day on a flat note near the 57000 mark, indicating indecisiveness after the previous session's recovery. The immediate resistance zone lies between 57050 and 57100. A sustained move above this level can trigger an upward continuation toward the targets of 57250, 57350, and possibly 57450+. This zone will be key for bullish momentum, and traders can look for strength confirmation around this breakout.
On the downside, the 56950–56900 level is crucial. If Bank Nifty slips below this zone, it may invite fresh selling pressure, with intraday downside targets around 56750, 56650, and 56550. The support at 56550 and below can act as demand zones for any pullback.
Priceactionanalysis
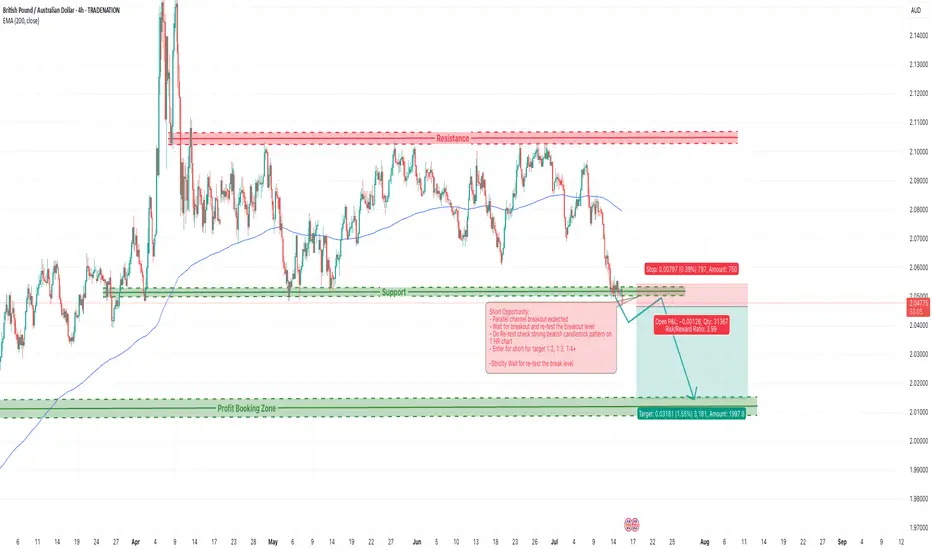
GBPAUD Weekly Trade Setup–Parallel Channel Breakdown Opportunity1. Overview of GBPAUD Technical Setup
As of 15th July 2025, the GBPAUD 4-hour chart reflects a price currently positioned at a critical support level around 2.0470–2.0480, which has held multiple times since early April. The price action leading to this point has formed a classic descending parallel channel, with price making lower highs and testing horizontal support with increased frequency.
Key observations:
Price is well below the 200 EMA (currently around 2.0794), confirming a bearish long-term bias.
The resistance zone at 2.1070–2.1120 has proven strong over time, pushing back multiple rallies.
Price is compressing — getting squeezed into the lower boundary of the channel with shorter pullbacks, often a precursor to breakout.
The setup is aligning for a high-probability short trade, with a potential move toward the next major demand zone around 2.0100.
The Breakdown Thesis – What We See on the Chart
The current structure of GBPAUD tells a very clear story:
After a rally in early April, price has been trading within a consolidation range, failing to make higher highs.
The support around 2.0470 has now been tested repeatedly with lower bounces each time.
Price recently made a lower high and returned to support with momentum, increasing the probability of a breakdown.
We are expecting a bearish breakout of this support level, followed by a re-test of the broken zone, and then a strong downside continuation.
Risk Management Strategy
Every trade setup — no matter how technically perfect — must begin with a strong risk management plan.
For this GBPAUD setup:
Entry Trigger: Breakdown below 2.0470 and successful re-test rejection with bearish candle confirmation
Stop Loss: Above re-test high; ideally, just above 2.0530 (~66 pips risk)
Target 1: 2.0300 (170+ pips)
Target 2: 2.0200
Target 3 / Final: 2.0100 (potential 370+ pip move)
This gives us an excellent Risk:Reward ratio of ~1:5 or more, allowing traders to be wrong several times and still remain profitable over time.
Opportunities in the market don’t come from guessing — they come from waiting. The GBPAUD parallel channel setup is a brilliant example of structure-based trading that combines logic with discipline. Whether you're a full-time FX trader or a part-time swing participant, setups like these are where consistency is built.
Watch the breakdown. Wait for the re-test. Execute only when the market confirms your plan.
Happy Trading!
=================================================================
Disclosure: I am part of Trade Nation's Influencer program and receive a monthly fee for using their TradingView charts in my analysis.
=================================================================
15.07.25 Morning ForecastPairs on Watch -
FX:EURUSD
CAPITALCOM:DE40
FX:EURGBP
FX:GBPJPY
A short overview of the instruments I am looking at for today, multi-timeframe analysis down to what I will be looking at for an entry. Enjoy!

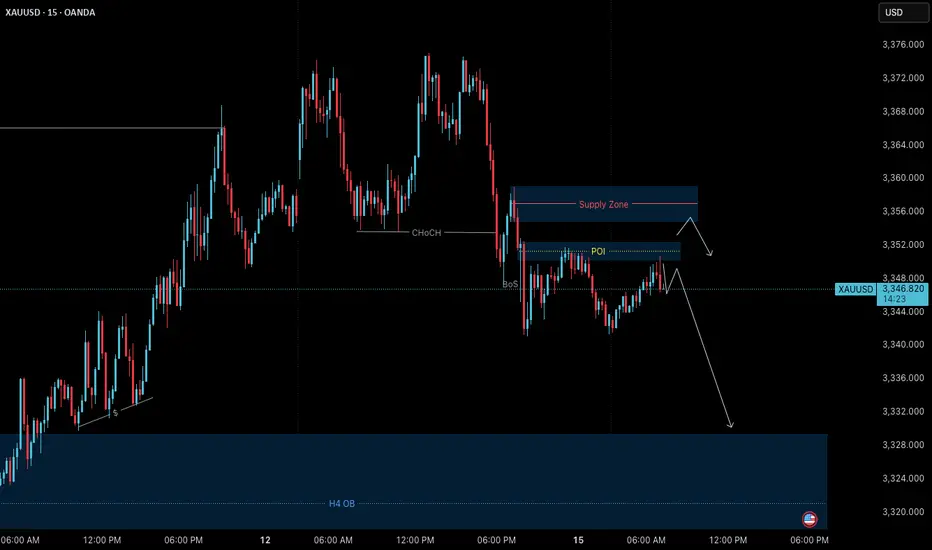
Gold – M15 Downtrend in Play | July 15 Analysis🔻 Gold (XAUUSD) – July 15 Analysis | Bearish Bias Until Proven Otherwise
The market has entered a pullback phase on H4, and we’re expecting a potential retest of the 3320 Order Block before any continuation of the broader uptrend resumes.
🔍 M15 Market Structure:
✅ ChoCH followed by BoS confirms a downtrend on M15
🎯 Current short-term objective: Retest of H4 OB (3320)
📍 Price Action Context:
Price is now revisiting the same M15 POI where yesterday’s short setup originated.
Last session, this POI was respected, but instead of creating a new Lower Low, price is trading inside the same zone again.
This signals indecision — so we let price reveal its intent
🧭 Trade Planning Scenarios:
Scenario 1 – Bearish Continuation:
→ If the POI is respected again with clear M1 confirmation ( Micro-ChoCH + BoS ), we will plan for a short setup toward 3320
Scenario 2 – POI Breaks:
→ If price breaks above this POI zone, the next key level to observe is the 3355–3359 supply zone
→ We’ll reassess from there based on new confirmation
📌 Bias for Today:
🔻 Bearish bias remains intact as long as M15 structure does not shift back to bullish.
All setups must align with structure — we are short-biased only until the market proves otherwise
📖 Structure before emotion. Let the market invite you — not the other way around.
📘 Shared by @ChartIsMirror
Gold Price Analysis July 15Continued uptrend after touching the 3345 buy zone
As analyzed at the beginning of the week, gold price has touched the buy zone around 3345 and continues to maintain the bullish wave structure, heading towards the 3400 resistance zone.
Currently, if gold breaks the 3373 mark, the uptrend is likely to be further strengthened. At that time, it is not advisable to trade against the trend, especially when the buyers completely control the market.
However, in case gold falls below the 3343 support zone (the resistance level in yesterday's US session), the current uptrend may be temporarily interrupted. At that time, the market will need to form a new momentum to establish the next trend.
🔑 Important price zones:
Support: 3343 – 3330 – 3313
Resistance: 3373 – 3387 – 3400
📌 Trading strategy:
Hold BUY order at 3345, expected target 3400
Activate SELL order if there is a clear price rejection signal at 3373 or 3387 (with confirmation of selling pressure)
SELL at 3400 if the strong resistance zone reacts clearly

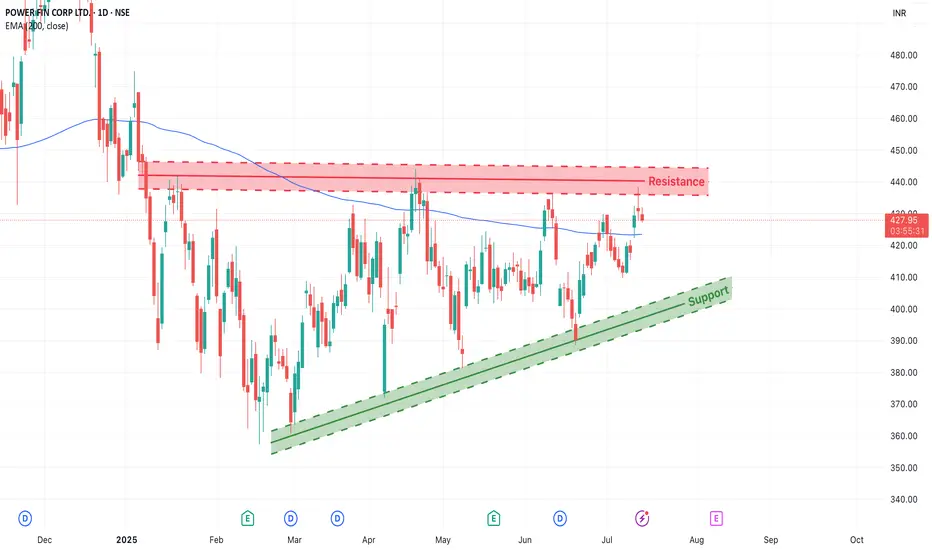
PFC– At Resistance with Ascending Triangle PatternPower Finance Corporation (NSE: PFC) is forming a technically clean structure — trading within a rising trend channel and now testing a critical resistance zone around ₹430–₹440.
This is a make-or-break level, and the market could tip in either direction depending on how price reacts this week.
1. Chart Structure Overview
Support Zone: Defined by a rising green trendline connecting higher lows since March 2025.
Resistance Zone: Red band between ₹430–₹440, where price has previously reversed multiple times.
200 EMA (Blue Line): Currently hovering around ₹423, adding confluence as a dynamic support/resistance level.
This convergence makes the current price zone crucial for directional confirmation.
2. Two Trade Scenarios
Scenario 1: Bullish Breakout (Trend Continuation)
If the price breaks above ₹440 with strong bullish candles, traders can look for:
✅ Entry after a confirmed breakout + re-test of the ₹430–₹435 zone
🎯 Target Zones: ₹455, ₹470+
🛡️ Stop Loss: Below the swing low of the re-test (₹425 or as per price structure)
🔁 Risk/Reward: 1:2 or better
Scenario 2: Resistance Rejection (Short-Term Pullback)
If the price fails to break above ₹430–₹440 and shows reversal patterns:
✅ Entry on confirmation (e.g., bearish engulfing, rejection wick)
🎯 Target Zones: ₹410 (near rising trendline), possible extension to ₹400
🛡️ Stop Loss: Just above the resistance (~₹442–₹445)
🔁 Risk/Reward: 1:2 to 1:3 depending on entry
Thread>
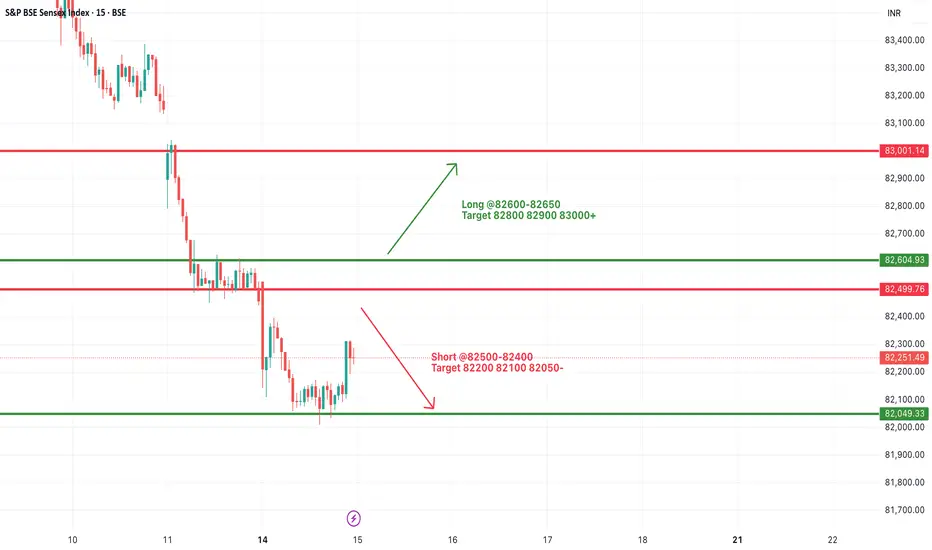
#SENSEX Intraday Support and Resistance Levels - 15/07/2025Sensex is likely to kick off the session with a gap-up opening around the 82500 level, reflecting early bullish momentum. If this initial strength holds and the index begins to build above the 82600–82650 zone, it could signal the start of a recovery leg toward higher resistance levels at 82800, 82900, and potentially 83000+. Sustained action above 82650 may encourage momentum traders to chase strength during the day.
However, the 82500–82650 range will act as a battleground. Failure to defend this zone could invite selling pressure. A breakdown below 82500 may expose the index to intraday weakness, opening downside targets at 82200, 82100, and even 82050. In this case, expect volatility to increase near support levels.
Traders should approach with a flexible strategy—watching for breakout confirmation above 82650 or signs of reversal pressure below 82500. Today’s early range could set the tone for the entire session.
#NIFTY Intraday Support and Resistance Levels - 15/07/2025Nifty is expected to open with a gap-up today near the 25050–25100 zone. If the index sustains above this level after the opening, bullish momentum could follow with potential upside targets of 25150, 25200, and 25250+. This zone will act as the key intraday support-turned-demand area.
However, if Nifty struggles to hold above 25200–25250 and shows signs of reversal from this zone, we might witness selling pressure. A rejection from this region could lead to a pullback toward 25150, 25100, and 25050 levels.
On the downside, a breakdown below 24950 will signal further weakness. If that level is breached decisively, it can lead to sharp downside movements toward 24850, 24800, and even 24750. This would indicate a reversal of early bullish sentiment.
Today’s session could remain volatile around key levels. It’s advisable to watch price action around the 25050–25250 range for intraday confirmation before taking directional trades.

[INTRADAY] #BANKNIFTY PE & CE Levels(15/07/2025)Bank Nifty is expected to open with a gap-up near the 56950 zone. If the index sustains below the 56900–56950 resistance range after the initial up-move, it could face selling pressure. A downside move from this level may trigger a correction toward the 56750, 56650, and 56550 zones. This level becomes a key intraday resistance.
On the downside, a breakdown below the 56650 level could intensify selling, leading to further downside targets of 56250, 56150, and 56050. This zone must be monitored closely as it holds short-term support strength. A decisive move below 56650 will shift sentiment bearish for the session.
On the other hand, a breakout and sustained move above 57100 could attract bullish momentum and may lead to upside targets of 57250, 57350, and even 57450+. Price action around the 57000–57100 mark will be crucial to determine any bullish continuation.
Overall, today's session is expected to open strong but watch for follow-through near the key zones. Traders should remain cautious and wait for confirmation around 56900–57100 for direction clarity.
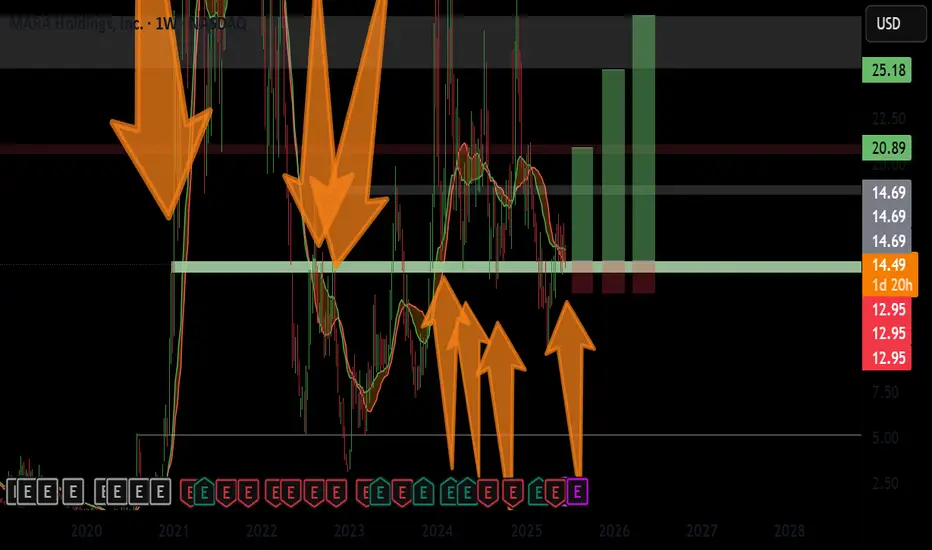
MARA supply and demand; swing tradeI'm looking at the weekly chart here, we have an interesting zone between 14.00$ and 14.68$. We've had decent amount of price action correlating to the areas going back to December of 2020. I set my trade idea with a stop loss at 12.95$ just in case of a liquidity flush , we're still getting at least a 3.5 to 1 ratio, with 2 other targets. This could take till May 2026 to conclude, would consider this a swing trade so could take months or more.
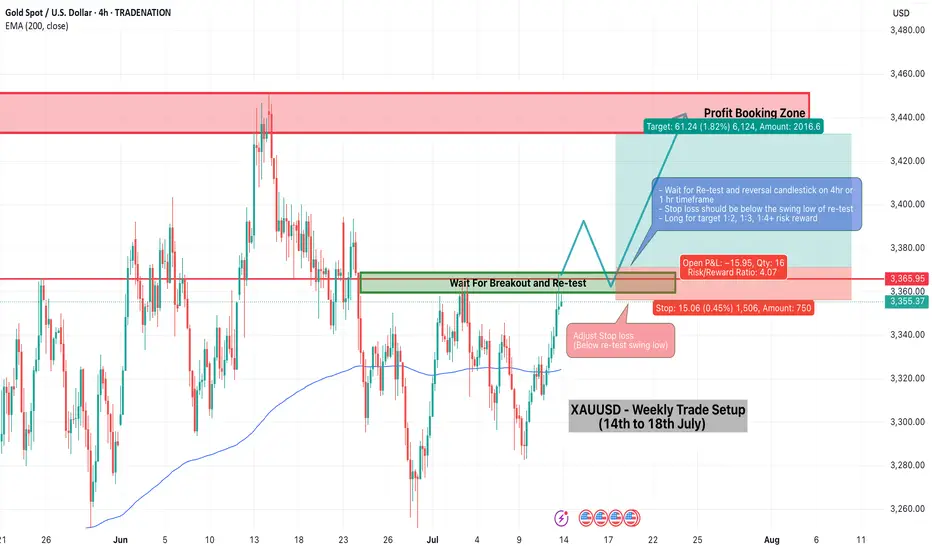
XAUUSD Weekly Trade Setup(14-18th July 2025) - Bullish StrategyIn the ever-volatile world of commodities, Gold (XAUUSD) has yet again presented a promising technical setup. For traders looking to capitalize on price action and structure-based strategies, the upcoming week (14th to 18th July 2025) offers a clean breakout and retest opportunity backed by a strong risk/reward ratio.
Let’s break down the trade plan in detail.
1. Overview of the Current Market Structure
As shown in the 4-hour chart, XAUUSD is approaching a key horizontal resistance zone around 3360–3370. Historically, this area has acted as a rejection point for buyers. However, the recent bullish momentum, supported by price trading above the 200 EMA, suggests a potential breakout.
This forms the basis of a Breakout-Retest-Continuation strategy – one of the most reliable setups in price action trading.
2. The Trade Plan
Here’s the structured plan for this setup:
🔵 Step 1: Wait for the Breakout
Price must break above the resistance zone (3360–3370) with a strong bullish candle.
Avoid chasing the breakout; instead, let the market confirm its direction.
🟠 Step 2: Look for the Retest
After the breakout, wait for the price to pull back to the broken resistance, now acting as support.
Confirm this retest with a reversal candlestick pattern (e.g., bullish engulfing or hammer) on the 1H or 4H timeframe.
🔴 Step 3: Entry and Stop Loss
Enter the trade after the confirmation candle closes.
Place a stop loss below the swing low of the retest zone.
This protects the trade in case of a false breakout.
🟢 Step 4: Set Your Target
The profit booking zone lies around the 3440–3450 region.
This setup offers a Risk/Reward Ratio of 1:4, targeting 1:2, 1:3, and potentially 1:4 if momentum continues.
3. Why This Setup Makes Sense
EMA Confirmation: Price is trading above the 200 EMA, showing bullish bias.
Clean Price Action: Well-defined structure makes it easy to identify breakout/retest levels.
Strong Risk Management: The stop is tight and logical, while the upside potential is considerable.
Psychological Support Zone: 3360–3370 has repeatedly acted as a key decision level.
4. Trade Management Tips
Trail your stop loss once 1:2 R:R is achieved.
Consider partial profit booking at 1:2 or 1:3 to lock in gains and reduce risk.
Be patient – the key to this strategy is waiting for the retest confirmation.
5. Final Thoughts
Trading XAUUSD can be both rewarding and risky. This weekly setup gives you a disciplined approach to enter the market at a high-probability point with excellent reward potential. Whether you’re a swing trader or an intraday scalper on lower timeframes, this strategy adapts well with proper confirmation.
Stay tuned for live updates, and as always – plan your trade, and trade your plan.
Happy Trading!
=================================================================
Disclosure: I am part of Trade Nation's Influencer program and receive a monthly fee for using their TradingView charts in my analysis.
=================================================================
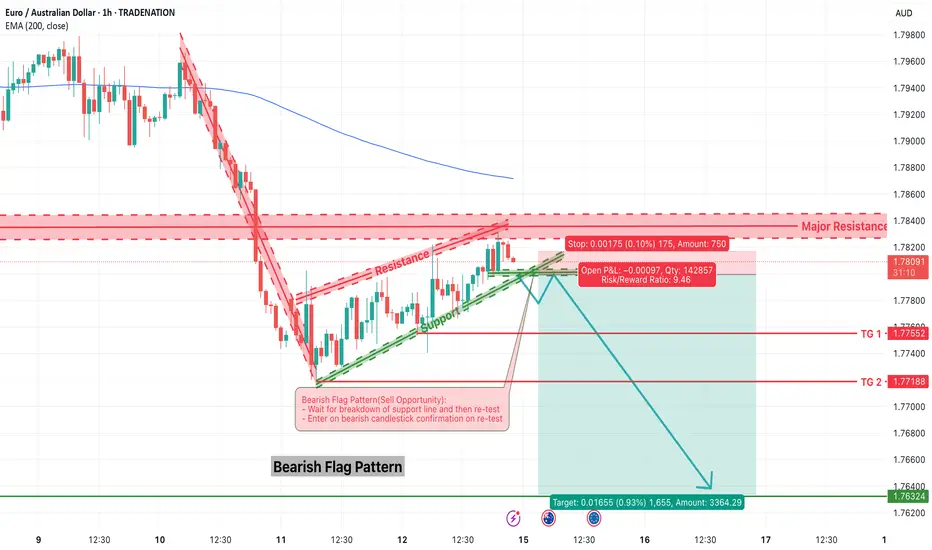
EURAUD – Bearish Flag Breakdown OpportunityThe EURAUD pair is showing signs of trend continuation via a classic bearish flag pattern formation. After a sharp decline, the market has entered into a tight consolidation channel, climbing steadily inside a sloped flag structure. Price is now testing a critical resistance area near 1.7830–1.7840 while hovering just below the 200 EMA.
This setup offers a high-probability sell opportunity — but only after confirmation.
1. Structure Overview
The initial sharp downtrend is followed by a consolidation channel — a textbook bearish flag.
Price is approaching major resistance (1.7830–1.7840) and 200 EMA, acting as a ceiling.
A breakdown from the rising support of the flag is expected to trigger a continuation toward the downside.
2. Trade Plan – Bearish Flag Breakdown
✅ Entry Plan:
Wait for a breakdown of the green support trendline (flag support).
Then, wait for a re-test of the broken support (now resistance).
Enter short only after a bearish candlestick confirmation (e.g., bearish engulfing or rejection wick) on the 15-min or 1-hour chart.
🛡️ Stop Loss:
Place the stop loss just above the major resistance zone, around 1.7835–1.7840.
🎯 Target Zones:
Target 1 (TG1): 1.7755
Target 2 (TG2): 1.7718
Final Target: 1.7632
Risk/Reward Ratio: 1:2, 1:4, 1:9.4+
3. Why This Trade Makes Sense
Bearish Flag is a reliable continuation pattern in strong downtrends.
Price is failing to break above key resistance and 200 EMA.
The flag offers a tight SL and large downside potential — ideal conditions for R:R setups.
Confluence of structure, pattern, and trend all align for short bias.
4. Trade Management Tips
Scale out partial profits at TG1 and TG2, and trail stop for final target.
If breakdown fails, avoid chasing price — re-evaluate bias if price breaks above 1.7840.
5. Final Thoughts
This EURAUD chart is a textbook case of pattern + price action + resistance confluence. The flag structure is well-defined, and the reward-to-risk ratio is significantly favorable if the breakdown confirms.
📌 Watch for:
Breakdown of rising support
Retest and bearish candle
Entry only on confirmation
High-probability setups don’t require prediction — they require preparation.
=================================================================
Disclosure: I am part of Trade Nation's Influencer program and receive a monthly fee for using their TradingView charts in my analysis.
=================================================================
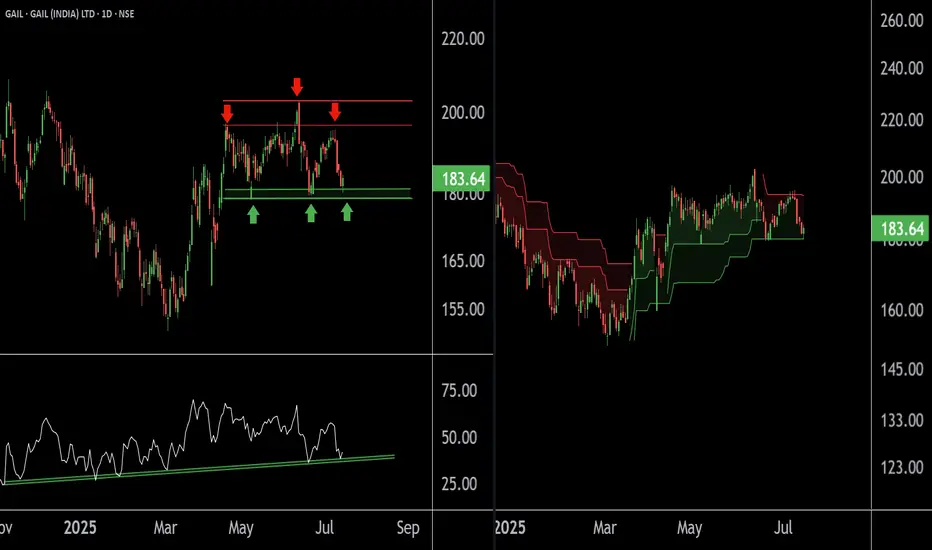
GAIL at Best Support zone !! There are two chart of Gail on Daily timeframe.
On the first chart Gail is moving in well defined parallel channel with support near at 178-180 zone.
Daily RSI is also taking support and bouncing back, indicating a revival in short-term momentum and strengthening the overall bullish setup.
On the second chart , the stock is bouncing from the supertrend support around ₹180, reinforcing bullish sentiment. However, on the shorter timeframe, the supertrend indicator is acting as resistance near ₹192, which needs to be breached for further upside continuation.
Thank You !!
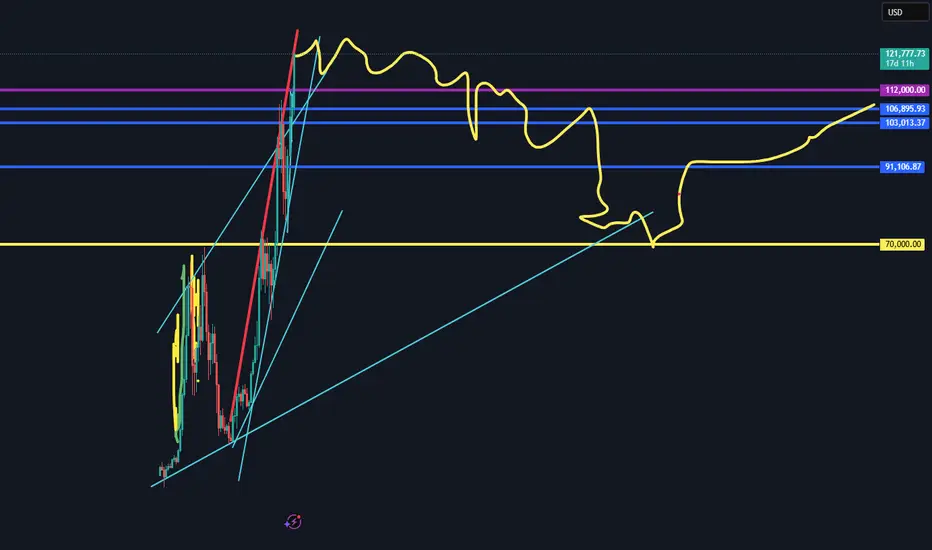
BTC TOP AND BEARISH AND CONTUNITY PREDICTION This chart is purely based on technical analysis. The RSI is still not oversold on the monthly chart, which means there might be a little more upside to this. But from the trendline, a serious reversal appears due. I could be wrong, but we'll all see. Profit taking may commence bit by bit.
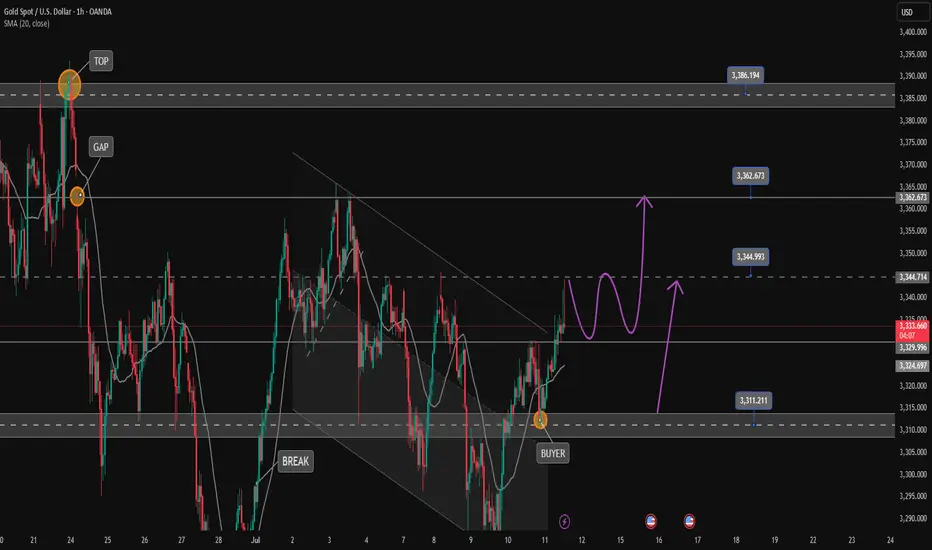
Gold breaks trendline towards 3390, Uptrend resumes✏️ OANDA:XAUUSD The price increase will continue today and will be even stronger. After breaking the trendline, gold has strong support. SELL strategies are only considered to find short-term reaction points waiting for the next trends.
Gold has confirmed the uptrend is back, heading to 3390 today.
📉 Key Levels
Support 3330-3314
Resistance 3345-3362-3388
Sell trigger: rejection from 3345 with bearish confirmation
Sell zone: 3362–3387 (Strong resistance)
BUY trigger: 3330-3314 support with bounce confirmation
Leave your comments on the idea. I am happy to read your views.
SELL BTC 13.7.2025 (scalping M15)Counter-trend trade order: SELL at THE TOP
Type of entry: Limit order
Condition:
- If the price break down at 122,041 confirming the down trend.
Note:
- Management of money carefully at the price of bottom (122,041)
Set up entry:
- Entry sell at 122,821
- SL at 123,334
- TP1: 123,041
- TP2: 121,389
Trading Method: Price action (No indicator, only trend and candles)

Gold Weekly Analysis | Will $3,360 Break or Hold? [July 14–18]In this video, I break down the recent gold price action and what to expect in the coming week. We’ll review how gold responded to last week’s FOMC minutes, why $3,360 remains a key decision zone, and what upcoming U.S. economic data (CPI, PPI, Retail Sales) could mean for price movement.
👉 If you find this content valuable, don’t forget to Vote, Comment, and Subscribe for weekly market breakdowns.
Disclaimer:
Based on experience and what I see on the charts, this is my take. It’s not financial advice—always do your research and consult a licensed advisor before trading.
#GoldAnalysis, #XAUUSD, #ForexTrading, #GoldForecast, #MarketOutlook, #TechnicalAnalysis, #FundamentalAnalysis, #GoldPrice, #FOMC, #CPIData, #PPIdata, #DollarIndex, #TradingStrategy, #WeeklyOutlook, #GoldTechnicalAnalysis, #TradeSmart, #Darcsherry

14.07.25 Morning ForecastPairs on Watch -
FX:NZDCAD
FX:USDJPY
FX:EURUSD
OANDA:US30USD
A short overview of the instruments I am looking at for today, multi-timeframe analysis down to what I will be looking at for an entry. Enjoy!

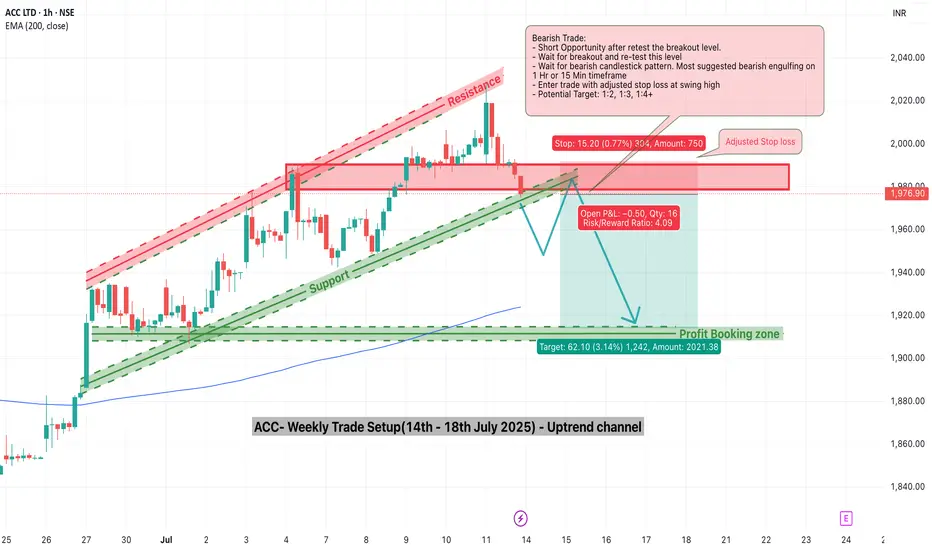
ACC Trade Setup for the Week(14–18 July 2025) – Uptrend ChannelACC Ltd. (NSE: ACC) has been trading inside a clean uptrend channel for the past few weeks, bouncing consistently between rising support and resistance. Now, it approaches a critical inflection point — the lower support of the channel.
While no breakdown has occurred yet, the structure is weakening, and a bearish opportunity may soon present itself. Let’s explore how to trade this if the setup confirms.
1. What’s Happening on the Chart?
ACC is trading close to the channel support zone (~₹1975).
The resistance zone near ₹2000–₹2020 has held strong.
A potential breakdown below the rising green support trendline could trigger a bearish move toward the ₹1910–₹1920 demand zone.
But nothing is confirmed yet — this is a watchlist setup.
2. Trade Setup – Conditional Bearish Opportunity
✅ Trade Plan:
Wait for breakdown of the rising support line.
After breakdown, wait for a re-test of the broken support zone (~₹1975–₹1980).
Look for bearish confirmation via a candlestick pattern (engulfing or strong rejection) on the 15-min or 1-hour timeframe.
🚨 Entry Trigger:
Only enter short if re-test holds and price starts reversing.
📉 Stop Loss:
SL should be above the re-test high (around ₹1990–₹1995).
🎯 Target:
Profit booking zone: ₹1910–₹1920.
Potential R:R: 1:2, 1:3, or even 1:4 depending on entry.
3. Why This Setup Matters
Trend exhaustion is visible near the upper resistance of the channel.
A clean breakdown + re-test gives a low-risk entry.
The 200 EMA lies near the target zone, providing confluence for mean reversion.
4. What If There’s No Breakdown?
If price respects the support and bounces again, no trade should be taken on the short side.
In that case, look for possible bullish reversal signals back toward channel resistance — or stay neutral.
5. Final Thoughts
This is a highly conditional setup — and patience is the key. Don’t jump the gun. The best trades happen after confirmation.
🔔 What to watch this week:
Breakdown below ₹1975 support
Re-test and rejection from ₹1975–₹1985
Confirmation candle (bearish engulfing)
Only then consider a short trade toward ₹1910 with a well-placed SL.
Plan your trade. Wait for structure. Trade only when the market shows its hand.
Gold Price Analysis July 14Gold confirmed a break above the key 3330 level on Friday, opening a clear uptrend. The reaction at the 3368 GAP zone further strengthens the current bullish momentum. With the current market structure, the bias is leaning towards buying on corrections around support zones.
🔍 Technical levels to watch:
Support: 3345 – 3331 (potential buying zone)
Resistance: 3387 – 3400 (bullish target)
📌 Trading strategy:
BUY Trigger 1: Price tests and rejects the 3345 support zone
BUY Trigger 2: Buy around 3331 – strong support zone
🎯 Target: 3400
The current trend favors a buying strategy on reasonable price correction conditions. It is necessary to monitor price action around support zones to confirm effective entry points.

#NIFTY Intraday Support and Resistance Levels - 14/07/2025Nifty is expected to open slightly gap-down after consistent bearish momentum in the previous sessions. The index is hovering near 25140, and immediate support lies around the 25200 level. A breakdown below this level could lead to further downside pressure, with key support targets at 25150, 25100, and 25050.
If the index breaks and sustains below 24950, it may trigger a deeper correction toward the next support levels at 24850, 24800, and 24750. These zones should be watched closely for potential reversals or continuation of bearish momentum.
On the upside, any recovery and sustained move above the 25250 level may lead to a pullback rally. In that scenario, immediate resistance levels to watch would be 25350, 25400, and 25450+.
Intraday structure remains weak unless Nifty reclaims the 25250+ zone with strength. Price action near the 25200–25050 support range will be crucial in deciding the direction of the day.

[INTRADAY] #BANKNIFTY PE & CE Levels(14/07/2025)Bank Nifty is expected to open slightly gap-down, continuing the weakness observed in the previous sessions. The index is currently trading around the 56700 level after facing consistent resistance near the 57100 zone. If the index sustains below the 56950–56900 region, it may extend the downside toward 56750, 56650, and further down to 56550.
A break below 56650 could trigger a sharper fall, with the next key support levels placed at 56250, 56150, and 56050. These zones will be critical to watch for potential reversal or further breakdown.
On the upside, any strength and breakout above the 57050–57100 resistance zone may open the path toward higher levels like 57250, 57350, and 57450+. However, unless this zone is breached with strength, upward movement is likely to remain capped.
The overall structure indicates bearish pressure, and the price action near 56900–56650 will decide the intraday trend. Traders should remain cautious and react based on levels with proper risk management.
BTC's increasing fomo force will push the price up furtherCRYPTO:BTCUSD just broke the important resistance zone and trendline around 110000. This price increase to create a new ATH will create a large amount of FOMO in the market pushing BTCUSD to increase more than half. 116,000 FIbonacci extension points are considered the immediate Target for the uptrend.
Waiting for retests to the support zone for the trend-following BUY strategy.
Support: 110000-107500
Resistance: 116000
Buy zone: 110000 ( support + trendline)
Buy Trigger: break above 112000
Leave your comments on the idea. I am happy to read your views.
