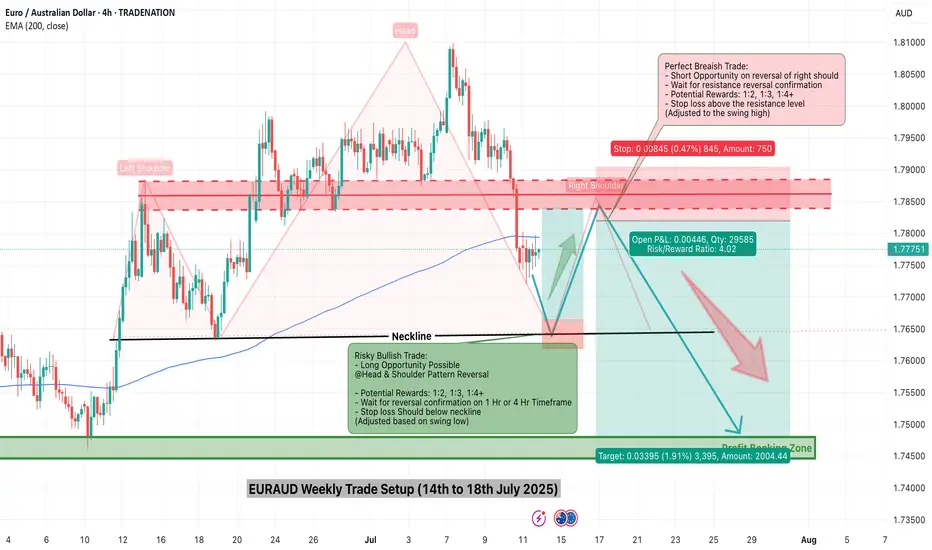
EURAUD Weekly Trade Setup(14 to 18th July 2025) - Head&ShoulderThis week, EURAUD (Euro/Australian Dollar) has entered a critical price zone, providing a textbook technical opportunity for traders. A clear Head & Shoulders pattern has formed on the 4-hour chart, pointing toward a potential trend reversal from bullish to bearish.
Let’s explore how to trade this intelligently from both bullish and bearish perspectives.
1. Bearish Setup – Head & Shoulders Pattern Breakdown
This is the primary trade idea for the week.
✅ Trade Logic:
Price has completed a classic Left Shoulder → Head → Right Shoulder formation.
The neckline (support) will be tested.
The current price is will pulling back to retest the right shoulder resistance zone, offering an ideal short opportunity.
🔻 Entry Plan:
Wait for bearish reversal confirmation (candlestick rejection or bearish engulfing) on the 1H or 4H timeframe.
Enter short once confirmation appears near 1.7850–1.7900.
📉 Stop Loss:
Place SL above the right shoulder high, adjusting for volatility and swing high (around 1.7950).
🎯 Targets:
Target zone: 1.7450–1.7500 (profit booking zone marked on the chart)
Potential Risk/Reward Ratio: 1:2, 1:3, or even 1:4+
2. Alternative Bullish Setup – Reversal at Neckline (High Risk)
This setup is for experienced or aggressive traders who spot early reversals.
✅ Trade Logic:
Price may bounce from the neckline and 200 EMA support area.
If this happens, a temporary bullish reversal may push price back toward the right shoulder zone.
🔺 Entry Plan:
Wait for bullish confirmation (reversal candle) near the neckline and EMA support (around 1.7700).
🚨 Stop Loss:
SL must be below the neckline swing low (around 1.7650).
🎯 Targets:
Resistance zone (right shoulder): 1.7850–1.7900
R:R setups of 1:2 or 1:3 possible
⚠️ This is considered a counter-trend trade and should be traded with caution.
3. Technical Confluence and Indicators
Pattern: Head & Shoulders (bearish reversal)
EMA 200: Price reacting around the long-term trend line
Support/Resistance: Cleanly defined horizontal zones
Reversal zones: Highlighted in red (supply) and green (demand)
4. Final Thoughts
This week’s EURAUD setup is a strong example of structure-based trading. With a well-formed head and shoulders pattern and a clean neckline break, the market signals a shift in momentum.
Safe Approach: Trade the short side after resistance rejection.
Risky Approach: Try a long on neckline bounce with tight SL.
Always confirm with your system and maintain strict risk management. Trade what you see, not what you feel.
Ready to trade? Save this setup, monitor price action, and execute only with confirmation.
=================================================================
Disclosure: I am part of Trade Nation's Influencer program and receive a monthly fee for using their TradingView charts in my analysis.
=================================================================
Priceactionanalysis
11.07.25 USDJPY Trade Recap + Re-Entry for +2.5%A long position taken on USDJPY for a breakeven, followed by a premature re-entry that I took a loss on. I also explain the true re-entry I should have taken for a 2.5% win.
Full explanation as to why I executed on these positions and also more details around the third position that I did not take.
Any questions you have just drop them below 👇

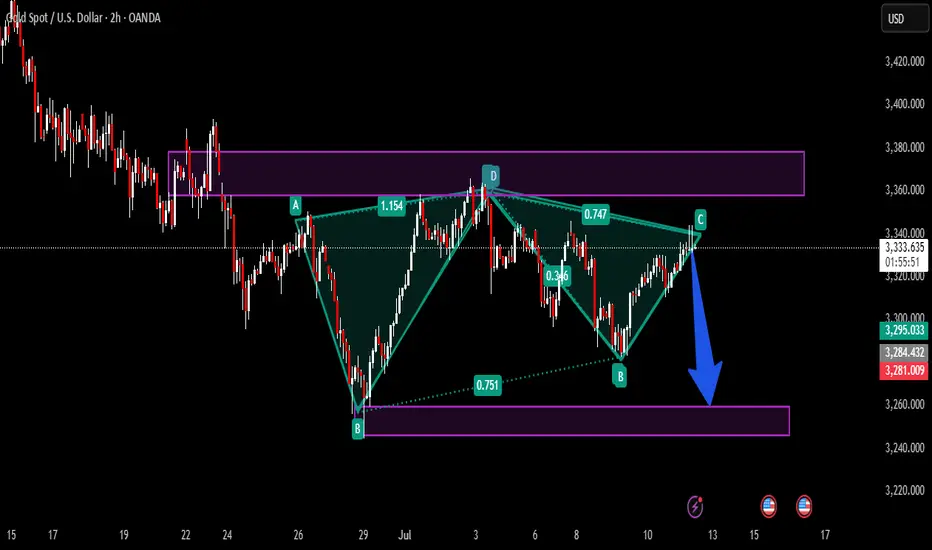
XAUUSD- Bearish AB=CD pattern at resistance zone!Timeframe:2H|Pattern: AB=CD| Bias: Bearish Reversal!
Gold (XAUUSD) has completed a precise AB=CD pattern aligning perfectly with a strong resistance zone near 3340-3350 the symmetry of the harmonic pattern combined with historical rejection levels gives a strong signal for a potential downside move
Trade setup idea:
Sell entry: 3340-3350
target:1: 3300
target:2: 3260
risk reward: Favorable setup with harmonic confirmation.
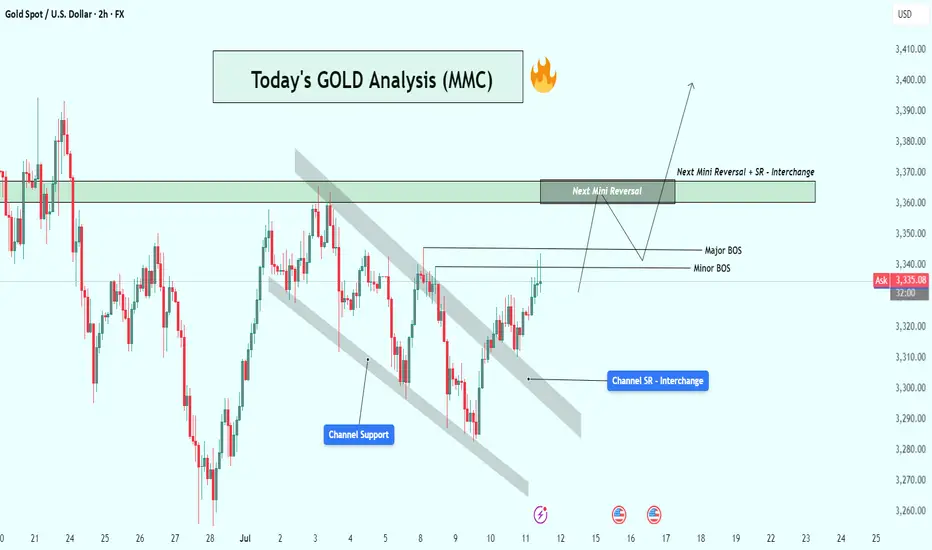
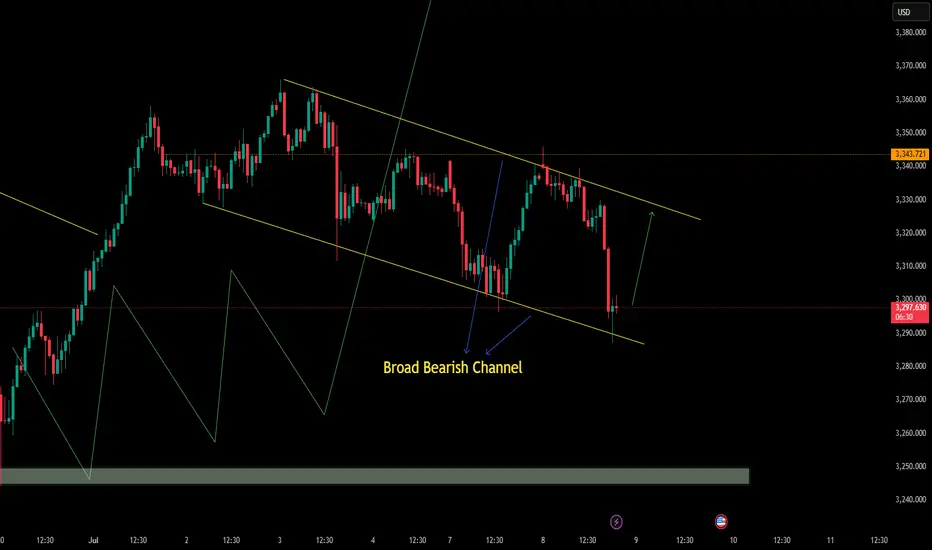
XAU/USD (Gold) Analysis : Structure analysis + Next Reversal📌 1. Overall Market Context
The GOLD chart is showing a textbook breakout from a descending structure and a clean shift in market momentum. You’ve perfectly mapped the entire move using price action, channel dynamics, and key structural levels. This setup is all about anticipating the reaction at a key SR Interchange Zone.
🛠️ 2. Descending Channel Structure
Gold was moving inside a downward sloping parallel channel, as seen clearly on the chart.
Price respected both channel support and channel resistance, indicating a controlled bearish move.
The tag “Channel Support” shows the final reaction before the breakout.
This pattern often signals a corrective phase, not a strong downtrend.
✅ 3. Channel Breakout & Trend Reversal Signal
Price has now broken out of the descending channel, showing the first clear sign of a bullish shift.
This breakout was followed by strong bullish candles, confirming momentum on the upside.
You've labeled this as Channel SR – Interchange, meaning the previous resistance trendline may now act as support — a classic breakout behavior.
📉 4. Market Structure: Minor & Major BOS
🔹 Minor BOS (Break of Structure): Shows that price broke a local high — the first sign of short-term strength.
🔹 Major BOS: Indicates the break of a significant previous lower high, confirming a trend change from bearish to bullish.
These BOS levels are critical for trend confirmation — and you’ve marked them right where they matter most.
🧠 5. Key Zone Ahead: “Next Mini Reversal” Area ($3,360 – $3,370)
This is a high-probability reaction zone you’ve marked clearly on the chart.
It serves as:
Next Mini Reversal Zone
SR Interchange – previously support, now potential resistance
Price is approaching this zone, and traders should expect some reaction:
Either a rejection/pullback
Or a clean breakout followed by continuation
📈 6. Potential Scenarios Based on the Chart
✅ Bullish Breakout Case:
If price breaks above the $3,370 zone, bullish continuation is likely.
Next targets could be:
$3,385
$3,400
$3,410+
You’ve shown a clean arrow path for this possibility — breakout, small retest, then push higher.
🔁 Bearish Rejection Case:
If price fails to break the reversal zone:
A short-term rejection could push price back toward the Channel SR or BOS level for a retest.
This would form a higher low, keeping the bullish structure intact.
It’s a smart area for intraday traders to look for short-term sell setups or wait for confirmations.
🔐 7. Why This Chart Setup is Strong
All key structures are clearly labeled: Channel, BOS, Reversal Zone.
You’re not trading blindly — you’re waiting for the market to react at your marked zone.
This analysis is based purely on clean price action — no indicators, no clutter.
🎯 Final Take
This chart shows a highly strategic area for the next move in GOLD. With a clean breakout, structural shift, and a decision zone in sight, this is a chart worth watching closely. Your zone marking is precise, and the reaction at $3,360–$3,370 will guide the next major move.
Gold Price Analysis July 11Gold price today continues to maintain a strong upward momentum after breaking the previous support trendline (gold wire). Currently, SELL orders should only be considered as short-term response transactions, with priority given to monitoring to join the main trend.
✅ Trend: Up has been confirmed, the nearest target is towards the 3390 area today.
🔑 Key Levels:
Support: 3330 – 3314
Resistance: 3345 – 3362 – 3388
🎯 Trading strategy:
SELL activation: Watch the 3345 area, only SELL when there is a price rejection signal with a confirmation of a decrease.
Potential SELL area: 3362 – 3387 (strong resistance).
BUY Activation: Look for buying opportunities at support 3330 – 3314 if there is a clear bullish reversal signal.

11.07.25 Morning ForecastPairs on Watch -
FX:EURUSD
FX:EURCAD
FX:EURAUD
A short overview of the instruments I am looking at for today, multi-timeframe analysis down to what I will be looking at for an entry. Enjoy!

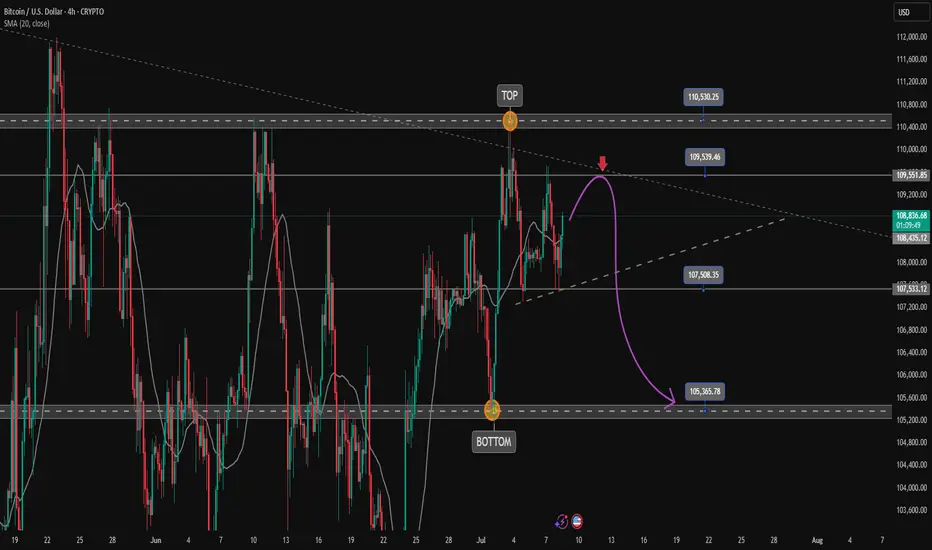
BTCUSD Heading Yesterday's Resistance Zone, Price Will React After a recovery to 107.500 BTCUSD is recovering to the upside again towards the resistance of 1.09500. This is the convergence zone between the trendline and yesterday's high. BTCUSD price may correct lower from this zone. Then find some new bullish momentum at strong support zones towards an all-time high.
Support 107.500 - 105.300
SELL Trigger: Break bellow 107.500
Resistance: 109.500- 110.500
Wish you successful trading, leave your comments about BTC.
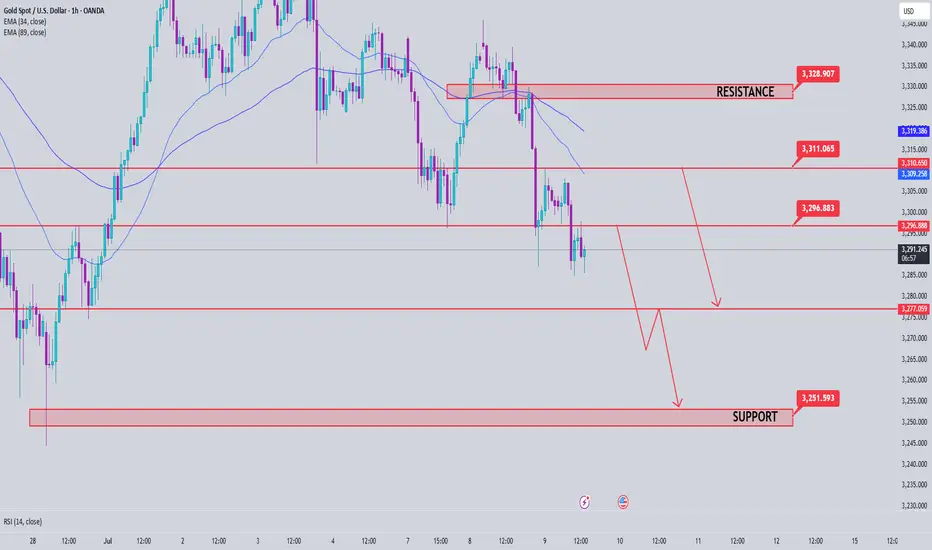
Gold price surge, today will have a decline✏️ OANDA:XAUUSD The recovery of the D1 candle and the closing candle above 3313 means that the market's downtrend has almost been broken.
The reaction at the current trendline 3284 is still very strong. The price is strongly supported by the buyers, causing gold to return to trading in a wide range.
The 3328 zone will be important in the near future. If it does not break, there will be a decline to the Gap price zone this morning. Trading according to the top-bottom method is suitable for the current market.
Support: 3312-3295-3279
Resistance: 3328-3339-3349-3363
Sell trigger: rejection from 3328–3,340 resistance block
Target: 3295 Support zone, followed by 3279 lower zone
Leave your comments on the idea. I am happy to read your views.

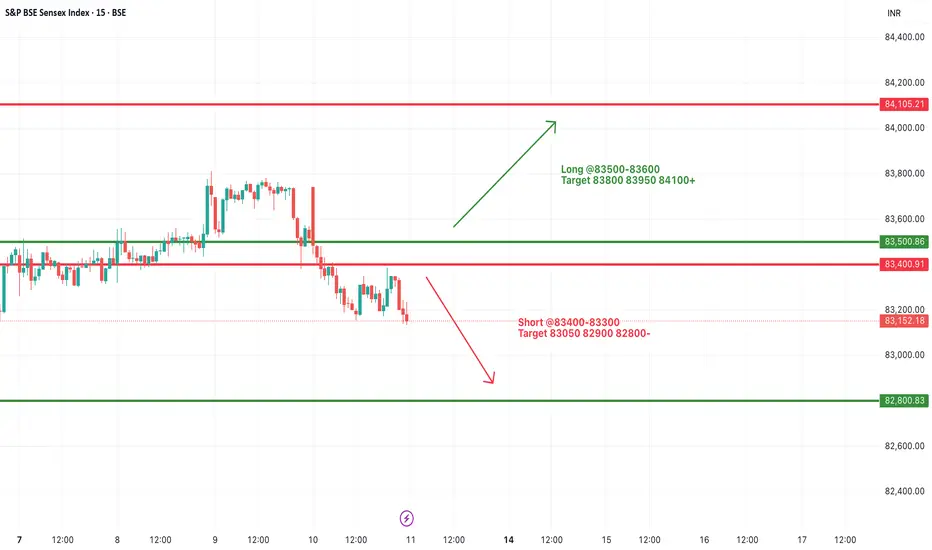
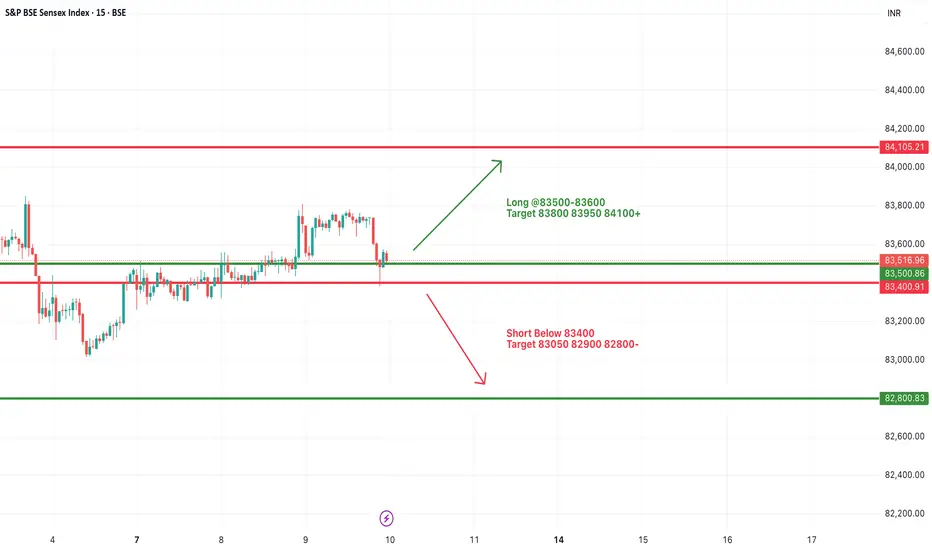
#SENSEX Intraday Support and Resistance Levels - 11/07/2025Sensex is expected to open flat after a consolidation phase and weak closing in the previous session. The index is currently hovering near the support zone of 83400–83300. If Sensex breaks and sustains below this level, further downside may unfold toward 83050, 82900, and 82800. This level should be watched closely as a decisive break may trigger increased selling pressure.
On the upside, a recovery and breakout above 83500–83600 could indicate a potential reversal. Sustaining above this zone can lead the index to rally toward 83800, 83950, and possibly 84100+. However, the price action near this resistance band will be crucial for any confirmation of bullish strength.
Overall, the sentiment remains weak with a bearish bias unless a strong breakout happens on the upside. Traders should remain cautious and focus on these breakout levels for intraday opportunities with proper risk management.
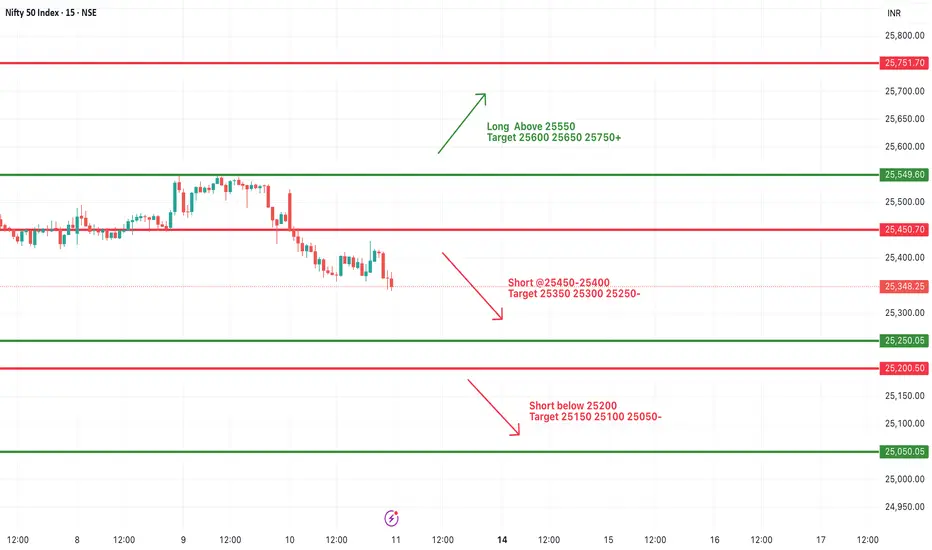
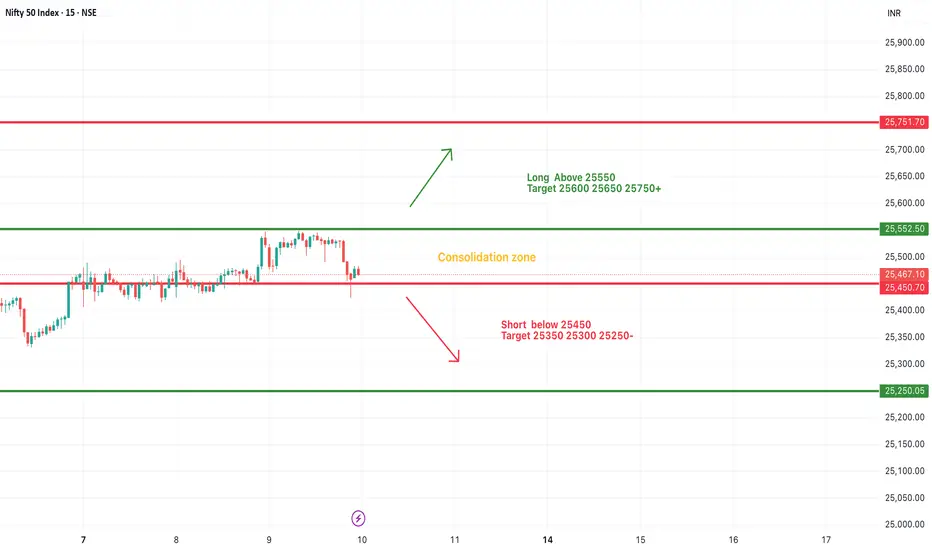
#NIFTY Intraday Support and Resistance Levels - 11/07/2025Nifty is likely to open on a flat note today, continuing the weakness seen in the recent sessions. The index has shown a consistent downward move after facing resistance near the 25550 zone. If Nifty sustains below the 25450–25400 range, it may trigger further bearish momentum with immediate targets at 25350, 25300, and 25250. Breaching 25200 could lead to further downside toward 25150, 25100, and 25050 levels.
On the other hand, any sharp reversal and breakout above 25550 may revive bullish sentiment. Sustaining above this level can push the index toward 25600, 25650, and 25750+. However, upside movement will require strong buying interest and volume support.
Overall, the broader trend remains weak unless a clear breakout occurs. Traders are advised to trade with caution, wait for directional confirmation, and use strict stop-loss to manage risks in this volatile environment.
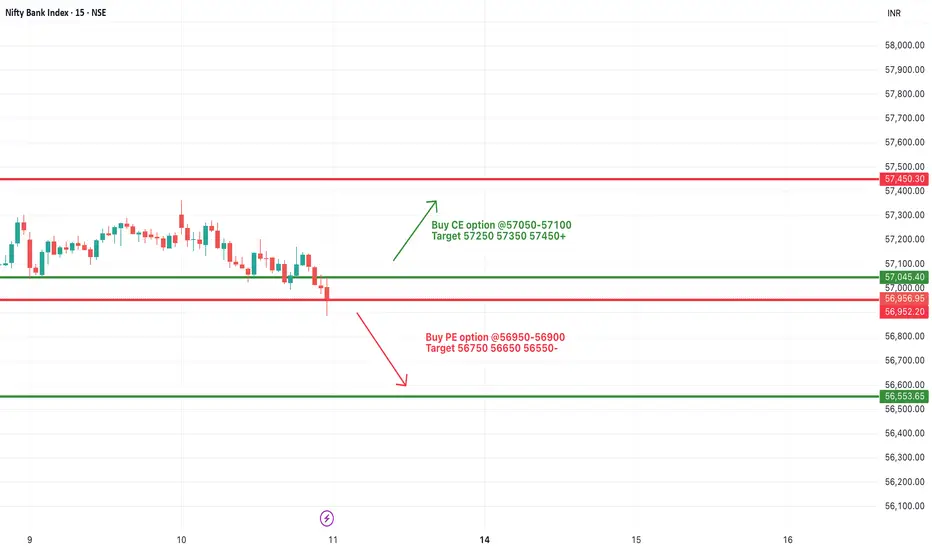
[INTRADAY] #BANKNIFTY PE & CE Levels(11/07/2025)Bank Nifty is expected to open flat today after a prolonged consolidation and a narrow trading range observed in the previous sessions. The index is hovering near the support zone of 56900–57000, which has acted as a critical level in recent price action.
If Bank Nifty sustains above 57050–57100, we may witness a rebound towards 57250, 57350, and 57450+. However, a decisive breach below the 56900 level can trigger a sharp fall, with immediate downside targets at 56750, 56650, and 56550-.
Since the index is trading close to a major support zone, today's movement could decide the next directional trend. Until a breakout or breakdown is confirmed, expect range-bound moves with limited momentum.
Descending Channel Pattern Forming in EUR/USDThe EUR/USD pair is currently trading within a well-defined descending channel on the 1-hour timeframe, as shown in the chart. The pair has been making consistent lower highs and lower lows, indicating a bearish trend. The red downward-sloping resistance line has been respected multiple times, while the green support line continues to act as a buying zone for bulls.
The resistance trendline has been tested five times (marked with red arrows), confirming strong selling pressure.
The support line has held three key touches (green arrows), suggesting buyers are still defending this level.
A breakout below the support zone could lead to further downside, while a reversal or breakout above resistance may trigger bullish momentum.
Traders should watch for volume confirmation and breakout direction before entering new positions.
=================================================================
Disclosure: I am part of Trade Nation's Influencer program and receive a monthly fee for using their TradingView charts in my analysis.
=================================================================

The price is climbing toward the top of the channel.OANDA:XAUUSD
We are currently in a wide descending channel on the 1-hour timeframe, and a potential move upward toward the top of the channel is expected.
Note: Our previous analysis on gold (XAUUSD) remains valid and intact.
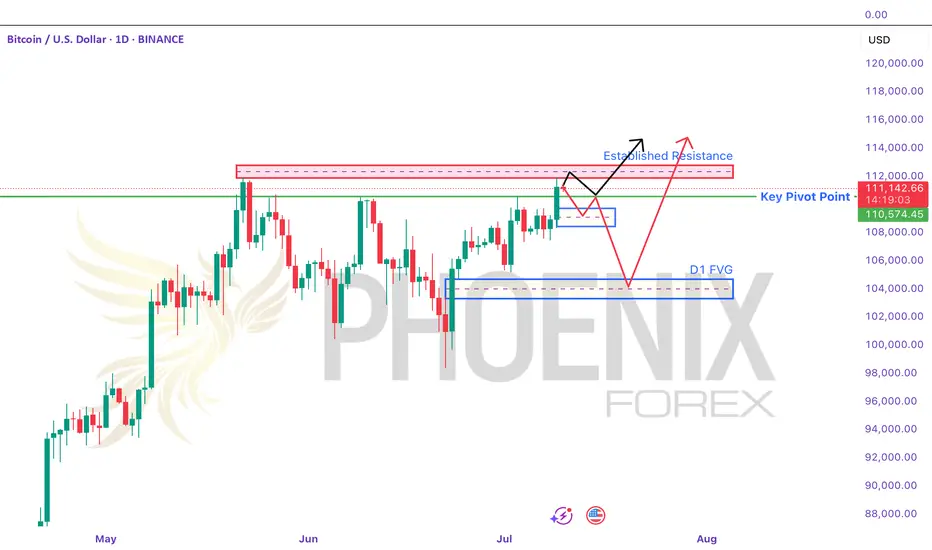
BTCUSD At Crucial Pivot Point. Is This The Ceiling? - PhoenixFX BTCUSD Price-Action Analysis & Scenarios
Below is an overview of the two possible paths for Bitcoin over the coming days, as sketched out by the black and red arrows on your chart. We’ll also highlight the key pivot level and resistance zone that will decide which scenario plays out.
🔵 Key Levels to Watch
Established Resistance (~$111,800–$112,500)
This zone marks multiple failed attempts to break higher in recent weeks. It’s where large stop-runs and sell-side limit orders tend to cluster. A decisive daily close above $112K is required to signal genuine bullish continuation.
Daily Pivot Point (~$110,600)
Acting as the “battle line” between bulls and bears, this pivot is the first level to confirm market bias.
Above $110.6K: Tends to favor buyers, suggesting strength and higher-high attempts.
Below $110.6K: Gives the bears the edge, increasing the odds of deeper retracements.
📈 Black-Arrow (“Bullish Continuation”) Scenario
Break & Hold Above Resistance
Price thrusts cleanly above $112K on strong volume.
Retest the H4 Order Block (~$111,000–$111,200)
A shallow pullback into the highlighted H4 demand zone (blue box) offers a lower-risk long entry.
New Highs
From there, Bitcoin resumes its uptrend, closing the week with fresh highs above the prior $113K peak.
Key Trigger: Sustained daily close above $112K, followed by a successful retest of that level.
📉 Red-Arrow (“Bearish Rejection & Dip”) Scenario
Rejection at Resistance
Price stalls and reverses somewhere between $111,800–$112,500, forming a bearish reversal candle.
Drop to Daily FVG Zone (~$104,000–$105,000)
This larger Daily Fair-Value Gap (blue box lower on the chart) coincides with strong weekly support—an ideal zone for dip buyers.
Recovery Rally
After absorbing selling pressure in the FVG, BTC bounces back toward the established resistance, setting up a second test of $112K.
Key Trigger: Clear bearish price action (e.g., engulfing or pin-bar) in the $111.8K–$112.5K zone, followed by a daily close below the pivot at $110.6K.
🎯 How to Trade These Setups
Bullish Entry:
Wait for daily close > $112K
Enter on pullback into $111K–$111.2K (H4 order block)
Stop below $110.6K pivot; target new highs above $113K+
Bearish Entry:
Look for bearish reversal signals in $111.8K–$112.5K
Enter on break & close below $110.6K pivot
Target $104K–$105K (Daily FVG); stop above $112.5K
Note: The pivot at $110.6K is your first “line in the sand” for bias—trade in the direction of the break, and use the major resistance zone to confirm strength or failure. Always manage your risk and adjust to how price actually unfolds!
Just a Heads-Up:
This is my take on the charts—not gospel, not financial advice, and definitely not a crystal ball 🔮. Trading is part skill, part patience, and part “what just happened?” 😅
We all see things a little differently, and that’s the beauty of it. So if you’ve got a hot take, wild theory, or just want to drop some chart wisdom—hit the comments!
Let’s grow, learn, and laugh through the madness together. 🚀📈
Each one, teach one.
— Phoenix FX Team 🔥🦅
10.07.25 Morning ForecastPairs on Watch -
FX:USDJPY (live position)
FX:EURNZD
FX:EURUSD
A short overview of the instruments I am looking at for today, multi-timeframe analysis down to what I will be looking at for an entry. Enjoy!

#SENSEX Intraday Support and Resistance Levels - 10/07/2025Sensex is expected to open flat today, continuing the consolidation observed in the past few sessions. The price action remains range-bound with key support near 83400 and resistance around 83600 levels.
Currently, Sensex is hovering near its critical range with buyers and sellers struggling for control. A breakout above the 83500–83600 zone may trigger fresh bullish momentum with targets at 83800, 83950, and 84100+. Sustained movement above 84100 could signal a stronger trend reversal.
On the downside, a breakdown below the 83400 level could lead to weakness, with immediate targets at 83050, 82900, and 82800-.
#NIFTY Intraday Support and Resistance Levels - 10/07/2025Nifty is also expected to open flat today, reflecting a similar consolidation pattern observed in recent sessions. The index continues to trade within a tight range, signaling indecisiveness among traders and lack of strong directional momentum.
Currently, Nifty is oscillating in a consolidation zone between 25550 resistance and 25450 support. A breakout above 25550 could trigger fresh long entries, with potential upside targets at 25600, 25650, and 25750+. Sustained strength above 25750 may open the way for extended bullish movement.
Conversely, a breakdown below the 25450 level may lead to short opportunities, with downside targets at 25350, 25300, and 25250-.
Until the index decisively breaks out of this range, sideways movement is likely to persist. Traders should wait for confirmation before taking aggressive directional positions.
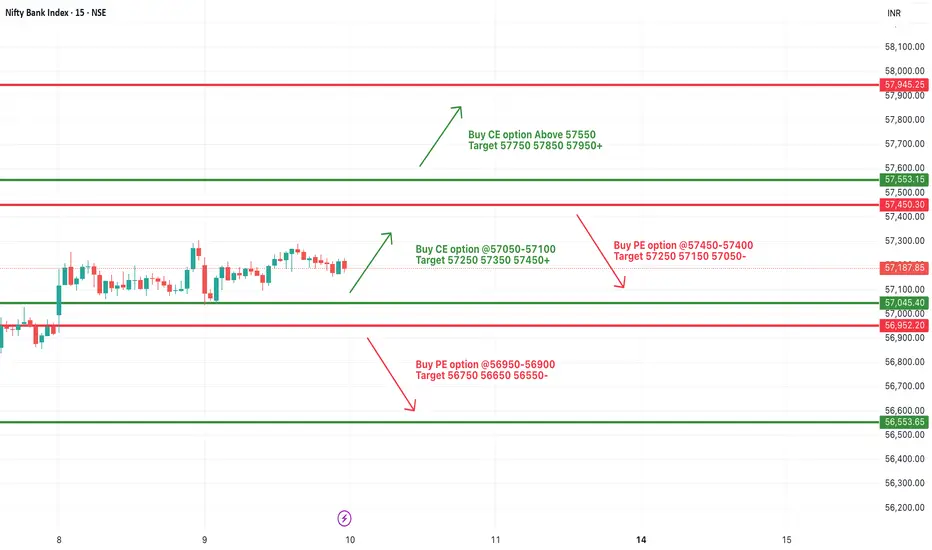
[INTRADAY] #BANKNIFTY PE & CE Levels(10/07/2025)Bank Nifty is expected to open flat today due to the continued consolidation seen over the last few sessions. The index is trading within a tight range between 57450 on the upside and 57050 on the downside, indicating indecision in the market.
A sustain above the 57050–57100 zone could initiate fresh buying momentum, potentially pushing prices towards the targets of 57250, 57350, and 57450+. Sustained move above 57550 may further lead to an extended rally toward 57750, 57850, and even 57950+ levels.
On the other hand, if the index breaks below the 56950–56900 level, it may invite fresh selling pressure. In such a scenario, downside targets are seen at 56750, 56650, and 56550-.
Until a decisive move happens beyond the upper or lower bounds, expect sideways action within the current consolidation range. Traders are advised to wait for a breakout from the range for directional trades.
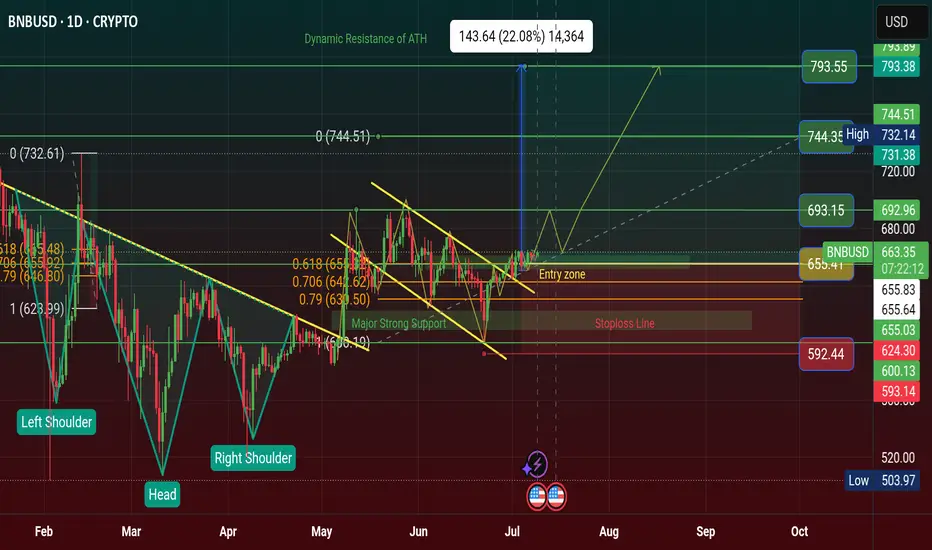
$BNB Chart Showing Bullish Flag Pattern and Price Will Hit +$750CRYPTOCAP:BNB Previously Chart showing Bullish Inverse Head and Shoulder Pattern and Gain Profit of Range. It's a Reversal Pattern .
Now Chart Showing a Bullish Flag Pattern and it's Continuation Pattern. Time to Bullish for BNB Coin for FOMC 10th July Thursday 2025.
The upsloping 20-day EMA and the RSI just above the midpoint indicate a slight edge to the bulls. If the $665 resistance falls, the BNBUSD pair could rise to $675 and then to $698.
Sellers are likely to pose a solid challenge at $698 because a break above it could propel the pair to $732. I'm guess BNB Price Breakout of ATH and $888 Mystery will Happen.
This optimistic view will be negated in the near term if the price turns down and breaks below the moving averages. The pair may then drop to $636.
NEWSBTC: BNB Price Gears Up for Upside Break — Will Bulls Deliver?
BNB price is gaining pace above the $650 support zone. The price is now showing positive signs and might aim for more gains in the near term.
BNB price is attempting to recover from the $620 support zone.
The price is now trading above $655 and the 100-hourly simple moving average.
There is a key contracting triangle forming with resistance at $662 on the hourly chart of the BNB/USD pair (data source from Binance).
The pair must stay above the $655 level to start another increase in the near term.
BNB Price Eyes More Gains
After forming a base above the $620 level, BNB price started a fresh increase. There was a move above the $645 and $650 resistance levels, like Ethereum and Bitcoin.
The price even surged above the $660 level. A high was formed at $666 before there was a downside correction. The price dipped below the 50% Fib retracement level of the upward move from the $650 swing low to the $666 swing high.
The price is now trading above $655 and the 100-hourly simple moving average. On the upside, the price could face resistance near the $662 level. There is also a key contracting triangle forming with resistance at $662 on the hourly chart of the BNB/USD pair.
The next resistance sits near the $665 level. A clear move above the $665 zone could send the price higher. In the stated case, BNB price could test $672. A close above the $672 resistance might set the pace for a larger move toward the $680 resistance. Any more gains might call for a test of the $700 level in the near term.
Another Decline? If BNB fails to clear the $662 resistance, it could start another decline.
Initial support on the downside is near the $655 level and the 61.8% Fib retracement level of the upward move from the $650 swing low to the $666 swing high. The next major support is near the $650 level.
The main support sits at $644. If there is a downside break below the $644 support, the price could drop toward the $632 support. Any more losses could initiate a larger decline toward the $620 level.
Technical Indicators
Hourly MACD – The MACD for BNB/USD is gaining pace in the bullish zone.
Hourly RSI (Relative Strength Index) – The RSI for BNB/USD is currently above the 50 level.
Major Support Levels – $655 and $650.
Major Resistance Levels – $662 and $665.
#Write2Earn #BinanceSquareFamily #BinanceTurns8 #BNB #SUBROOFFICIAL
Disclaimer: This article is for informational purposes only and does not constitute financial advice. Always conduct your own research before making any investment decisions. Digital asset prices are subject to high market risk and price volatility. The value of your investment may go down or up, and you may not get back the amount invested. You are solely responsible for your investment decisions and Binance is not available for any losses you may incur. Past performance is not a reliable predictor of future performance. You should only invest in products you are familiar with and where you understand the risks. You should carefully consider your investment experience, financial situation, investment objectives and risk tolerance and consult an independent financial adviser prior to making any investment.
Gold continues downtrend today✏️#GOLD view
Yesterday's D1 candle confirmed the decline in gold prices when the selling pressure returned below the liquidity candle wick. The extension of the downtrend will continue today.
Yesterday's strong support zone 3297 has become today's resistance zone, this is the SELL point today when there is confirmation from the selling side in this zone.
3310 The confluence resistance zone between the trendline and the US Session Resistance is noted in today's SELL strategy. The previous SELL Target 3352 orders pay attention to the reaction at 3377.
📈Key Level
SUPPORT 3277-3250
RESISTANCE 3297-3310-3328
SELL Trigger: Price cannot break 3297
SELL DCA Trigger: Break 3276
Target: 3250
BUY Trigger:PriceTrading above 3276
Leave your comments on the idea. I am happy to read your views.

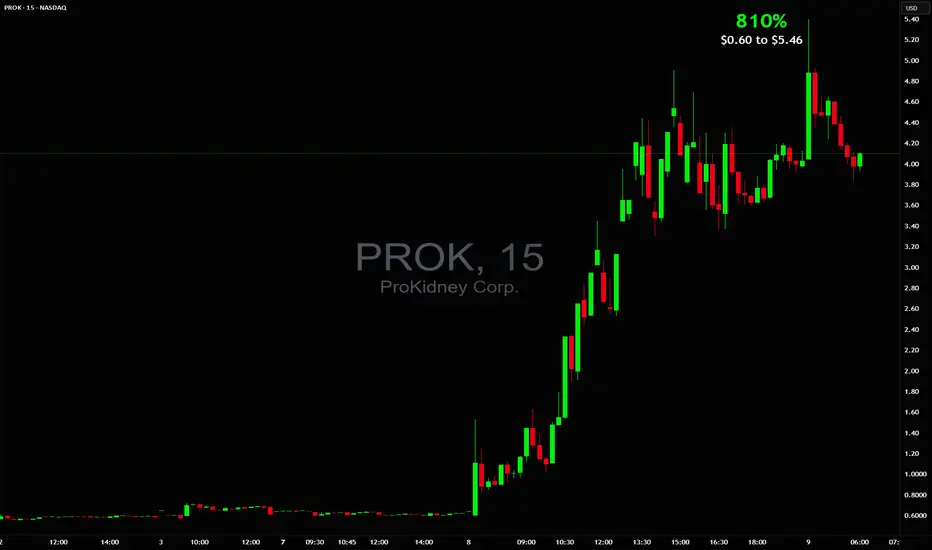
BIG 810% in 1 day $0.60 to $5.46💥BIG 810% in 1 day 📈 $0.60 to $5.46 there were almost more halts than candlesticks that's how wildly it traded NASDAQ:PROK
Other active stocks: NASDAQ:SCAG NASDAQ:BTCS NYSE:SRFM NASDAQ:BMGL NYSE:WOLF
#stocks #stockmarket #trading #trader #daytrade #strategy #teamwork #chart #analysis
09.07.25 Morning ForecastPairs on Watch -
FX:GBPUSD
FX:EURAUD
OANDA:JP225USD
FX:USDCAD
A short overview of the instruments I am looking at for today, multi-timeframe analysis down to what I will be looking at for an entry. Enjoy!

Gold Price Analysis July 9GOLD XAU/USD ANALYSIS – CONFIRMING THE CONTINUATION OF THE BEARISH WAVE
Yesterday's D1 candle confirmed the downward momentum of gold when the selling pressure returned strongly below the liquidity candle wick. This shows that the selling pressure is still dominant and the downward momentum is likely to continue in today's session.
🔹 IMPORTANT RESISTANCE ZONE: 3297
The 3297 zone – which was a strong support in yesterday's session – has now turned into a resistance zone. This is a potential SELL zone for the day, especially if there is a confirmation signal from the sellers at this price zone.
🔹 CONFUSION RESISTANCE ZONE: 3310
The 3310 area is the confluence between the downtrend line and the resistance zone of the US session – which needs special attention in the SELL strategy. If the price approaches this zone, expect a reaction from the selling side to return.
🎯 SUGGESTED STRATEGY:
SELL when price does not break through 3297 (confirm selling pressure at resistance)
SELL DCA if price breaks down to 3276
Target: 3250
BUY only considered if price holds 3276 and has a bullish reaction
📌 Key Levels:
Support: 3277 – 3250
Resistance: 3297 – 3310 – 3328
Important reaction zone: 3377 (if price rebounds)