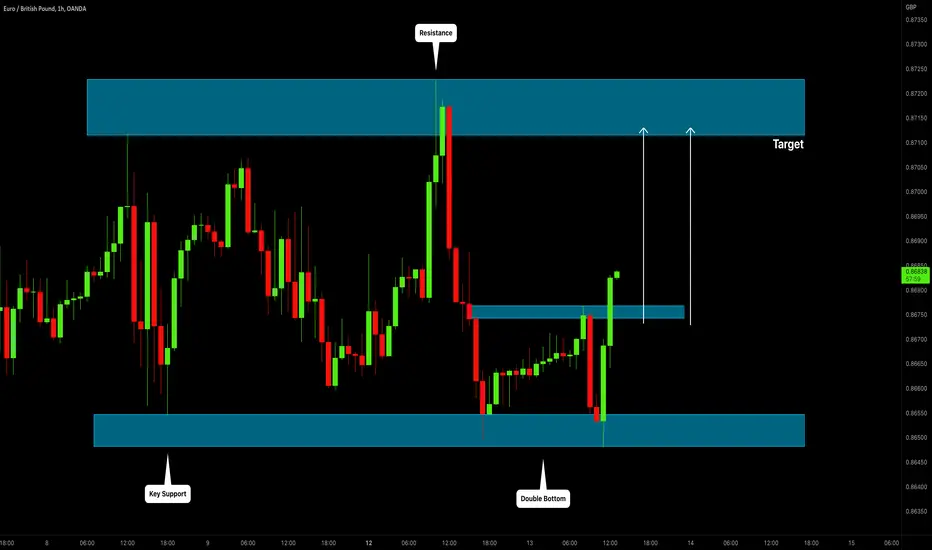
EURGBP: Classic Bullish Setup 🇪🇺🇬🇧
EURGBP is trading within a horizontal trading range.
Approaching its support, the price formed a double bottom formation and broke its neckline then.
I expect a bullish move to 0.8715 level now.
❤️If you have any questions, please, ask me in the comment section.
Please, support my work with like, thank you!❤️
Priceactionstrategy
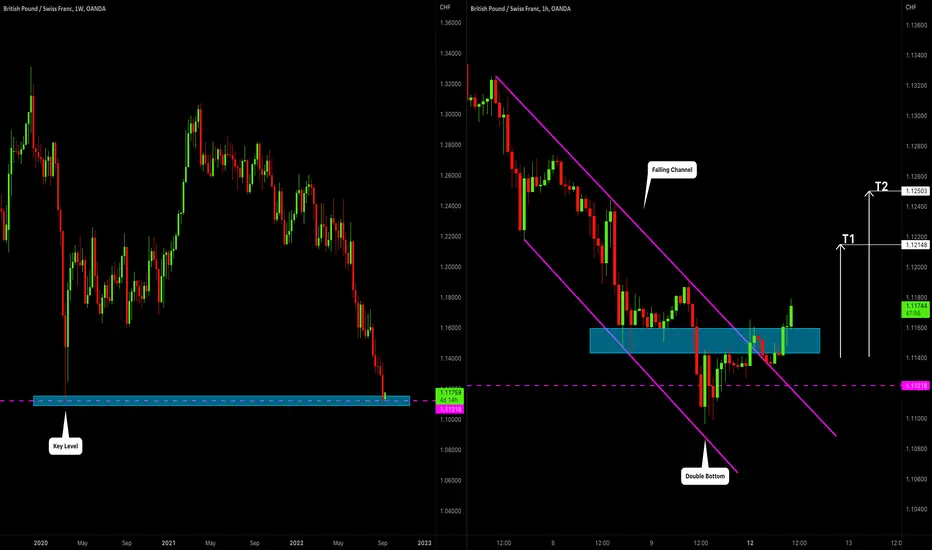
GBPCHF: Pullback From Key Level 🇬🇧🇨🇭
GBPCHF reached 2 years' low last week.
Analyzing the reaction to that structure on lower time frames,
I spotted a confirmed bullish breakout of a falling parallel channel on 4H,
and a completed double bottom formation.
I believe that the pair will grow now.
Goals: 1.1215 / 1.125
❤️If you have any questions, please, ask me in the comment section.
Please, support my work with like, thank you!❤️
Learn How to Trade Head & Shoulders Pattern | Full Guide 📚
Learn my step-by-step guide for Head & Shoulders pattern trading.
This video includes important theory and real market examples.
❤️Please, support this video with like and comment!❤️

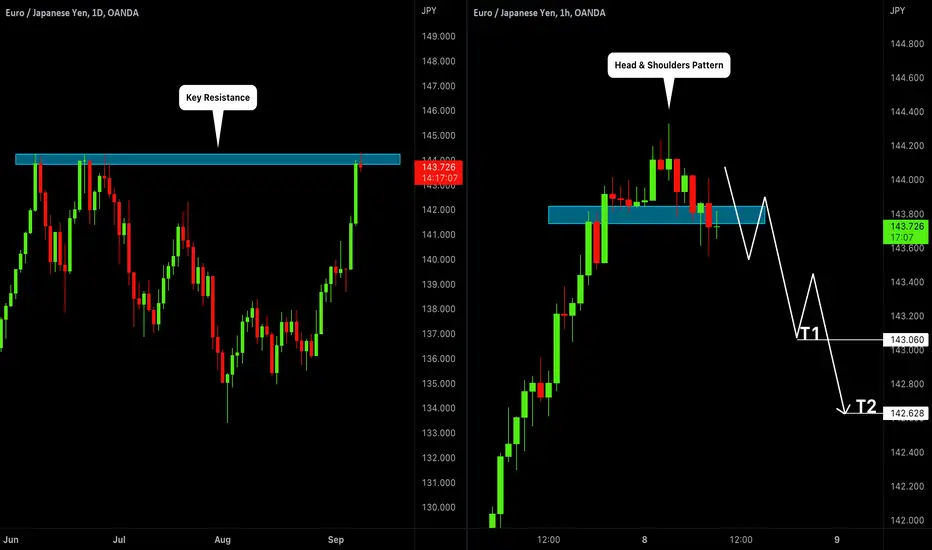
EURJPY: Pullback From Key Level 🇪🇺🇯🇵
Hey traders,
EURJPY reached year's highs.
I expect a pullback from the underlined blue structure to 143.06 / 142.63 levels.
I see a tiny little head and shoulders pattern on 1H time frame, confirming the strength of the underlined resistance.
❤️If you have any questions, please, ask me in the comment section.
Please, support my work with like, thank you!❤️
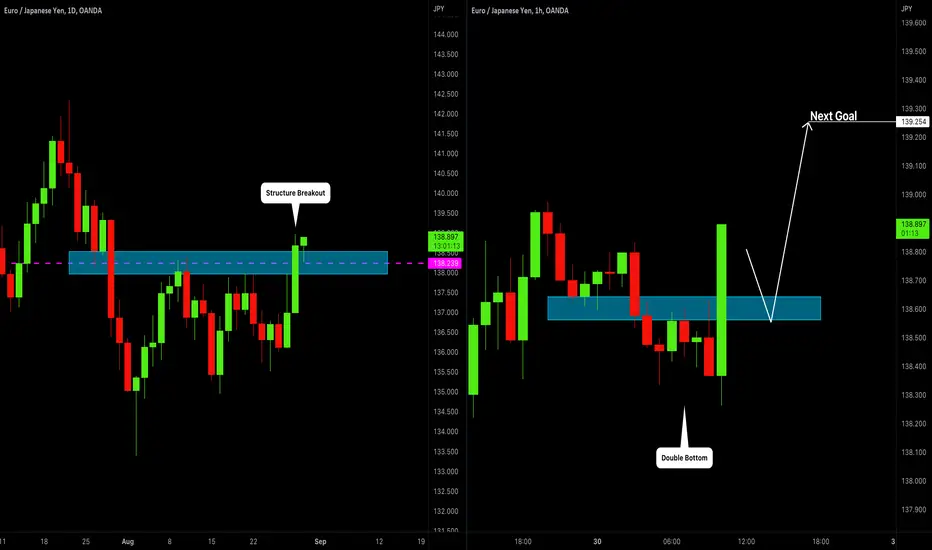
EURJPY: Very Bullish Setup 🇪🇺🇯🇵
EURJPY broke and closed above a key daily structure resistance yesterday.
Retesting the broken structure, the price formed a double bottom formation and broke its neckline then.
I believe that it may trigger a bullish move at least to 139.25
❤️If you have any questions, please, ask me in the comment section.
Please, support my work with like, thank you!❤️
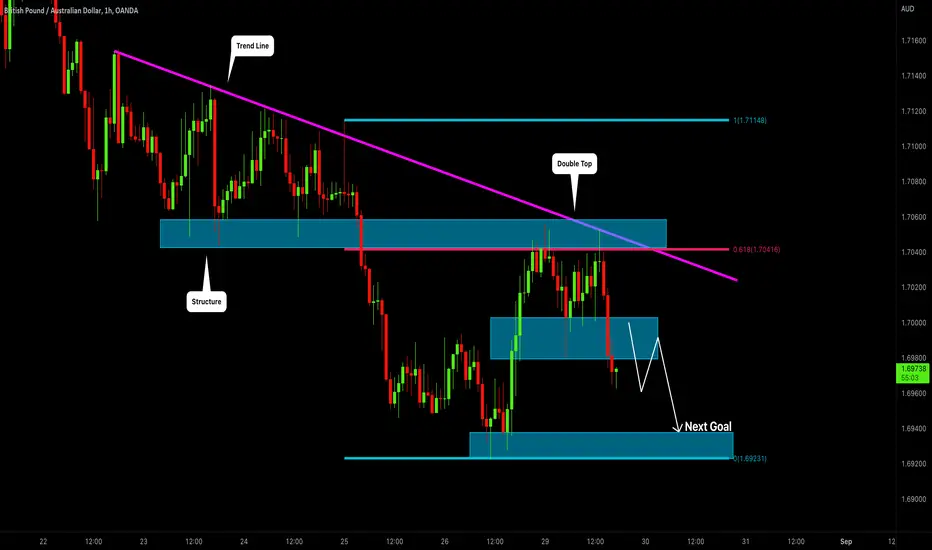
GBPAUD: Classic Trend-Following 🇬🇧🇦🇺
GBPAUD formed a double top trading within a peculiar confluence zone on an hourly time frame.
That zone is based on an intersection between a falling trend line and a horizontal supply area.
I believe that the pair may drop at least to 1.6939 level.
❤️If you have any questions, please, ask me in the comment section.
Please, support my work with like, thank you!❤️
EURCHF: Bearish Trend Continuation 🇪🇺🇨🇭
Hey traders,
EURCHF is trading in a global bearish trend.
Lower highs are perfectly respecting a falling trend line on a daily.
Approaching that earlier this week, the price formed a double top formation.
The pair broke and closed below its neckline then.
I believe that the market will keep falling now.
Goal - 0.957
❤️If you have any questions, please, ask me in the comment section.
Please, support my work with like, thank you!❤️

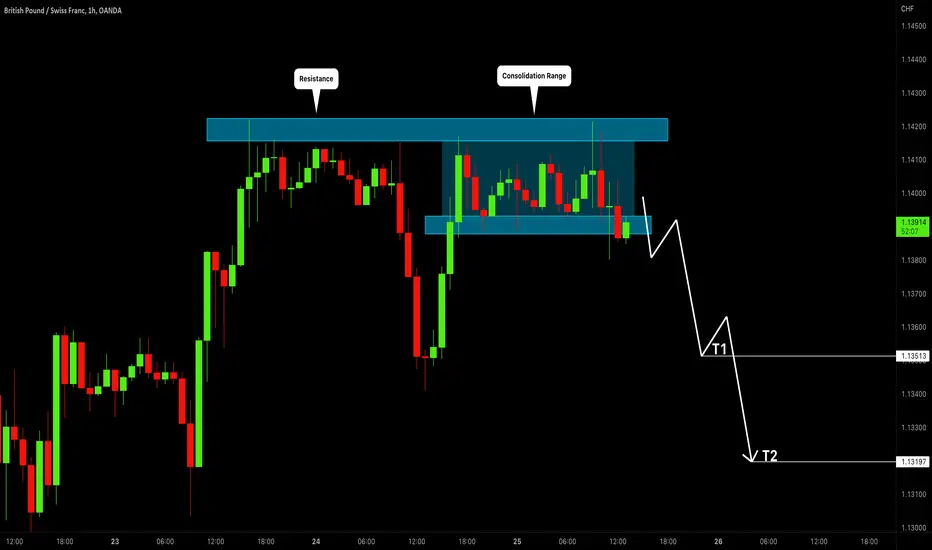
GBPCHF: Great Shorting Opportunity Explained 🇬🇧🇨🇭
GBPCHF is coiling around a solid intraday structure resistance.
The price was trading for some time within a horizontal range.
Just a couple of minutes ago, the pair broke and closed below the support of the range.
We see its retest now.
I believe that the pair will drop.
Goals: 1.13513 / 1.132
❤️If you have any questions, please, ask me in the comment section.
Please, support my work with like, thank you!❤️
AUDCHF: Bullish Continuation Pattern 🇦🇺🇨🇭
AUDCHF has recently dropped to a key daily structure support.
The price formed a double bottom on that on a 4H time frame.
I expect a bullish move now to 0.6668 / 0.67
❤️If you have any questions, please, ask me in the comment section.
Please, support my work with like, thank you!❤️

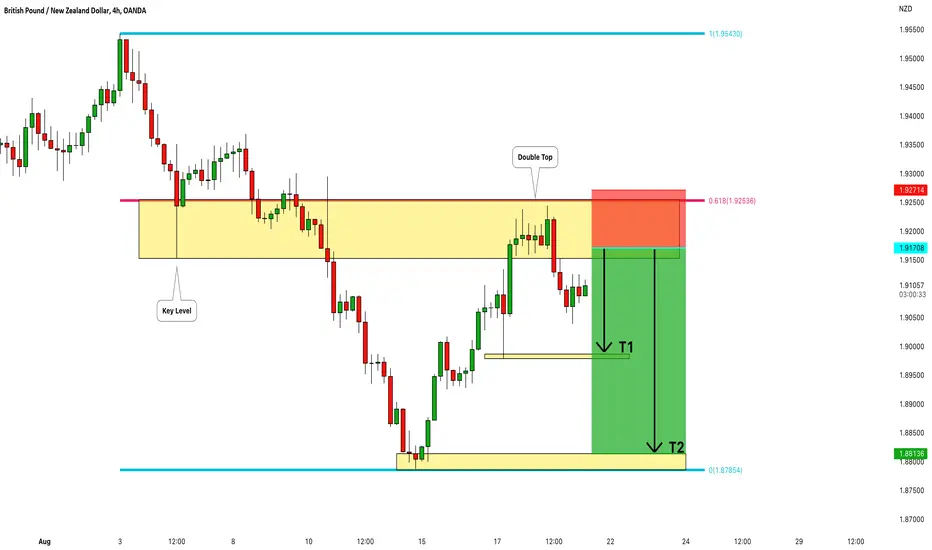
GBPNZD: Bearish Outlook 🇬🇧🇳🇿
GBPNZD is coiling around a peculiar intraday zone of confluence:
we see a perfect match between a horizontal demand area and 618 retracement of the last bearish impulse.
I expect a bearish move to 1.899 / 1.881 levels from that.
❤️If you have any questions, please, ask me in the comment section.
Please, support my work with like, thank you!❤️
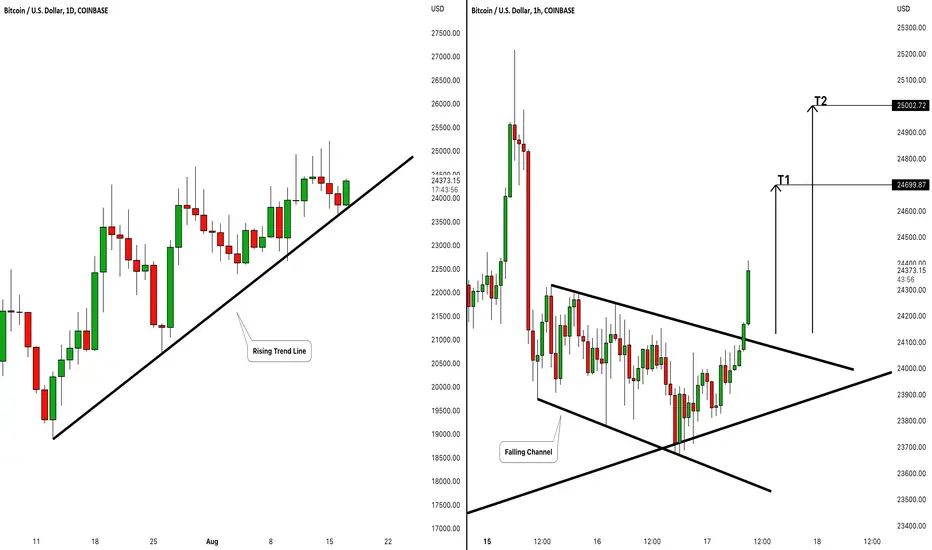
BITCOIN (BTCUSD): Bullish Continuation ₿
Bitcoin is taking off from a major rising trend line.
The price broke a resistance line of a falling parallel channel after its test
and heading towards 24700 / 25000 structures now.
Consider an occasional retest for entries.
❤️If you have any questions, please, ask me in the comment section.
Please, support my work with like, thank you!❤️
Learn How to Trade Double Top Formation | Full Guide 📚
Your ultimate guide for double top pattern trading.
Entry selection / stop placement / target selection explained.
Meaning of the pattern and identification rules.
Important tips & real market exampe.
❤️Please, support this video with like and comment!❤️

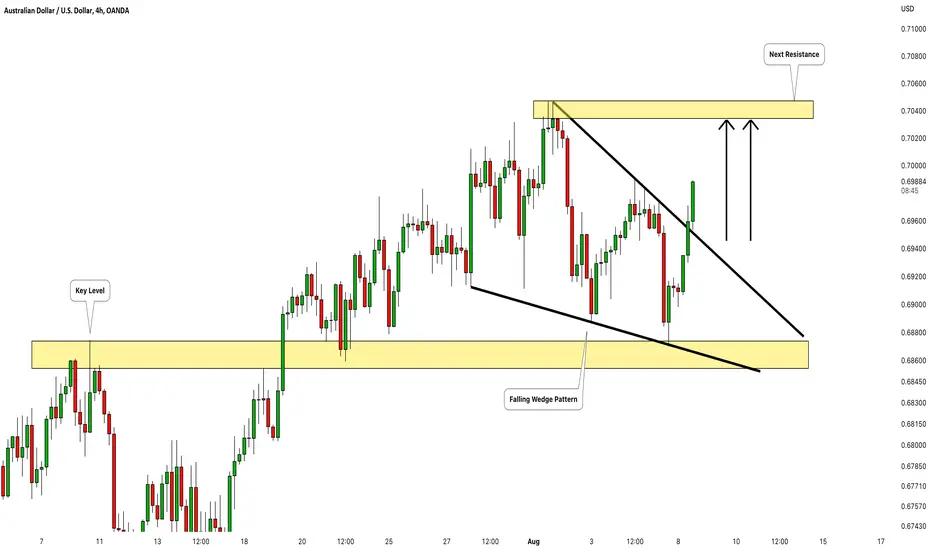
AUDUSD: Bullish Continuation 🇦🇺🇺🇸
AUDUSD reached a solid horizontal support last week.
The market bounced nicely from that and managed to break and close above a resistance line of a falling wedge pattern on 4H.
I believe that the pair will keep growing at least to 0.7034.
For entries, consider an occasional retest!
❤️If you have any questions, please, ask me in the comment section.
Please, support my work with like, thank you!❤️
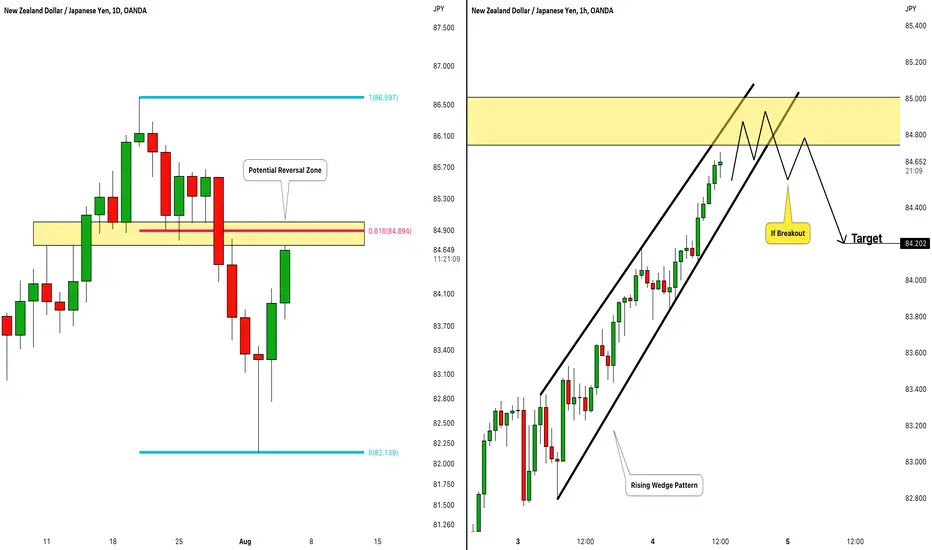
NZDJPY: Key Structure Ahead! Your Plan: 🇳🇿🇯🇵
NZDJPY is approaching an important zone of confluence on a daily.
We see a perfect match between a horizontal structure resistance and 618 retracement of the last bearish impulse.
To catch a bearish move from the underlined zone, watch a rising wedge pattern on 1H time frame.
Your trigger to short will be its bearish breakout (at least an hourly candle close below its support).
Then a bearish continuation will be expected to 84.2 level.
Alternatively, a bullish breakout of the underlined area will push the market to higher structure levels.
❤️If you have any questions, please, ask me in the comment section.
Please, support my work with like, thank you!❤️
NZDUSD SELL order Price in the double top zone on HTF
Price within a bearish correction towards the double top zone
SELL Order
Entry: 0.63213
SL: 0.63526
TP: 0.61853
RRR: 1:4.35

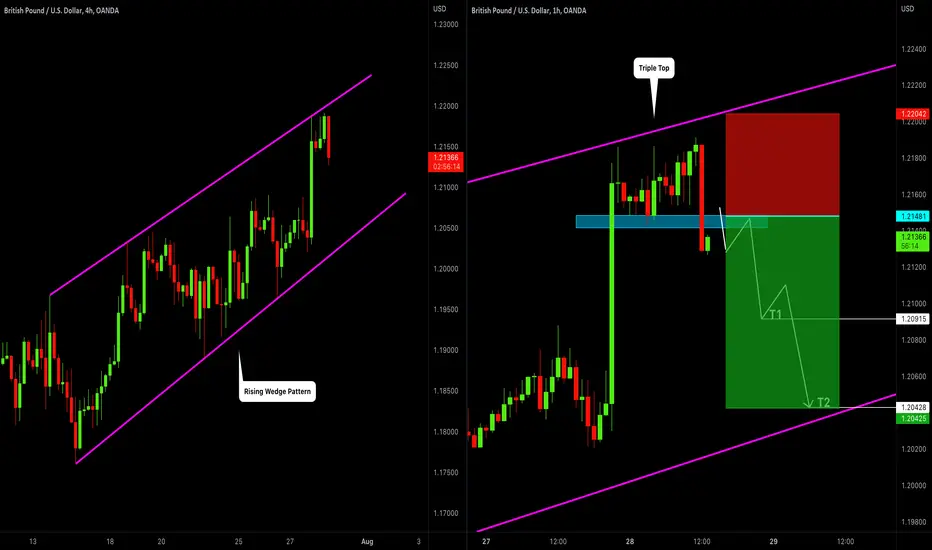
GBPUSD: Classic Bearish Setup 🇬🇧🇺🇸
GBPUSD is trading in a rising wedge pattern on 4H.
The price reached its resistance yesterday.
Analyzing the reaction of the price to that on 1H time frame, I spotted a triple top formation
and a confirmed neckline breakout.
I believe that the pair will drop now.
Goals: 1.20915 / 1.2045
❤️If you have any questions, please, ask me in the comment section.
Please, support my work with like, thank you!❤️
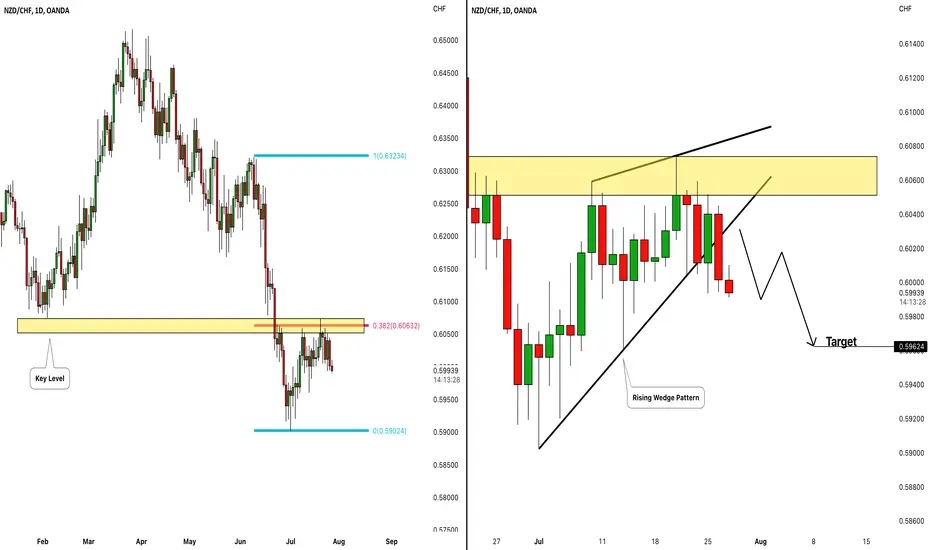
NZDCHF: Bearish Move From Key Level 🇳🇿🇨🇭
NZDCHF reached a key structure resistance last week.
The market was rejected nicely from that and broke a support line of a rising wedge pattern then.
I believe that the pair will keep falling.
Initial target - 0.596
❤️If you have any questions, please, ask me in the comment section.
Please, support my work with like, thank you!❤️
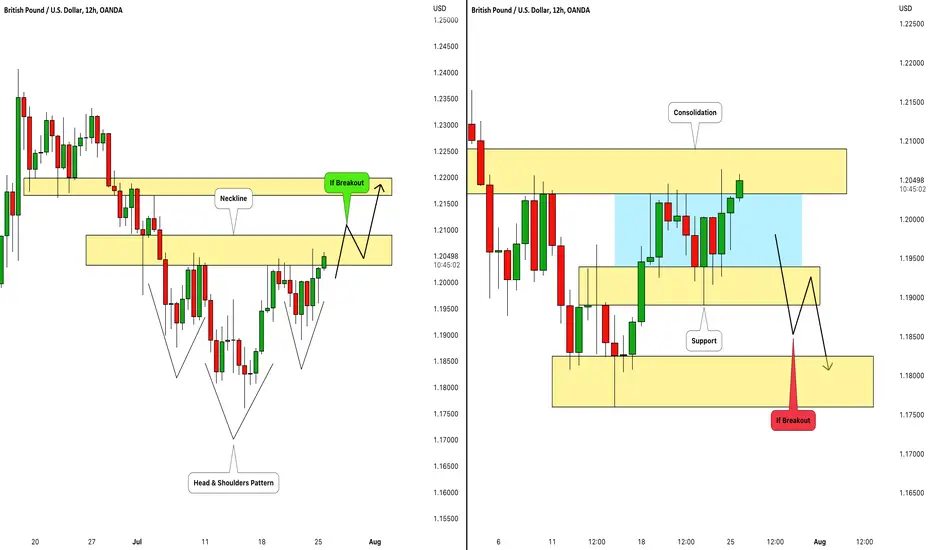
GBPUSD: What to Look at This Week 🇬🇧🇺🇸
Take a look, what I spotted on GBPUSD:
the pair formed an inverted head and shoulders pattern on 12H time frame.
1.2035 - 1.209 is its neckline. If the price breaks and closes above that,
I will expect a bullish move at least to 1.217 structure.
However, remember that a global trend in bearish.
Zooming in the same chart, we can spot a horizontal consolidation range.
1.189 - 1.194 is its support. If the price breaks and closes below that,
a bearish move will be expected to 1.18 support.
Wait for a breakout as your confirmation here.
What do you expect?
❤️If you have any questions, please, ask me in the comment section.
Please, support my work with like, thank you!❤️
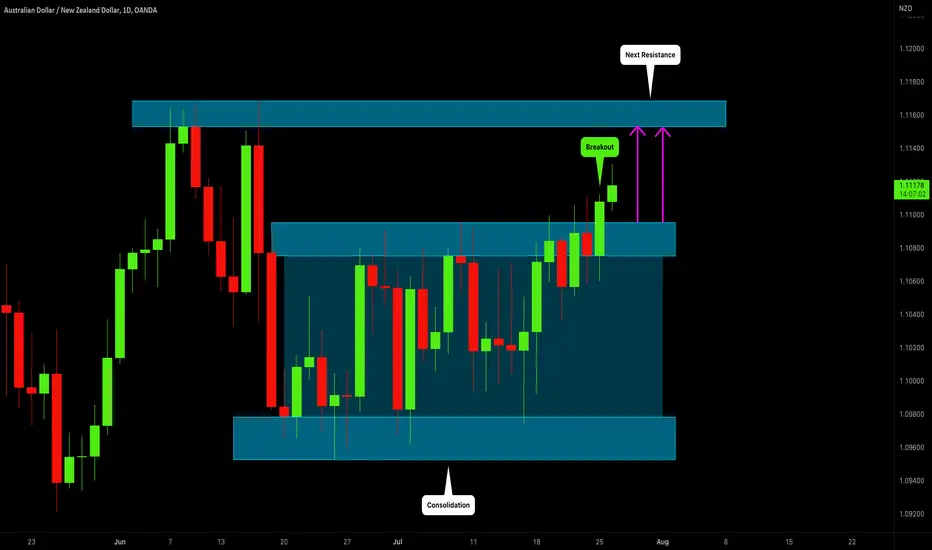
AUDNZD: Breakout & Bullish Continuation🇦🇺🇳🇿
AUDNZD was consolidating within a horizontal trading range since 20th of June.
The price finally broke and closed above its upper boundary yesterday.
Now, I believe that the pair will keep growing.
Next resistance - 1.115
❤️If you have any questions, please, ask me in the comment section.
Please, support my work with like, thank you!❤️
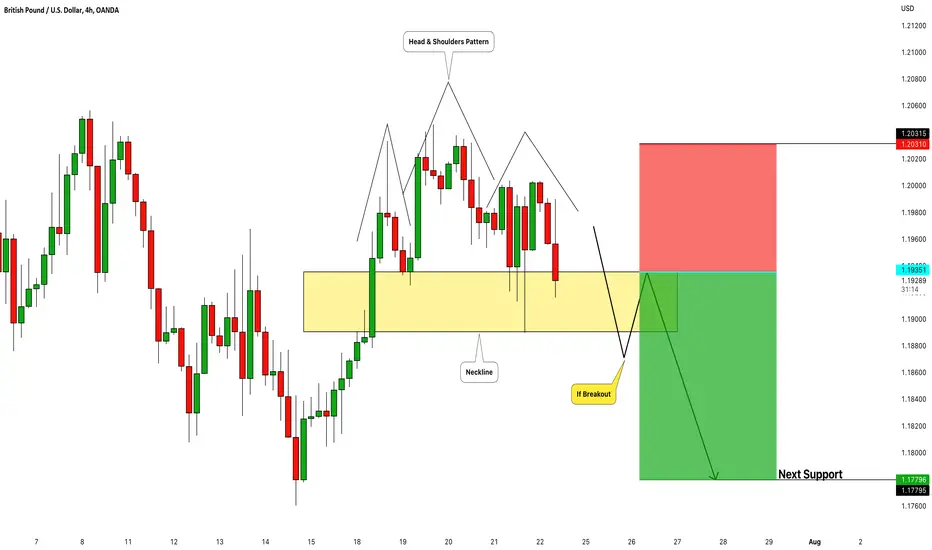
GBPUSD: Important Update! 🇬🇧🇺🇸
So we have nicely predicted a bearish movement on GBPUSD yesterday.
The price formed a head and shoulder pattern then.
1.189 - 1.1935 is its neckline.
To catch a further decline, I would suggest waiting for its breakout (you need a 4H candle close below to confirm the violation).
Then, a bearish continuation will be expected at least to 1.178 level.
However, if the price breaks a head level and sets a new high, the setup will be invalid.
❤️If you have any questions, please, ask me in the comment section.
Please, support my work with like, thank you!❤️
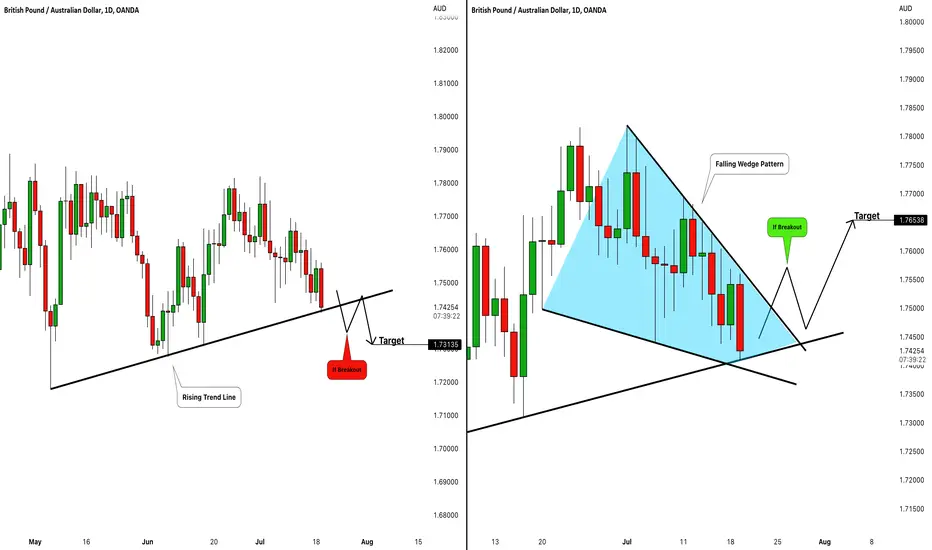
GBPAUD: Important Decision Ahead 🇬🇧🇦🇺
Hey traders,
GBPAUD is approaching a solid rising trend line on a daily time frame.
Depending on the reaction of the price to that, I see 2 potential scenarios:
If the price breaks and closes below that,
I will expect a bearish continuation to 1.731 level.
If bulls violate a resistance line of a tiny rising wedge pattern and close above that,
I will expect a bullish movement at least to 1.765
I believe that probabilities are on a bullish side.
However, let's see what will happen!
What do you expect?
❤️If you have any questions, please, ask me in the comment section.
Please, support my work with like, thank you!❤️
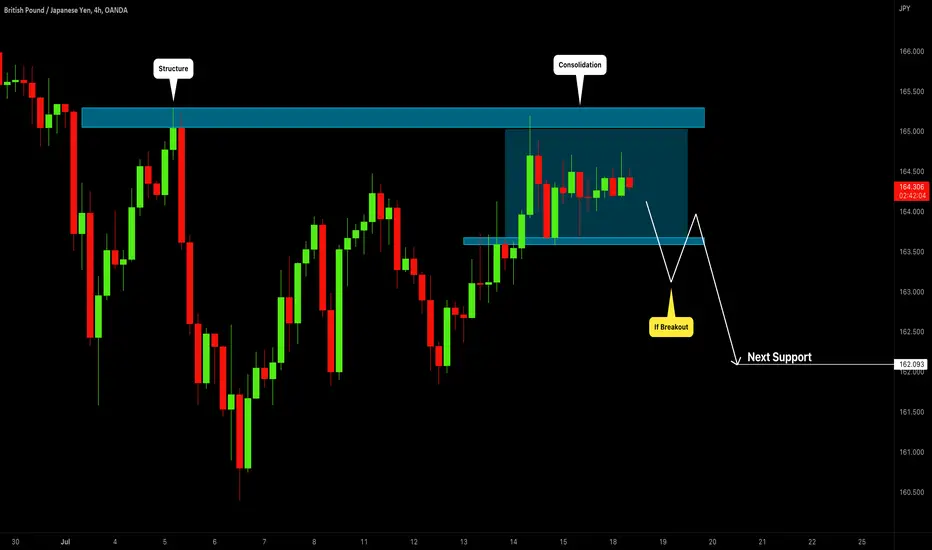
GBPJPY: Your Trading Plan For This Week 🇬🇧🇯🇵
GBPJPY reached a solid horizontal structure resistance last week.
The pair started to consolidate within a narrow trading range then.
To short wisely, I suggest waiting for a bearish breakout of its horizontal support.
You need an hourly candle close below 163.58 - 163.67 area to confirm the breakout.
Then, a bearish continuation will be expected at least to 162.1 level.
Alternatively, if the price breaks the resistance of the range to the upside, a bullish continuation will be expected.
❤️If you have any questions, please, ask me in the comment section.
Please, support my work with like, thank you!❤️
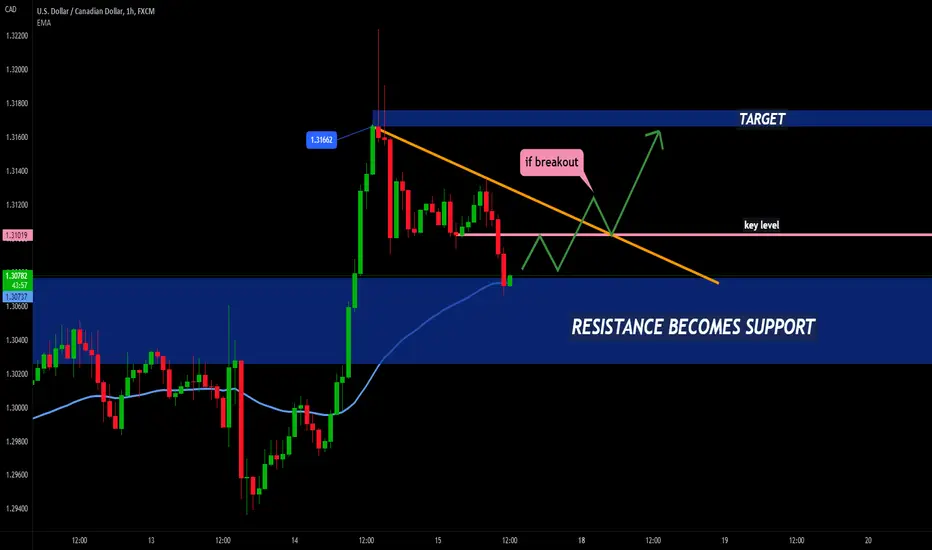
USDCAD - RESISTANCE BECOMES SUPPORT 🚀
the USDCAD price breaks the daily resistance level ,the old resistance becomes new support ✔
i predict a bullish move 📈 i'm waiting for breakout and retest 📉
TARGET: 1.31662 🎯
...
if you agreed with this IDEA, please leave a LIKE, SUBSCRIBE or COMMENT!