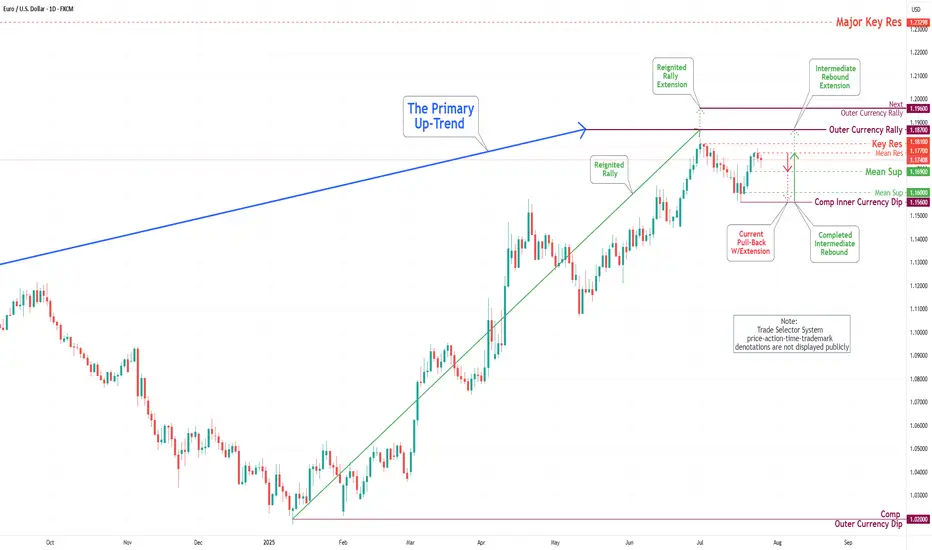
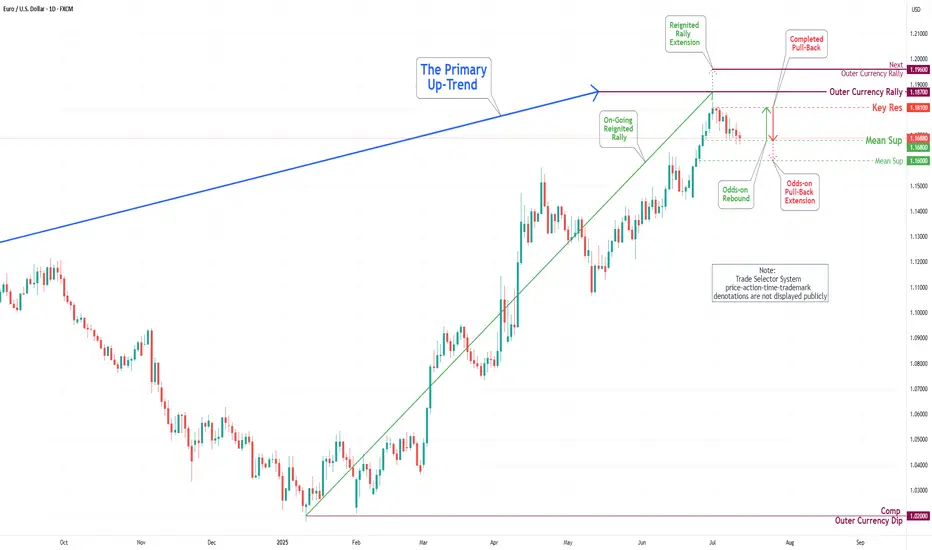
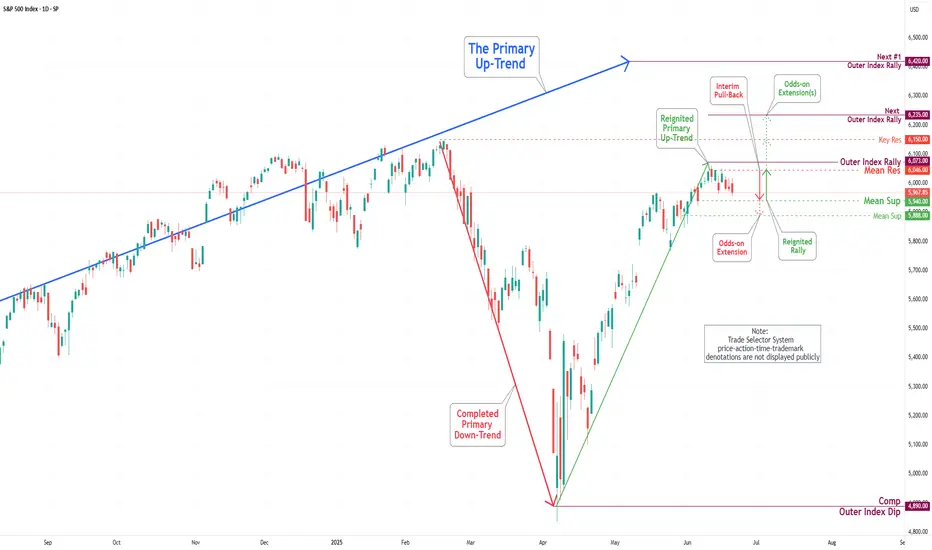
EUR/USD Daily Chart Analysis For Week of August 1, 2025Technical Analysis and Outlook:
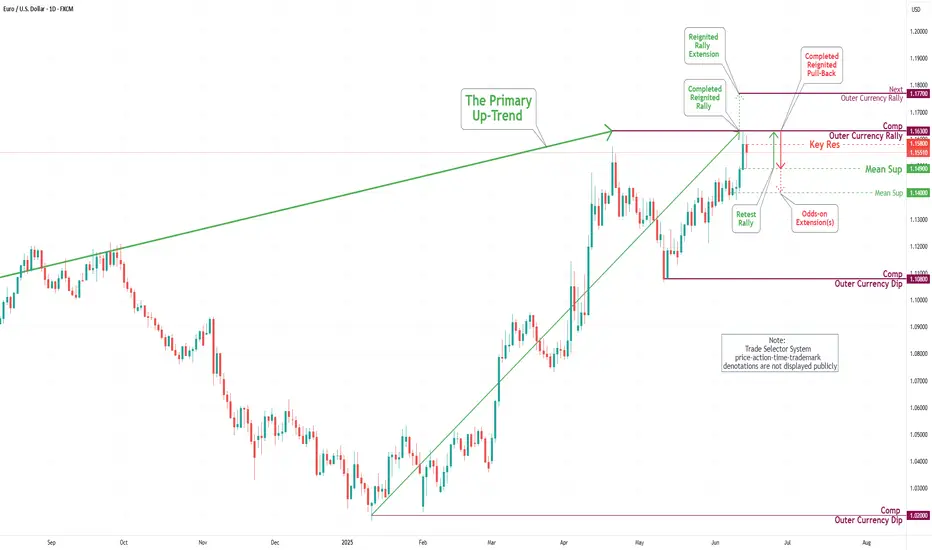
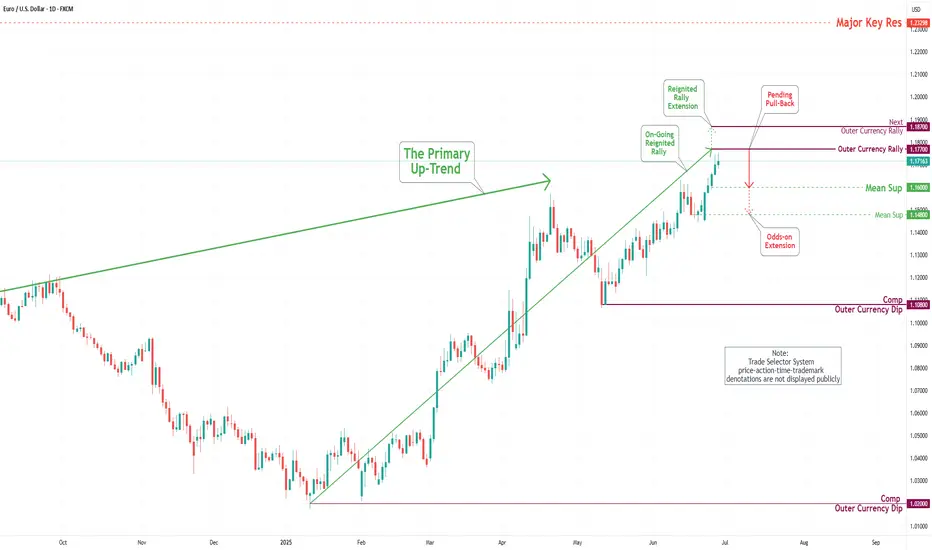
In this week's trading session, the Euro experienced a significant drop, reaching the 1.139 level, and completing what is referred to as the Inner Currency Dip. As a result of the completion, the currency reversed direction and made a strong rebound, hitting the Mean Resistance level at 1.160. Recent analyses suggest that the Euro is likely to enter a sustained downward move after retesting the Mean Resistance at 1.160, with the target set to revisit the completed Inner Currency Dip at 1.139. However, it is essential to consider the possibility of continued upward momentum towards the Mean Resistance level of 1.177. Such a movement could trigger a significant rebound and lead to the completion of the Outer Currency Rally at 1.187.
Priceanalysis
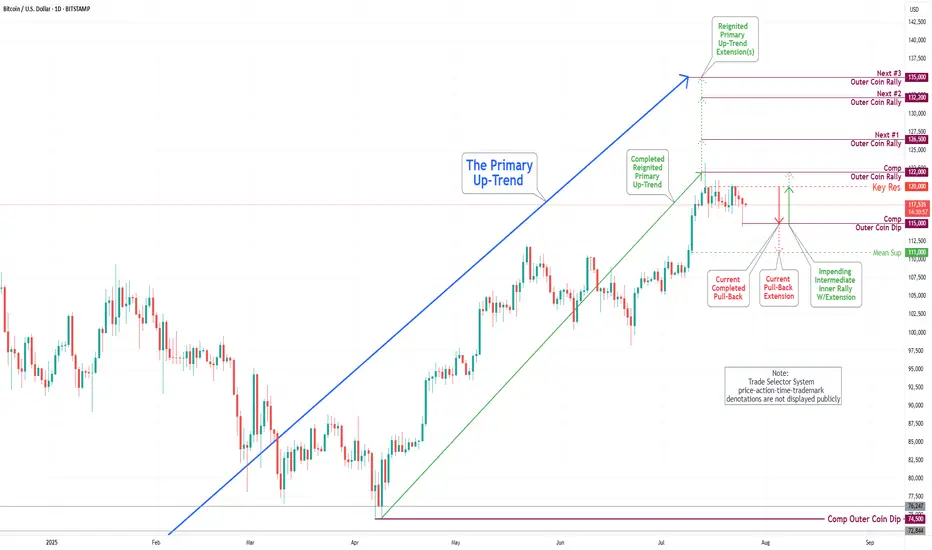
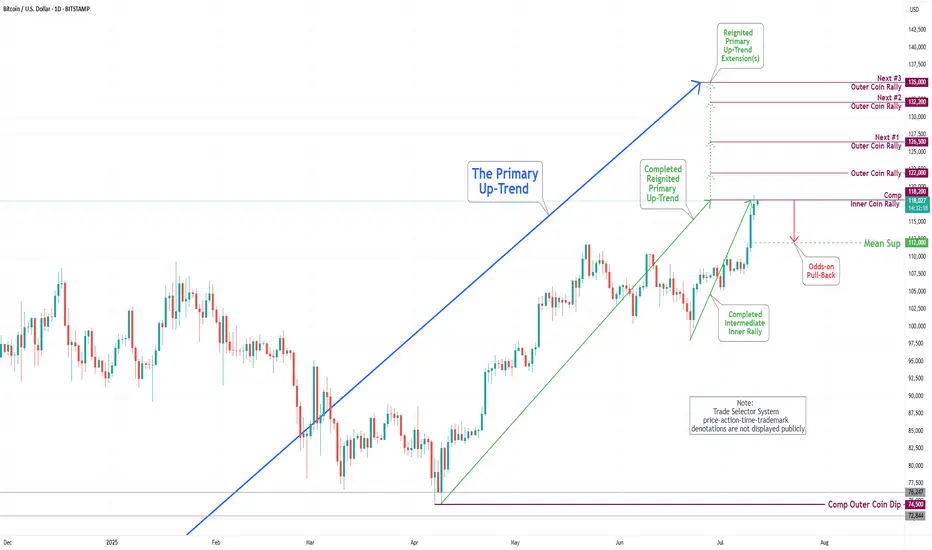
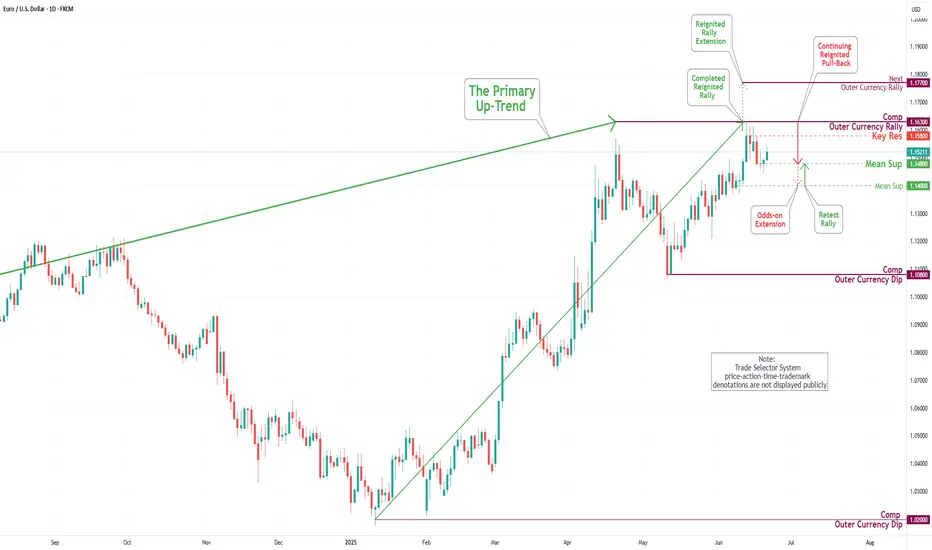
Bitcoin(BTC/USD) Daily Chart Analysis For Week of August 1, 2025Technical Analysis and Outlook:
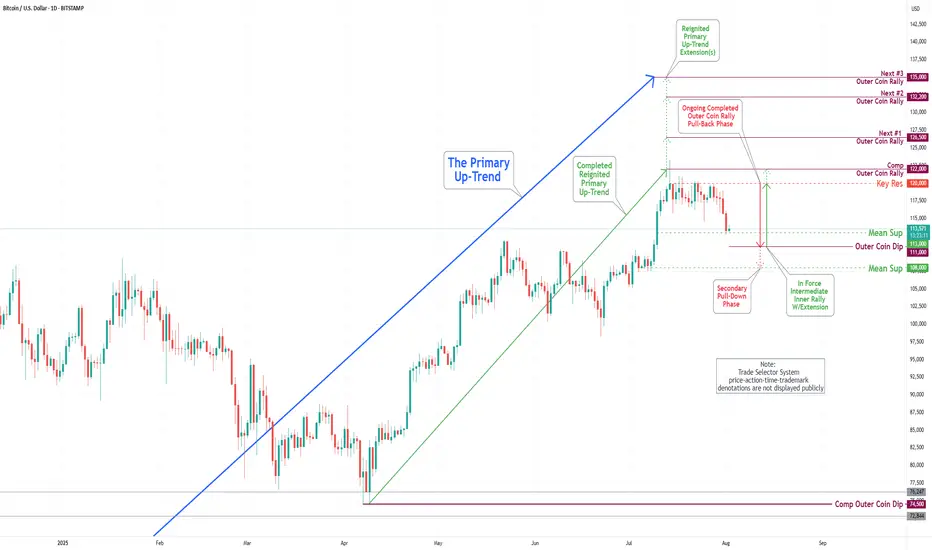
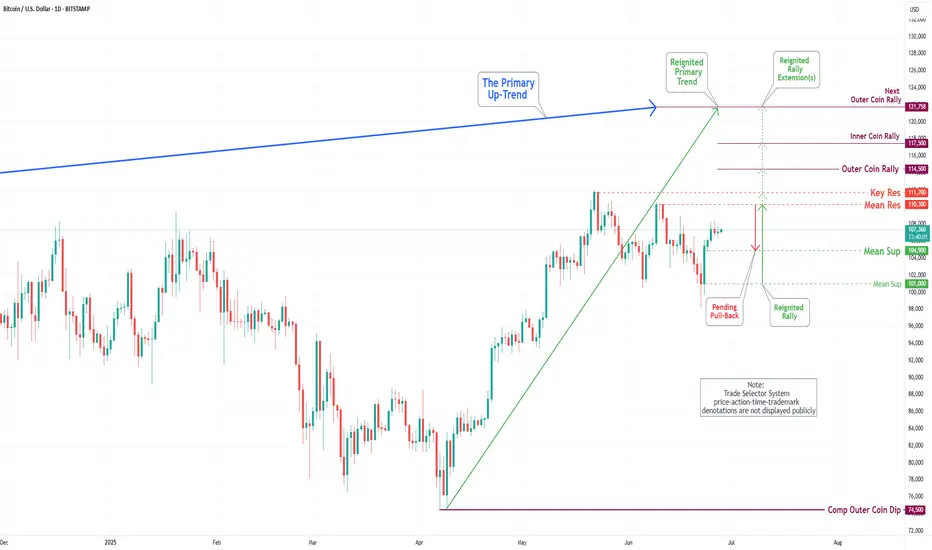
In this week's trading session, the Bitcoin market experienced a notable pullback. The primary reason for this movement was the Key Resistance level, which led to a decline that reached our Mean Support level of 113000. This anticipated pullback is prompting the completion of the Outer Coin Dip target of 111000, with a strong likelihood of moving towards the Mean Support level of 108000.
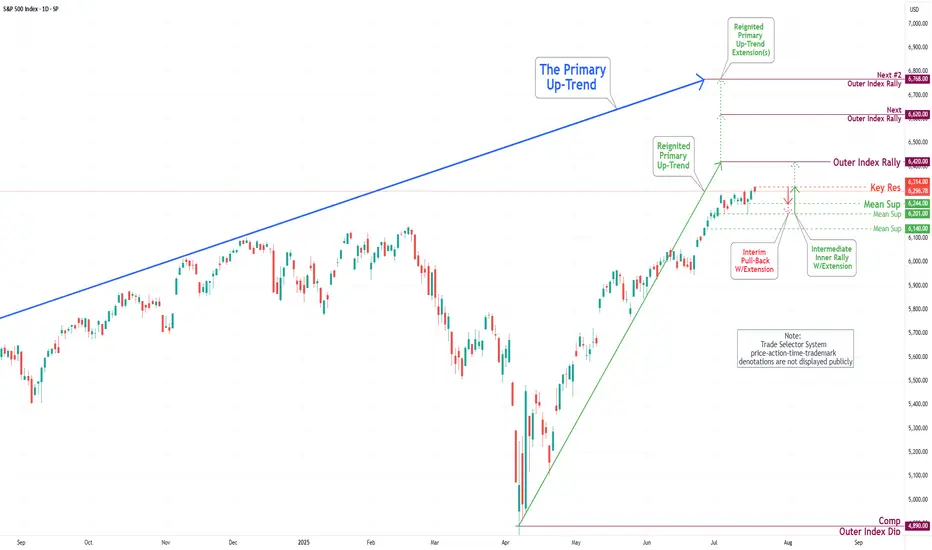
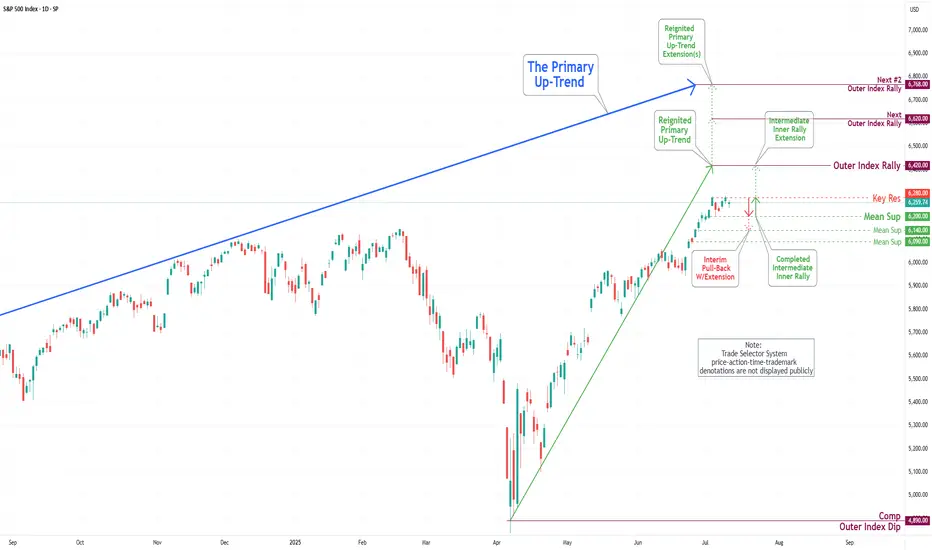
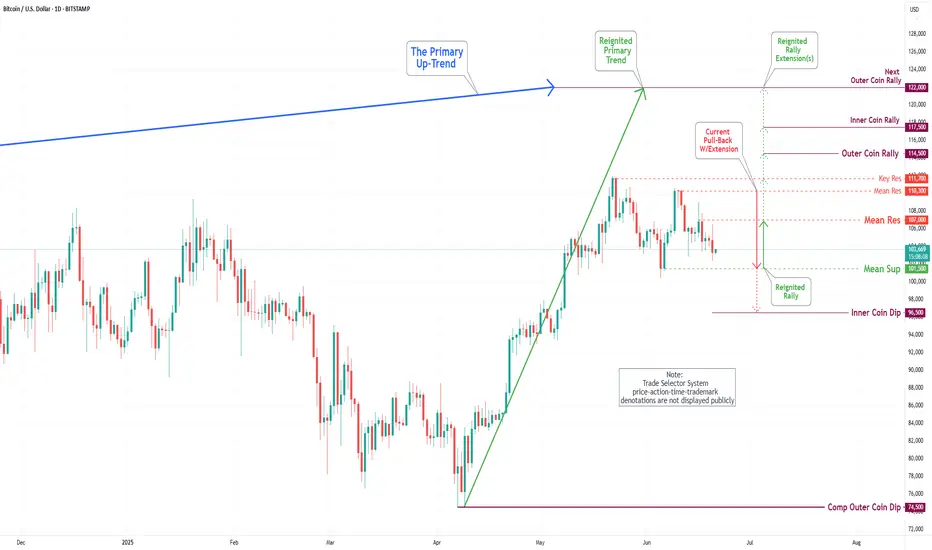
S&P 500 Daily Chart Analysis For Week of August 1, 2025Technical Analysis and Outlook:
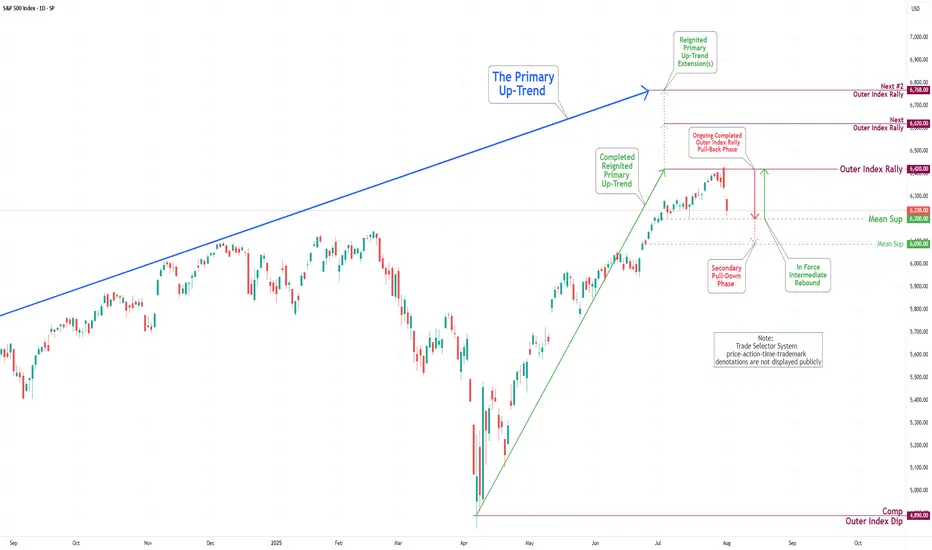
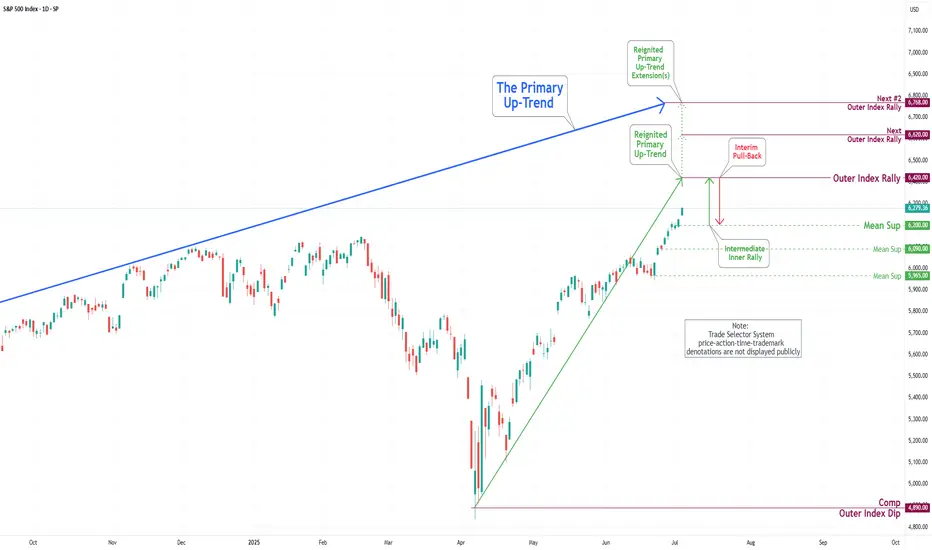
During the trading activity of the previous week, the S&P 500 Index displayed a predominantly bearish movement after completing our Outer Index Rally target of 6420, as highlighted in the prior week’s Daily Chart Analysis, with the primary objective now being to plug our Mean Support at 6200.
It is essential to recognize that the current price movement may trigger a significant further pullback to the Mean Support level of 6090. Following this downturn, it is expected that the index will resume its upward momentum, aiming for a retest of the Outer Index Rally peak at 6420.
S&P 500 Daily Chart Analysis For Week of July 25, 2025Technical Analysis and Outlook:
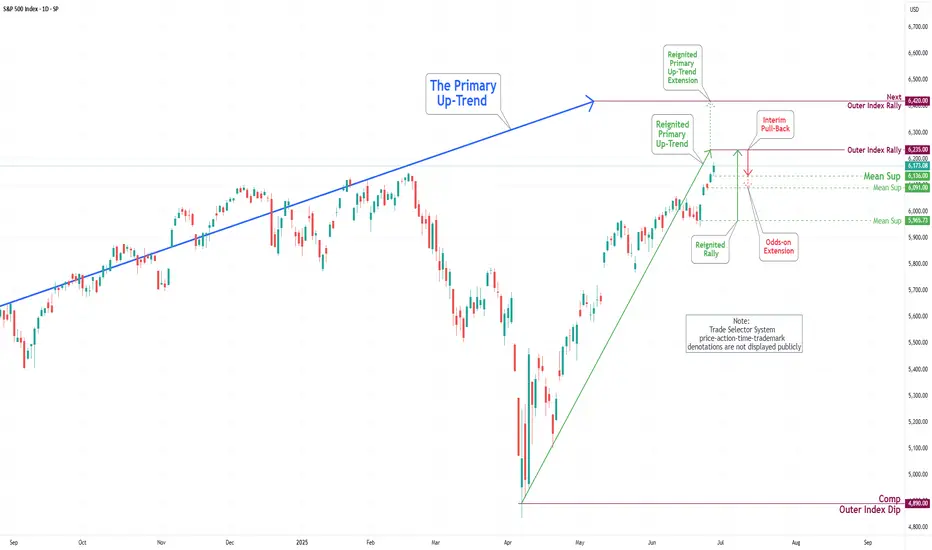
In the trading activity observed last week, the S&P 500 Index exhibited a predominantly upward trajectory. It traded around the Key Resistance level of 6314. It successfully broke through this level, with the primary objective being to complete the Outer Index Rally at 6420, as outlined in the previous week's Daily Chart Analysis.
It is crucial to acknowledge that the current price movement may prompt a substantial pullback following the completion of the Outer Index Rally, with the main target identified as the Mean Support level of 6309. Following this potential downward adjustment, it is anticipated that the index will resume its upward trend, targeting a retest of the forthcoming completion of the Outer Index Rally at 6420.

EUR/USD Daily Chart Analysis For Week of July 25, 2025Technical Analysis and Outlook:
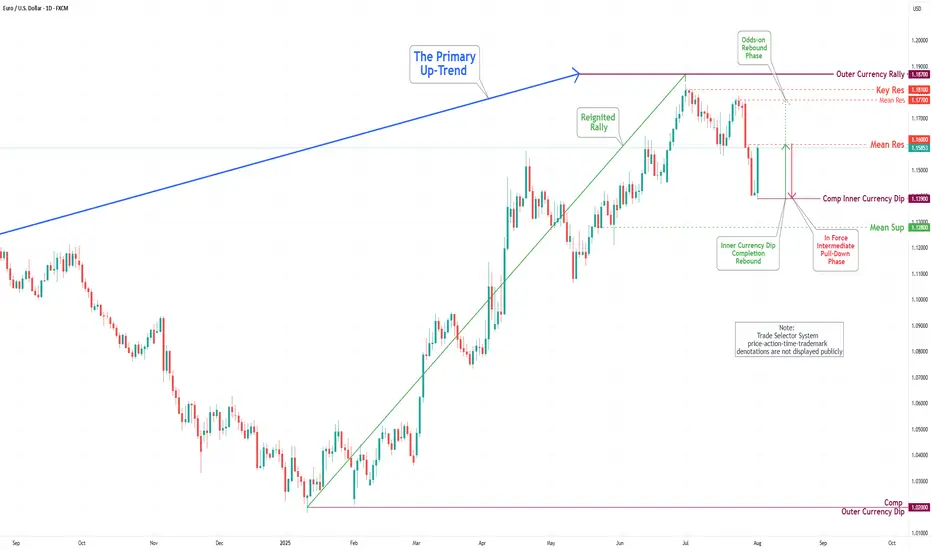
During the previous week's trading session, the Euro experienced an increase following the completion of the Inner Currency Dip at the 1.156 level. It subsequently surpassed two significant Mean Resistance levels, namely 1.167 and 1.172; however, it reversed direction by the conclusion of the trading week. Recent analyses indicate that the Euro is likely to undergo a sustained downward trend, with a projected target set at the Mean Support level of 1.169 and a potential further decline to retest the previously completed Currency Dip at 1.156. Nonetheless, it remains essential to consider the possibility of renewed upward momentum towards the Mean Resistance level of 1.177, which could initiate a preeminent rebound and facilitate the completion of the critical Outer Currency Rally at 1.187.
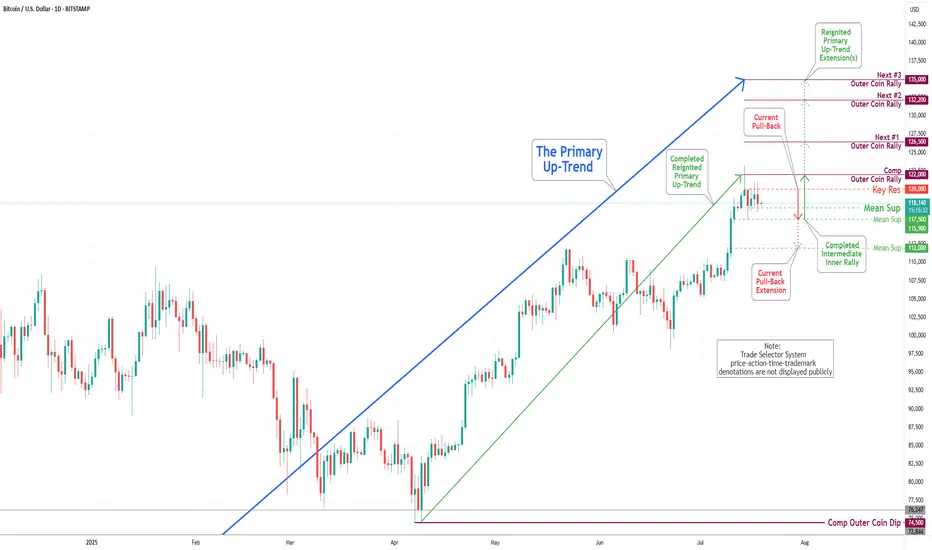
Bitcoin(BTC/USD) Daily Chart Analysis For Week of July 25, 2025Technical Analysis and Outlook:
In the trading session of the previous week, the Bitcoin market exhibited considerable volatility as it retested the Key Resistance level at 120000. On the lower end of the spectrum, the market engaged with the Mean Support levels at 117500 and 115900, culminating in the completion of the Outer Coin Dip at 115000. Currently, the coin is poised to retest the Key Resistance at 120000 once again. This anticipated rebound will necessitate a retest of the completed Outer Coin Rally at 122000. The additional target levels for the renewed Primary Up-Trend are 126500, 132200, and 135000.
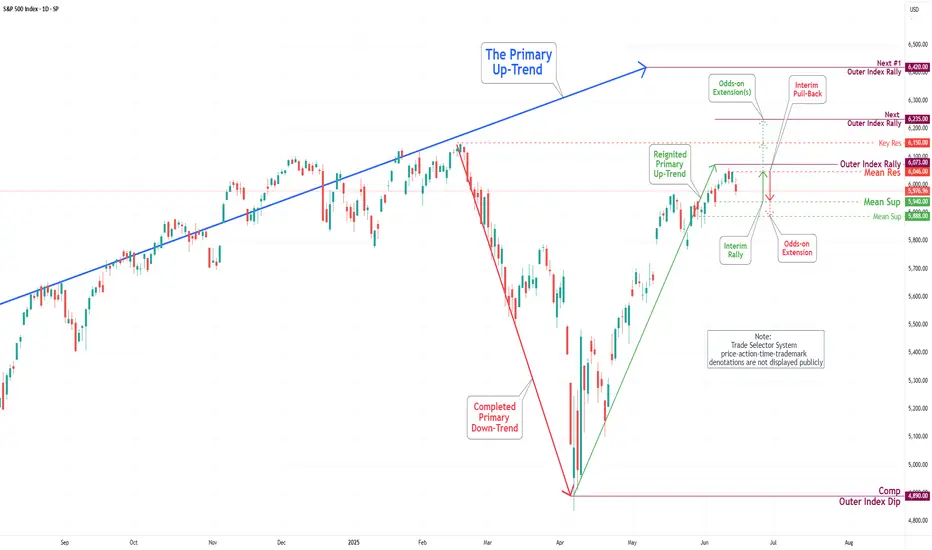
S&P 500 Daily Chart Analysis For Week of July 18, 2025Technical Analysis and Outlook:
During the current trading week, the S&P 500 Index has demonstrated a predominantly upward trajectory. It has successfully retested the Mean Support level at 6200 and established a new Key Resistance level at 6314. Currently, the index displays a bullish sentiment, with the objective for the Outer Index Rally set at 6420.
Nevertheless, it is essential to recognize that the current price action may result in a decline, potentially leading to a retest of the Mean Support at 6244 and extending to the Mean Support at 6201. Following this potential downward movement, it is anticipated that the index will resume its upward trend, driving the price action towards the Key Resistance level at 6314 and ultimately achieving the Outer Index Rally target of 6420.
EUR/USD Daily Chart Analysis For Week of July 18, 2025Technical Analysis and Outlook:
In the current trading session, the Euro has continued its decline, completing our Mean Support level of 1.160. Recent analyses indicate that the Euro is likely to experience a sustained downward trend, with an anticipated retest at the Mean Support level of 1.159 and a possible further decline to reach a Currency Dip of 1.152. Nevertheless, it is crucial to consider the potential for a dead-cat bounce toward the Mean Resistance level of 1.167, which could trigger a significant reversal of the downtrend and target a Currency Dip of 1.152.

Bitcoin(BTC/USD) Daily Chart Analysis For Week of July 18, 2025Technical Analysis and Outlook:
In last week's trading session, we achieved a new historical high by completing our Outer Coin Rally at 122000. Following this milestone, the coin retraced, as expected, to the newly established Mean Support at 115900 and is currently trading at the Intermediate Mean Support at 117500. Presently, the coin is set to retest the Mean Support at 115900, with the potential for a further pullback to the Mean Support at 112000. This anticipated decline will necessitate a retest for the completed Outer Coin Rally at 122000. The designated targets for the renewed Primary Up-Trend are 126500, 132200, and 135000.
S&P 500 Daily Chart Analysis For Week of July 11, 2025Technical Analysis and Outlook:
During this trading week, the S&P 500 Index has shown a predominantly downward/upward course of action and created a new Key Resistance at 6280. Currently, the index exhibits a bullish bias, with the Outer Index Rally objective set at 6420. However, it is crucial to note that the current price action may cause prices to see in a new light from their current fluctuation to push toward the Mean Support at 6200 before resuming their upward movement.
EUR/USD Daily Chart Analysis For Week of July 11, 2025Technical Analysis and Outlook:
In this week's trading session, as expected, the Euro continued its decline, reaching our Mean Support level of 1.168. Recent analyses suggest that the Euro is likely to experience a further downward trend, with the next target set at the Mean Support level of 1.160. However, it's essential to consider the possibility of a rebound toward the Key Resistance level of 1.181, which could lead to the completion of an Outer Currency Rally reaching 1.187.
Bitcoin(BTC/USD) Daily Chart Analysis For Week of July 11, 2025Technical Analysis and Outlook:
In the last week's trading session, Bitcoin has demonstrated a significant surge, achieving historical prices as anticipated by TSS for an extended period. The cryptocurrency has successfully completed both the Outer Coin Rally 114500 and the Inner Coin Rally 118200. Presently, Bitcoin is poised to celebrate this notable accomplishment with a victory lap, but it may face a potential downward trajectory, targeting the Mean Support level of 112000. This anticipated decline will necessitate the resilience to a retest of Inner Coin Rally 118200. The designated targets for the Outer Coin Rally at this juncture are 122000, 126500, 132200, and 135000.
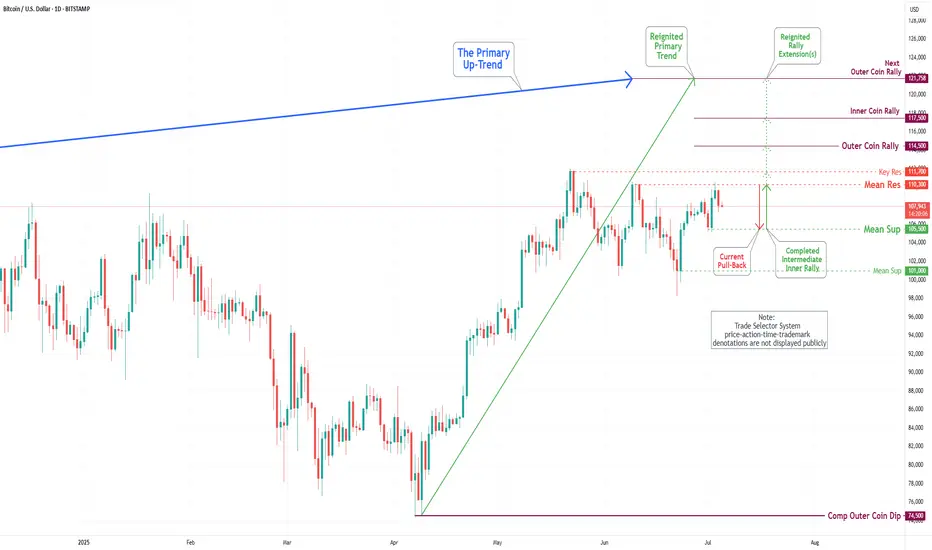
Bitcoin(BTC/USD) Daily Chart Analysis For Week of July 4, 2025Technical Analysis and Outlook:
During this week's trading session, Bitcoin rebounded from our Mean Support level of 104900 and, with significant momentum, subsequently completing the Mean Resistance level of 110300. Currently, the cryptocurrency is poised for a continuation of its downward trajectory, with a target set at the Mean Support level of 105500. This downward trend may necessitate heightened resilience to address the Key Resistance point at 111700 and the emerging historical price action of the Outer Coin Rally at 114500 and beyond. Nonetheless, it remains essential to acknowledge the possibility that current prices may experience an uptick from this juncture, bolstering the rally mentioned above.
EUR/USD Daily Chart Analysis For Week of July 4, 2025Technical Analysis and Outlook:
During the trading session this week, we witnessed the successful completion of the Outer Currency Rally at a level of 1.177. Recent analyses suggest that the Euro is likely to encounter a downward trend, with an initial target set at the Mean Support level of 1.168 and a potential extension to an additional Mean Support of 1.160. Nevertheless, it is crucial to acknowledge the possibility of a subsequent increase toward the next Outer Currency Rally level of 1.187 before any definitive downward movement transpires.

S&P 500 Daily Chart Analysis For Week of July 3, 2025Technical Analysis and Outlook:
During this abbreviated trading week, the S&P 500 Index has primarily shown an upward course, hitting and surpassing our target for the Outer Index Rally of 6235. Currently, the index demonstrates a consistent bullish trend, with the following objective for the Outer Index Rally set at 6420, followed by forthcoming targets of 6620 and 6768. Nevertheless, it is crucial to acknowledge the current price action may cause prices to retrace from their current fluctuation to test the Mean Support at 6200 before resuming their upward movement.
S&P 500 Daily Chart Analysis For Week of June 27, 2025Technical Analysis and Outlook:
During the current trading week, the S&P 500 Index has predominantly demonstrated an upward trajectory, surpassing the Mean Resistance level of 6046, the Outer Index Rally target of 6073, and the critical Key Resistance threshold of 6150. Currently, the index is exhibiting a bullish trend, indicating potential movement towards the Outer Index Rally objective of 6235. However, it is essential to note that there is a substantial probability that prices may retract from their current levels to test the Mean Support at 6136 before experiencing a resurgence.
EUR/USD Daily Chart Analysis For Week of June 27, 2025Technical Analysis and Outlook:
In the course of this week's trading session, the Eurodollar has exhibited a strong rebound, successfully retesting and surpassing the Outer Currency Rally threshold of 1.163. Recent analyses suggest that the Euro is poised for further upward advancement, with the key target to reach the outer currency rally target of 1.177. Nonetheless, it is essential to recognize the possibility of a subsequent decline to the Mean Support level of 1.160 before a definitive upward movement.
Bitcoin(BTC/USD) Daily Chart Analysis For Week of June 27, 2025Technical Analysis and Outlook:
Throughout this week’s trading session, Bitcoin has demonstrated an upward trajectory and is positioned to achieve the specified targets of Mean Resistance 110300 and Key Resistance 111700. This progression may ultimately culminate in the realization of the Outer Coin Rally 114500 and beyond. Nevertheless, it is crucial to recognize the possibility of a subsequent decline from the current price to the Mean Support level of 104900 before a definitive upward rebound.
S&P 500 Daily Chart Analysis For Week of June 20, 2025Technical Analysis and Outlook:
The S&P 500 Index has primarily exhibited downward trends during this week’s abbreviated trading session, narrowly failing to reach the targeted Mean Support level of 5940, as outlined in the previous Daily Chart Analysis. Currently, the index exhibits a bearish trend, suggesting a potential direction toward the Mean Support level of 5940, with an additional critical support level identified at 5888.
Contrariwise, there exists a substantial likelihood that following the accomplishment of hitting the Mean Support of 5940, the index may experience recovery and ascend toward the Mean Resistance level of 6046. This upward movement could facilitate a resilient rally, ultimately topping in the completion of the Outer Index Rally at 6073, thereby enabling the index to address the Key Resistance level situated at 6150.
EUR/USD Daily Chart Analysis For Week of June 20, 2025Technical Analysis and Outlook:
During this week's trading session, the Eurodollar has encountered a significant decline, dipping below the Mean Support level of 1.149; however, it exhibited a modest recovery on Friday. Recent analyses indicate that the Euro is likely to decrease further to the Mean Support level of 1.148, with the potential for extending its bearish trend to reach 1.140. Nevertheless, there remains a possibility that the current recovery will persist, which could result in price movements targeting the Key Resistance level at 1.158 and potentially leading to a retest of the Outer Currency Rally's 1.163 mark.
Bitcoin(BTC/USD) Daily Chart Analysis For Week of June 20, 2025Technical Analysis and Outlook:
In the recent trading session, Bitcoin exhibited an upward trend; however, it subsequently experienced a significant decline from the established Mean Resistance level at 110300. On Friday, Bitcoin exhibited notable price action, characterized by a pump-and-dump scenario. At this juncture, Bitcoin is retracing downwards as it seeks to approach the Mean Support level at 101500 and the ultimate Inner Coin Dip at 96500. It is essential to acknowledge the potential for an upward rally from the Mean Support levels of $101500 and/or the Inner Coin Dip at $96500. Such a rally could culminate in a retest of the Mean Resistance level at $107000.
S&P 500 Daily Chart Analysis For Week of June 13, 2025Technical Analysis and Outlook:
The S&P 500 Index has displayed both upward and downward movements throughout this week's trading session, narrowly missing the targeted Outer Index Rally level of 6073. Currently, the index is characterized by a bearish trend, warranting attention towards the Mean Support level of 5940, with additional critical support identified at 5888.
Conversely, there exists a significant potential that, upon reaching the Mean Support of 5940, the index may recover and rise to the Mean Resistance level of 6046. This upward movement could facilitate an interim rally, culminating in the completion of the Outer Index Rally at 6073 and enabling the index to address the Key Resistance level positioned at 6150.
EUR/USD Daily Chart Analysis For Week of June 13, 2025Technical Analysis and Outlook:
During the current trading session, the Eurodollar has exhibited notable volatility, mirroring patterns observed in the preceding week. The currency has surpassed both the Mean Resistance level of 1.145 and the Key Resistance level of 1.151, subsequently retesting the significant completed Outer Currency Rally level at 1.157.
Recent analyses indicate that the Euro is likely to revisit both the Key Resistance and the completed Outer Currency Rally and expand further to the next Outer Currency Rally of 1.177 in the forthcoming trading session(s). However, there exists a potential for a continuation of the downward trend from the current level, which could lead to the price action targeting the Mean Support level at 1.149 and possibly a further extension to the Mean Support level at 1.140.