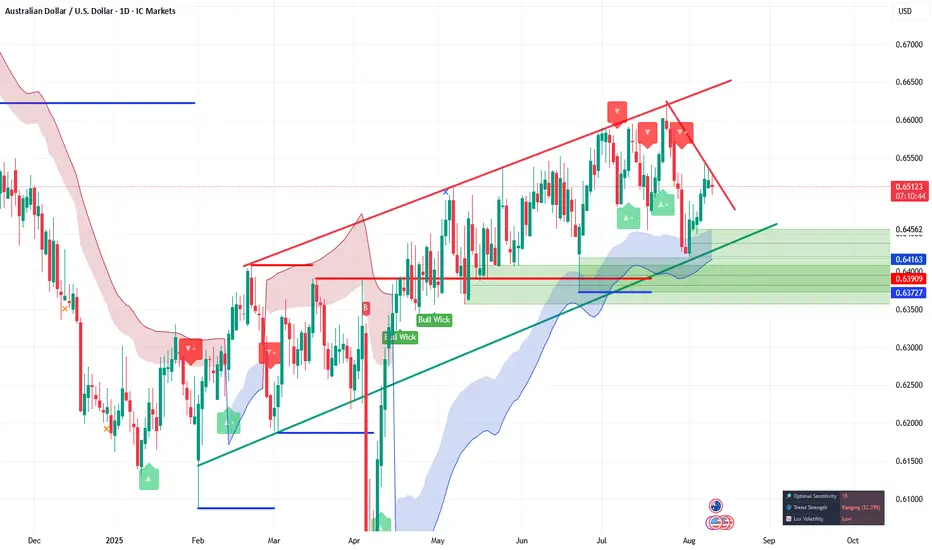
GBPAUD / EURGBP / AUDUSD Trade Recap (Closing +5.5%) 28.08.25Three positions covered in this recap.
GBP / AUD +2%
EUR / GBP +0.0%
AUD / USD +2.5%
Full explanation as to why I executed on these positions and the management plan with all three.
Any questions you have just drop them below 👇
Pricemovement

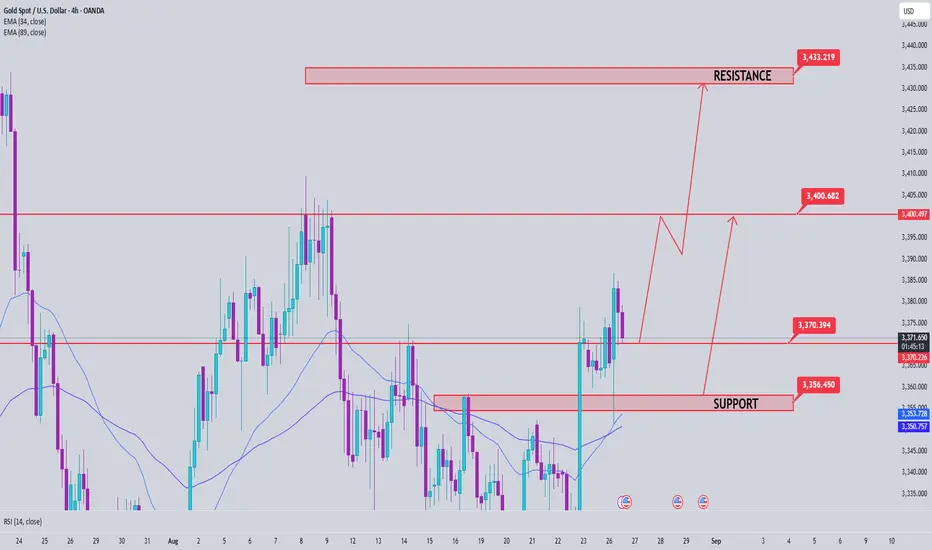
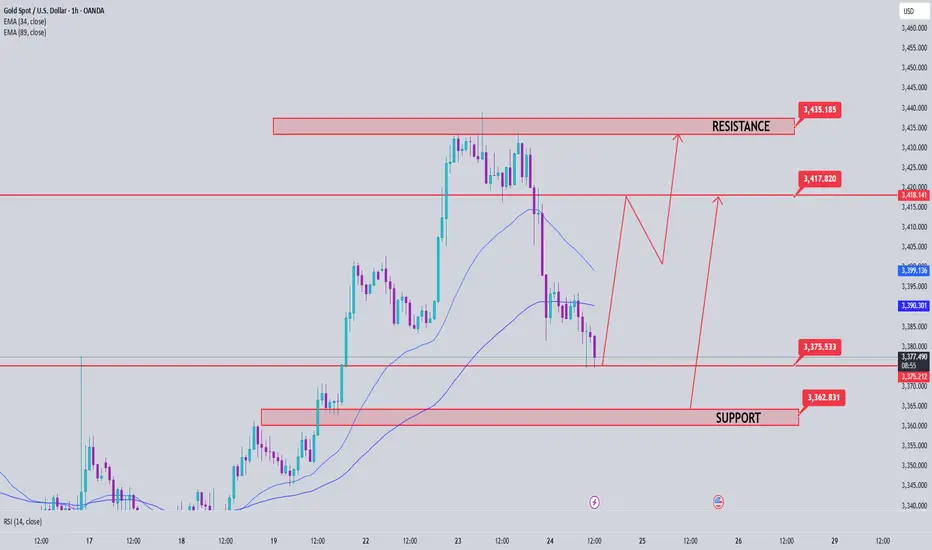
Gold price analysis on August 26The uptrend is still maintained today. The focus is on observing the support zones to find BUY points.
3370 → important support zone (50% of H4 candle strong buying force from Asian session).
3358 → candle wick zone, playing the role of bullish wave structure.
If the price holds above these zones, the expansion target can be towards 3428 today and the following sessions.
📈 Trading strategy
BUY at 3370 (price rejection, 50% of H4 candle).
BUY at 3358 (liquidity candle wick zone).
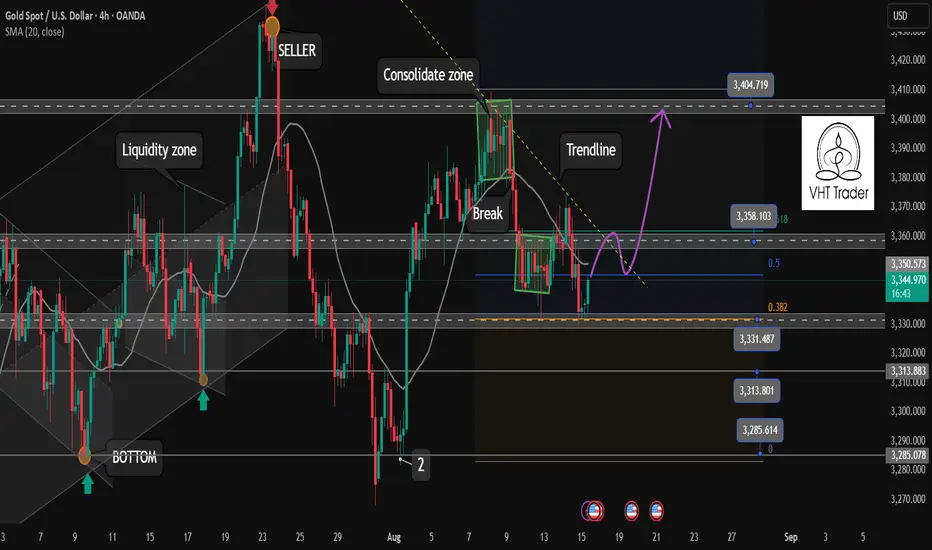
Today's important price zone 3332. Determine the Gold Trend✏️Gold continues to receive some buying pressure at 3332 Fibonacci 0.382 zone. Thus, 3332 zone becomes the Key Level zone in the current trend. Gold is currently trading in a 332-3360 border zone. When Price breaks the trendline as well as Fibonacci 3360, it will confirm clear buying pressure.
📉 Key Levels
SELL Trigger 3332 Confirmation of candle closing below the important support zone 3332.
BUY Trigger 3360 Buying force breaks the Trendline and breaks
Leave your comments on the idea. I am happy to read your views.
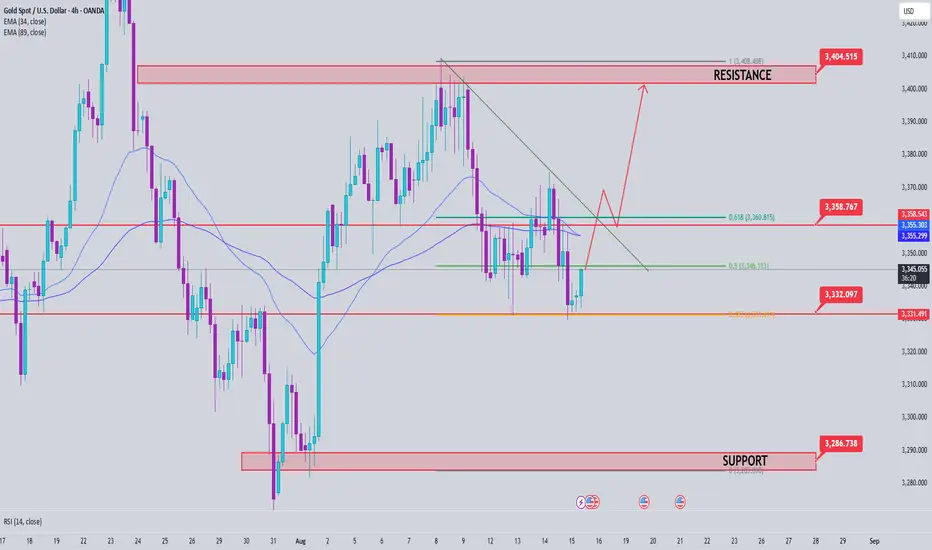
Gold Price Analysis August 15💡 Gold Trend Analysis (XAU/USD)
Gold is currently receiving buying pressure around the 3332 area, which coincides with the Fibonacci 0.382 area, indicating that this is an important support area (Key Level) in the short term. The price is currently fluctuating in the 3332 - 3360 range.
🔸 BUY Trigger: 3360
If the price breaks out of the 3360 area, and at the same time surpasses the resistance Trendline and the Fibonacci area, it will confirm stronger buying pressure and the possibility of the uptrend continuing.
🔸 SELL Trigger: 3332
If the price closes below the strong support area of 3332, it will be a signal confirming the continuation of the downtrend - opening up an opportunity to sell.
📍 Summary:
Gold is sideways in the 3332 - 3360 area.
Wait for a breakout to confirm a clear trend.
Prioritize trading in the direction of breaking the boundary.
AUDUSD Continues the UP Move ??!!After touching strong downs on every larger time frame, AUDUSD Continues to catch the Bullish Momentum. Check your support and resistances and open positions accordingly. Wait for Price Again and strong solid breakouts to enter the market.
Disclaimer:
The content presented in this IMAGE is intended solely for educational and informational purposes. It does not constitute financial, investment, or trading advice.
Trading foreign exchange (Forex) on margin involves a high level of risk and may not be suitable for all investors. The use of leverage can work both for and against you. Before deciding to participate in the Forex market, you should carefully consider your investment objectives, level of experience, and risk tolerance.
There is a possibility that you may incur a loss of some or all of your initial investment, and therefore, you should not invest money that you cannot afford to lose. Be fully aware of all the risks associated with foreign exchange trading, and seek advice from a licensed and independent financial advisor if you have any doubts.
Past performance is not indicative of future results. Always trade responsibly.
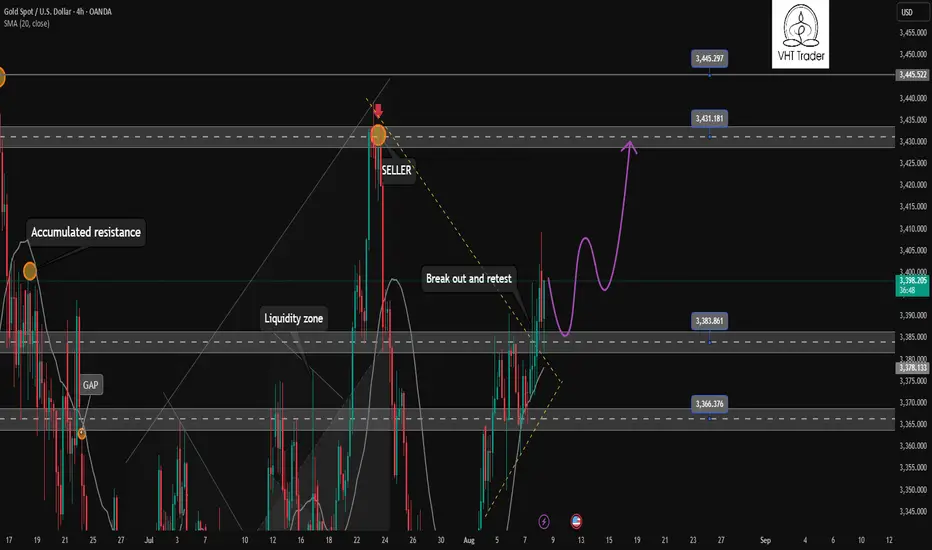
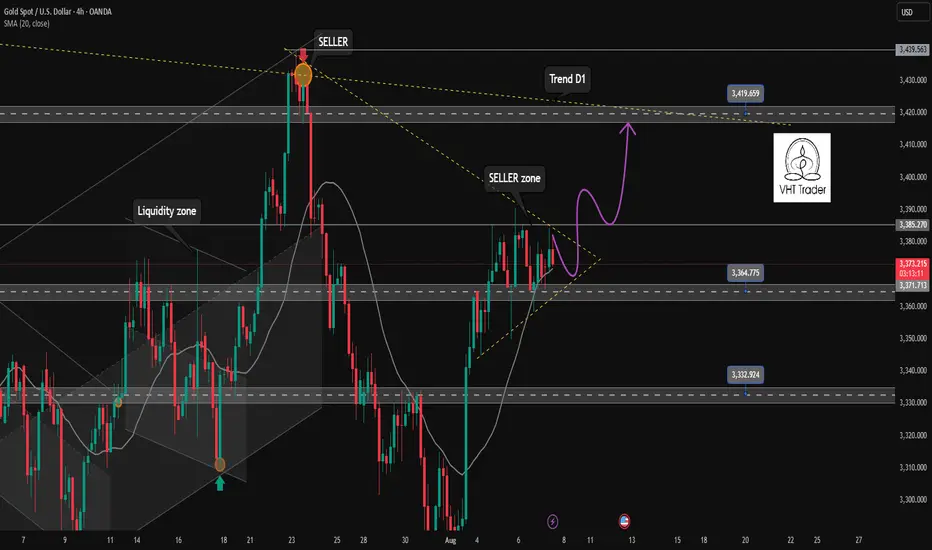
Ready to BUY Gold to target 3445✏️ OANDA:XAUUSD confirms a continued uptrend as it breaks out of the triangle. The price is heading towards 3430 today and even higher at 3445. Today is Friday, the weekly candle close, and according to the range of the candle, it is possible to reach those highs. The BUY strategy can be activated at the moment and hold the position until the US session with the continuous US session buying pressure in recent days.
📉 Key Levels
Support: 3385-3365-3333
Resistance: 3419-3431-3445
Buy trigger: Confirmation of the h4 candle buying pressure above 3385
Buy trigger: Rejection of the support zone at 3365
Target 3445
Leave your comments on the idea. I am happy to read your views.
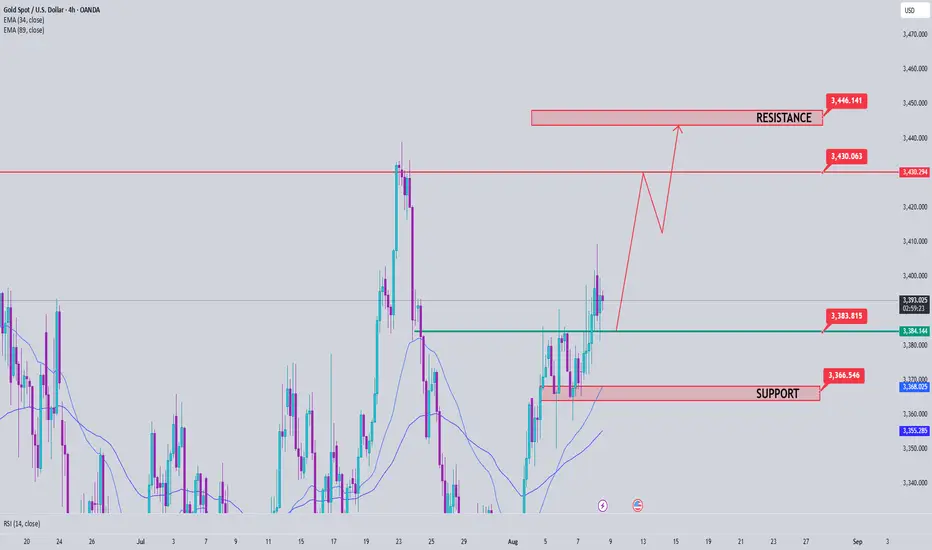
Gold Trading Strategy August 8XAUUSD – Bullish Breakout from Triangle Pattern
Gold has officially broken the upper boundary of the triangle accumulation pattern, confirming the continuation of the uptrend. This bullish momentum is heading directly towards the 3430 area, and if the buying pressure is maintained, the 3445 level is completely within reach.
Today is Friday, the closing day of the weekly candle, so the oscillation amplitude is usually stronger and the price can easily approach new peaks. Observation shows that the buying pressure in the US session has been maintained continuously in recent days - this supports the strategy of BUYing now and holding until the US market opens.
Support zone: 3385 – 3365 – 3333
Resistance zone: 3419 – 3431 – 3445
Ascending triangle pattern is formed✏️Gold is consolidating in a triangle pattern. This is likely an ascending triangle pattern. We can wait for strong enough buying pressure to break the upper boundary to trigger the BUY strategy. Or wait for a reaction at the lower boundary of the triangle pattern to trigger the BUY. 3365 is broken to confirm a corrective downtrend towards 3333.
📉 Key Levels
Buy trigger: Breakout of the upper triangle pattern 3385
Buy trigger: Reaction of the buying candle at 3365
Target 3419
SELL Trigger Break and Retest bellow 3365
Leave your comments on the idea. I am happy to read your views.
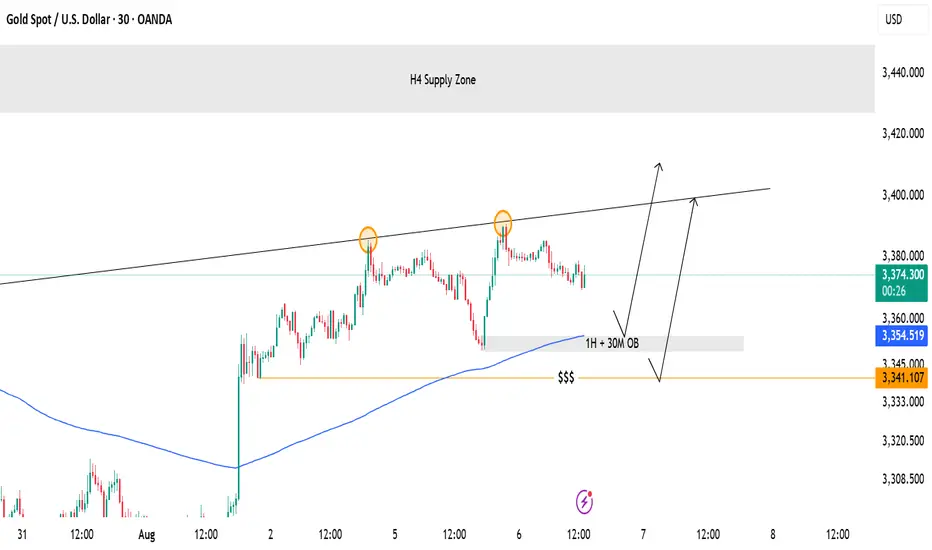
Gold Price Setup – Potential Rejection & Long ScenariosPrice is currently consolidating below the H4 Supply Zone after rejecting the ascending trendline twice.
Two key scenarios are in focus:
✅ Scenario 1 – Deeper Pullback to Demand Zone
A retracement into the 1H + 30M Order Block (OB) and liquidity zone near 3,341–3,355 (marked with $$$) could attract buyers.
If bullish momentum confirms, look for a continuation toward 3,388 and possibly the upper trendline near 3,400+.
✅ Scenario 2 – Immediate Push Higher
If price holds above the moving average and fails to break below 3,355, bulls could step in earlier, driving price back to test the trendline resistance.
Breakout of the trendline could target the higher supply region.
🔍 Key Levels to Watch:
H4 Supply Zone (3,440 area) for potential reversal.
3,341 OB Zone for liquidity sweep and reaction.
Trendline Resistance capping the upside.
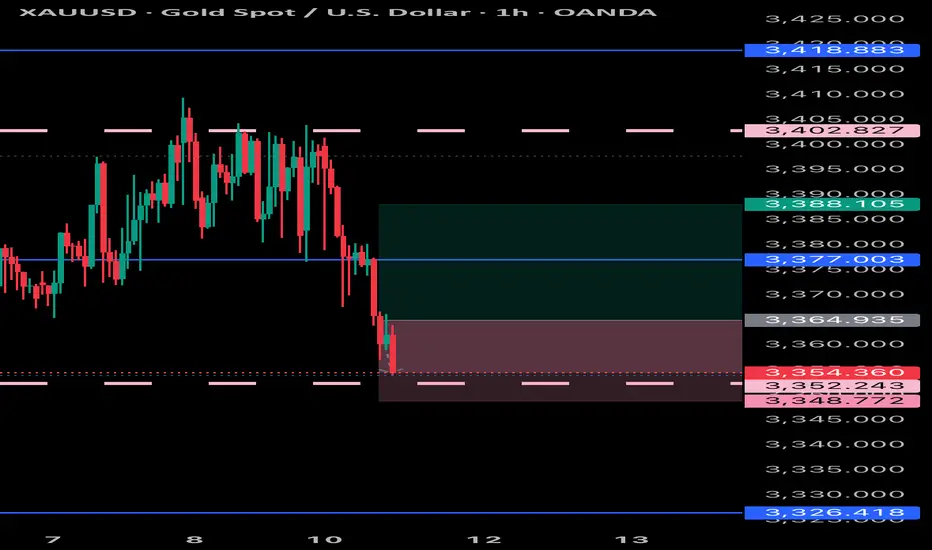
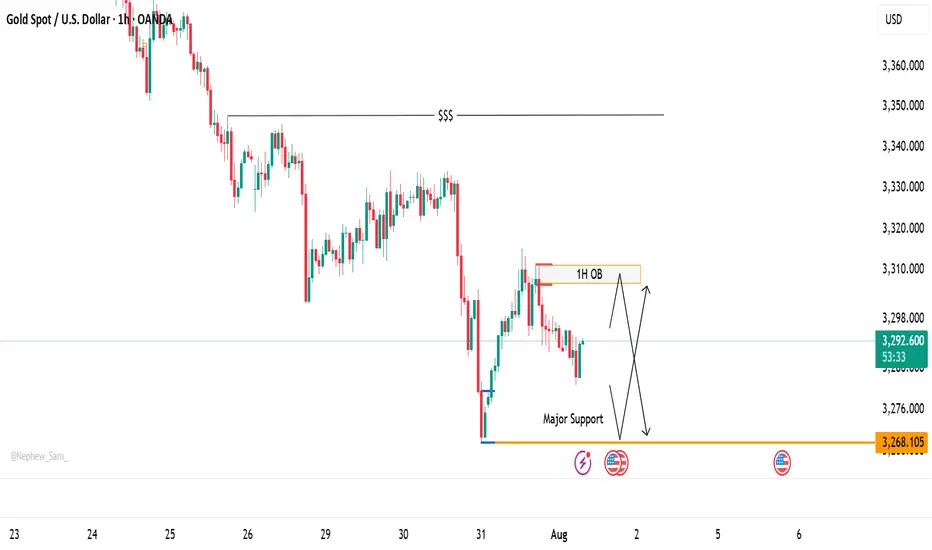
XAUUSD Price at Decision Point – Bounce or Breakdown?Gold (XAUUSD) is currently trading between two significant zones — a ⏫ 1H Order Block above and a 🛑 Major Support level at 3268.
At this stage, price action remains undecided, and we have a few key scenarios to monitor:
🔄 Potential Scenarios:
📌 Price taps into the 1H OB, then shows signs of rejection — this could trigger a move back down toward support.
⬇️ Price drops directly to 3268, where buyers may step in for a potential bounce.
🚀 If the price breaks through the OB, it may continue pushing up toward the liquidity area around 3248.
⚠️ If support fails, we could see a deeper bearish continuation.
These zones are crucial for both intraday and swing setups. Be patient and wait for a clean reaction to catch a high-probability move.
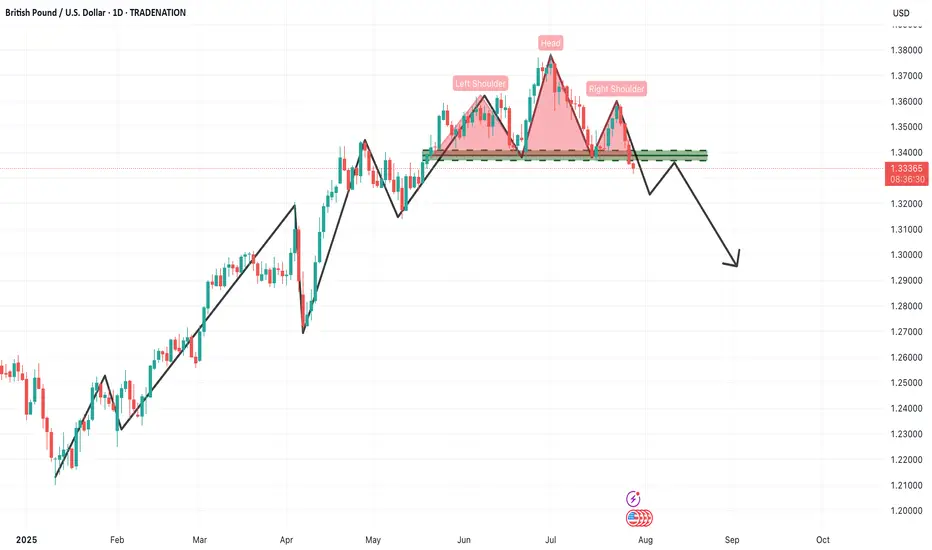
GBPUSD – Daily Timeframe Analysis: Head & Shoulders PatternThe GBPUSD daily chart is currently presenting a textbook Head & Shoulders reversal pattern, a powerful bearish signal that often marks the end of an uptrend and the beginning of a new downward cycle. This setup demands attention from swing and positional traders alike, especially considering the size and clarity of the structure.
🔍 Pattern Breakdown
Left Shoulder: Formed in late May, establishing a significant high before a corrective move.
Head: A higher peak was made in early June, which now stands as the pattern's highest point.
Right Shoulder: A lower high formed in mid-July, indicating weakening bullish momentum.
Neckline: The crucial horizontal support zone around 1.3330–1.3340 was tested multiple times and has now been decisively broken, triggering a confirmed bearish setup.
📊 Technical Significance
This Head & Shoulders pattern becomes especially meaningful due to:
Multiple rejections at the neckline, confirming its strength as support-turned-resistance.
Bearish volume expansion on the breakdown, adding weight to the selling pressure.
Formation on a daily timeframe, suggesting a long-term trend reversal rather than a short-term pullback.
📌 Trading Strategy for Traders
✅ Sell Setup (Short Position)
Entry: Around the neckline zone on retest (1.3320–1.3340)
Stop Loss: Above the right shoulder (~1.3550)
Targets:
🎯 Target 1: 1.3100 (psychological and horizontal support)
🎯 Target 2: 1.2900 (measured move from head to neckline)
🎯 Target 3: 1.2650–1.2600 (extended downside zone based on structure)
⚠️ Risk Management Tips:
Don’t chase the breakdown — wait for a pullback/retest of the neckline to get a better risk/reward entry.
Ensure position sizing is appropriate based on the stop loss distance.
If price reclaims the neckline with strong bullish momentum and closes above 1.3350, exit short and reevaluate.
🧠 What Traders Should Keep in Mind
Macro Fundamentals: Watch upcoming economic events like BoE rate decisions, US NFP, and inflation data, which can cause volatility and impact the technical scenario.
Dollar Index (DXY) trend should also be monitored closely. If DXY rallies, GBPUSD breakdown can accelerate.
Trendline Confirmation: Align this with any break of rising trendlines drawn from previous lows.
📌 Final Thought
This pattern marks a crucial turning point in GBPUSD. The momentum has clearly shifted from buyers to sellers, and the breakdown opens up significant downside room. As a swing or position trader, this is a high-probability setup with a clear invalidation point (above the right shoulder) and a favorable risk-reward ratio.
📉 Patience and precision are key here. Let price come to you at the neckline, confirm rejection, and then take the trade with confidence.
=================================================================
Disclosure: I am part of Trade Nation's Influencer program and receive a monthly fee for using their TradingView charts in my analysis.
=================================================================
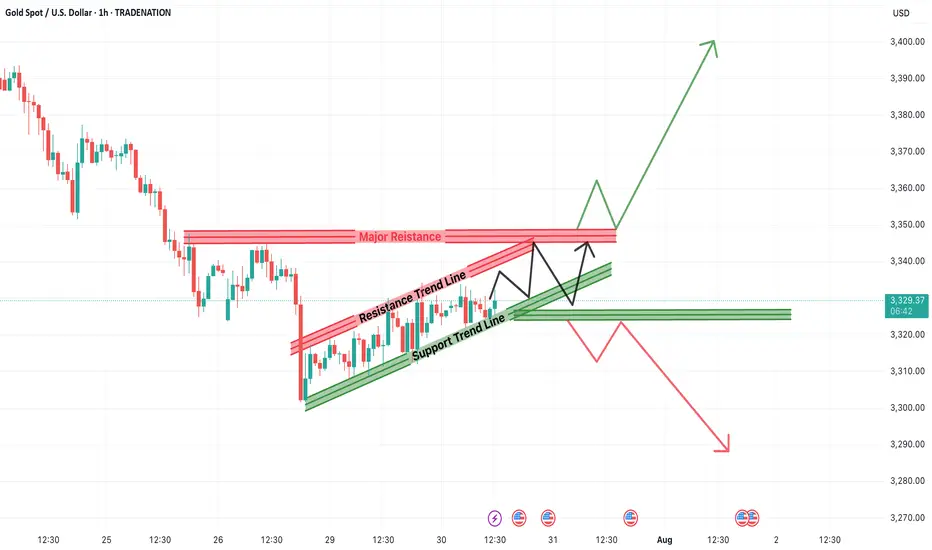
Will Gold Break Higher or Resume the Downtrend?Gold has been trading within a defined rising channel pattern, forming a short-term consolidation phase after a significant bearish leg. The current setup presents a critical inflection zone where Gold (XAUUSD) could either break out above the resistance trendline and major resistance zones or retrace and resume the prior downtrend.
Traders and investors should pay close attention to the price behavior around these key levels for possible high-probability trading opportunities.
📊 Technical Breakdown
1. Rising Channel Pattern
Gold has been bouncing between a support trend line and a resistance trend line, forming a rising channel. This indicates a controlled upward movement or short-term relief within a broader downtrend.
Support Trendline: Has been respected multiple times and offers a key reference point for bullish continuation.
Resistance Trendline: Acting as a cap on the short-term rallies.
This pattern represents a state of consolidation and indecision, often preceding a strong breakout in either direction.
2. Major Resistance Zone Ahead
The region around $3,345–$3,355 is stacked with:
Previous supply zones.
Confluence of the channel resistance and historical price rejection.
Psychological level near $3,350.
This zone is the make-or-break point for bulls. A successful breakout above this resistance could open the doors for a strong bullish continuation targeting levels such as:
$3,370
$3,390
$3,400+
But without a convincing close above this zone, bullish attempts may get rejected, resulting in a pullback or even breakdown.
3. Immediate Support Zone
On the downside, $3,320–$3,325 is a key short-term support level:
Aligned with the lower boundary of the channel.
Previous breakout retest zone.
Demand area observed in past bounces.
If this zone fails to hold, Gold could witness a strong decline, with potential targets at:
$3,310
$3,290
$3,275
🧠 Two Scenarios for Traders
✅ Bullish Breakout Scenario:
Trigger: Price breaks above $3,355 and sustains.
Retest Opportunity: If price comes back to test the breakout zone with a bullish engulfing candle or pin bar, it can serve as confirmation.
Target Zones: $3,370 / $3,390 / $3,400+
Stop Loss: Below the breakout point or recent higher low inside the channel (~$3,320)
❌ Bearish Breakdown Scenario:
Trigger: Breakdown of the support trendline and close below $3,320.
Confirmation: A bearish retest or continuation candle adds strength to the setup.
Target Zones: $3,310 / $3,290 / $3,275
Stop Loss: Above $3,335 (recent high)
📝 Final Thoughts
The XAUUSD 1H chart is setting up for a volatile move as price action coils between strong support and resistance. The rising channel within the larger downtrend makes this an ideal setup for both breakout traders and trend followers.
For bullish traders, the best entry lies above the resistance trendline, ideally after a retest. For bearish traders, a breakdown below the support line confirms downside momentum continuation.
In either direction, a clear break from this consolidation channel is likely to deliver a fast, directional move. Patience is key—wait for a clean breakout or breakdown before entering large positions.
=================================================================
Disclosure: I am part of Trade Nation's Influencer program and receive a monthly fee for using their TradingView charts in my analysis.
=================================================================
Are you ready for the BUY BTCUSD signal?✏️ The pennant pattern is forming. After BTCUSD reached a new peak, the past 1 week, BTC price has been accumulating to form a bullish pennant pattern. This is a bullish continuation pattern that signals when breaking the upper boundary of the flag pattern.
📉 Key Levels
BUY Trigger: Break and trade above 199000
Target 128000
Leave your comments on the idea. I am happy to read your views.

[INTRADAY] #BANKNIFTY PE & CE Levels(29/07/2025)Bank Nifty is expected to open with a gap-down, continuing its downside pressure from the previous sessions. The index is now hovering near an important support zone around 56,050–55,950.
If Bank Nifty sustains above the 56,050–56,100 zone after the gap-down open, a reversal rally can be seen with potential upside targets of 56,250, 56,350, and 56,450+. This zone may offer a low-risk long opportunity, provided price action confirms strength.
However, if Bank Nifty remains below 56,050 and especially breaches 55,950, fresh short positions can be initiated with downside targets of 55,750, 55,650, and 55,550-. A close below this support zone can accelerate the selling momentum further.
The market remains in a bearish tone unless a clear reversal structure forms above 56,050.

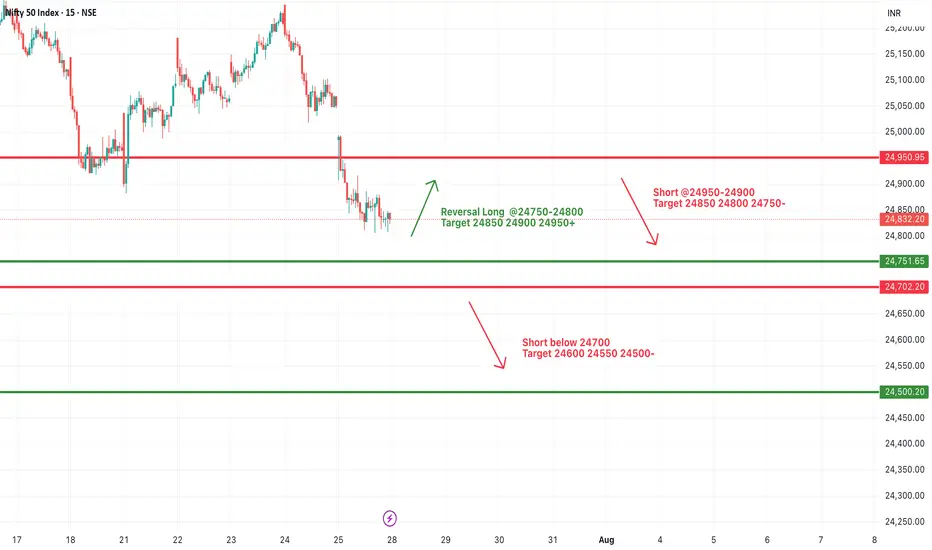
#NIFTY Intraday Support and Resistance Levels - 28/07/2025Nifty is expected to open slightly lower and remains under selling pressure from higher levels. The key intraday zone to watch is 24,750–24,900, which may act as a trigger range for today's direction.
If Nifty sustains above the 24,750–24,800 zone, a short-covering rally may push the index toward 24,850, 24,900, and 24,950+. This zone may offer a reversal opportunity if supported by strong price action.
On the downside, if the index fails to hold above 24,900–24,950, further weakness may be seen below 24,700, opening downside targets at 24,600, 24,550, and 24,500-.
The broader price action suggests a narrow consolidation between 24,700–24,900, with either side breakout likely to lead to intraday momentum. Maintain strict risk management and avoid aggressive trades within this zone.
[INTRADAY] #BANKNIFTY PE & CE Levels(28/07/2025)Bank Nifty is expected to open slightly lower and is currently trading near a critical zone of 56,450–56,550, which may act as a key pivot for today's session. This narrow band will decide the next directional move.
If Bank Nifty sustains above 56,550, we can expect an upward move toward 56,750, 56,850, and 56,950+ levels. This zone could act as a breakout trigger for intraday momentum on the upside.
On the downside, if the index slips and trades below 56,450–56,400, it may indicate bearish pressure, with possible downside targets at 56,250, 56,150, and 56,050-.
Alternatively, a rejection near the 56,900–56,950 zone could also act as a reversal point and push the index back down.
For now, wait for a clear breakout or breakdown from the 56,450–56,550 range before taking directional trades.

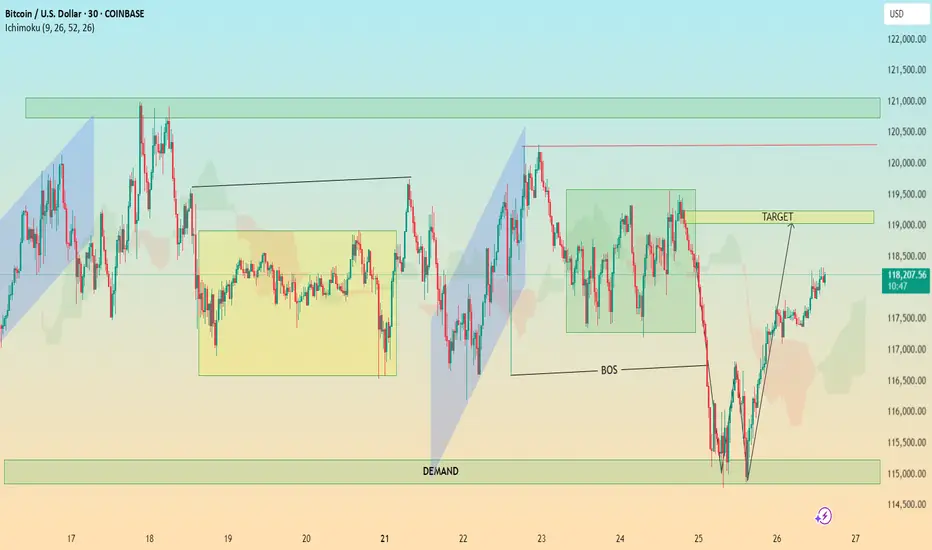
BTC In-Depth Technical Analysis: BTC/USD (30-Min Chart)🔍 In-Depth Technical Analysis: BTC/USD (30-Min Chart)
🟩 1. Demand Zone Reaction
Location: ~$114,500 – $115,500
Significance:
Price sharply reversed after a strong move into this demand zone.
This zone coincides with a liquidity grab below previous lows — textbook Smart Money trap.
Volume (if checked) would likely spike here, indicating institutional interest.
✅ Interpretation: Institutional demand stepped in, absorbing sell orders and triggering a reversal.
📉 2. Break of Structure (BOS)
Zone: Around July 24–25
Price broke below a key higher low, signaling temporary bearish structure.
However, this was quickly reclaimed after demand zone reaction — suggesting a fakeout BOS or a liquidity sweep.
✅ Interpretation: BOS caused shorts to enter, but reversal suggests a bear trap and continuation higher. The BOS served to fuel a more aggressive bullish rally.
🎯 3. Target Zone
Marked Target: ~$118,900–$119,200
Why This Area?
It aligns with a previous consolidation zone / supply before the sharp drop.
Also overlaps with Ichimoku cloud resistance and previous highs — strong confluence.
✅ Interpretation: Price is likely to face resistance here. If broken with strong momentum, bullish continuation to the next supply zone (~$121K) is possible.
⛓️ 4. Market Structure Analysis
Higher Lows Forming after demand reaction.
Price is forming a bullish market structure with an ascending wave pattern.
A break and retest of the $119K zone could lead to a mid-term rally.
Failure to break could result in:
A pullback to the $117,000 area
Or a deeper retest of the demand zone
✅ Trading Plan Options:
Bullish Bias: Buy pullbacks above $117,000 with $119,000 as target
Bearish Bias: Wait for strong rejection at $119,000 to short back to $115K
☁️ 5. Ichimoku Cloud Insight
Price has moved above the cloud, suggesting momentum shift to the upside.
The cloud is twisting bullish, supporting short-term bullish trend.
However, flat Kumo tops around $119K = likely rejection zone.
✅ Interpretation: Ichimoku confirms bullish potential, but price must close above the cloud + $119K zone to sustain trend.
📌 Key Takeaways for Publishing
Chart Idea Title:
“BTC/USD Demand Zone Reversal | Break of Structure & $119K Target in Sight”
Summary Description:
Bitcoin has reclaimed bullish momentum after a sweep into the $115K demand zone. A break of structure triggered shorts, but demand absorption led to a sharp reversal. Now, price is approaching the key $119K supply zone — a critical level that could determine if this is a short-term rally or the beginning of a new trend. Watch for either a clean breakout or a rejection for a possible retest of $117K or lower. Confluence from Ichimoku, BOS, and market structure support the analysis.
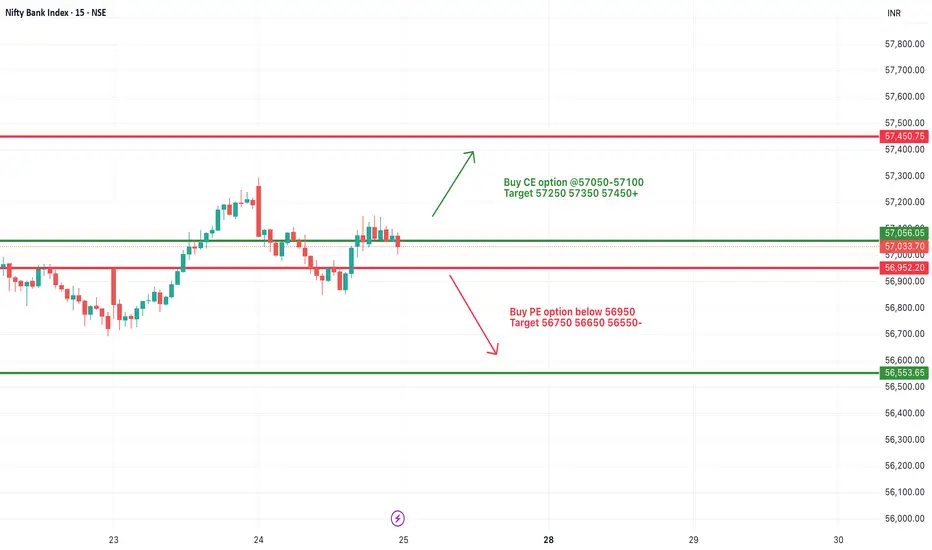
[INTRADAY] #BANKNIFTY PE & CE Levels(25/07/2025)Bank Nifty is likely to start the session with a slight gap-down, hovering just below the 57,050–57,100 resistance zone. This zone has been acting as a critical barrier over the past sessions, and until it's breached, upside momentum may remain capped.
A strong bullish move can be anticipated above 57,050, where call option buying is favored. If Bank Nifty sustains this breakout, we can expect a continuation rally toward 57,250, 57,350, and 57,450+ levels. This would mark a short-term trend reversal and signal fresh bullish interest.
On the downside, weakness may resume if the index breaks below the 56,950 mark. A sustained move below this could trigger a quick correction targeting 56,750, 56,650, and 56,550- levels, offering good opportunities for put option buyers.
Gold Price Analysis July 24After a correction of about 50 prices in yesterday's session, gold is showing a necessary "breathing" in the long-term uptrend. This is a positive signal, showing that the market is accumulating before continuing its journey towards a new ATH around the 3500 area.
Currently, gold prices are fluctuating within the boundary zone limited by two upper/lower trendlines - creating a clear structure of support and resistance. Avoid trading against the trend if this boundary zone is broken.
📌 Trading plan:
Strategy: Prioritize BUY when price sweeps to support zone
Active buy zone: 3375 (reaction price)
Potential buy zone: 3363 (deep support)
Target: 3431 in the immediate future → further towards 3490
Support: 3375 – 3363
Resistance: 3418 – 3431 – 3490
#NIFTY Intraday Support and Resistance Levels - 23/07/2025Nifty is expected to open with a gap-up today, continuing its sideways movement within a tight range. There are no significant changes in key levels from the previous session, indicating a consolidative phase in the market. Price action near these levels will be crucial for intraday direction.
On the upside, a bullish continuation can be expected if Nifty sustains above 25,050–25,100. This zone has been acting as a breakout point, and a sustained move above can lead to an intraday rally toward 25,150, 25,200, and 25,250+. Further strength will be confirmed if Nifty crosses 25,250, opening the possibility to test 25,350, 25,400, and even 25,450+ levels.
On the downside, if Nifty breaks below 24,950, it may trigger a short setup with potential downside targets of 24,850, 24,800, and 24,750-. This breakdown would indicate weakness, especially if it comes with volume.

[INTRADAY] #BANKNIFTY PE & CE Levels(23/07/2025)Bank Nifty is likely to open with a gap-up today, continuing its recent volatility and range-bound behavior. There are no major changes from yesterday’s levels, and the index remains in a crucial zone near short-term resistance and support bands. A breakout or breakdown from this zone could decide the next directional move.
Upside continuation may resume if Bank Nifty breaks above 57,050, which can trigger a momentum rally toward 57,250, 57,350, and possibly 57,450+. Traders can consider long positions in this case once confirmation and volume support the breakout.
On the downside, if the index trades and sustains below 56,950, further weakness may be seen. A bearish move below 56,950 can lead to a drop toward 56,750, 56,650, and 56,550-. This level becomes important support, and a breach could invite selling pressure.
Additionally, if Bank Nifty takes support near the 56,550–56,600 zone again, reversal buying can be considered. A bounce from this area could offer targets of 56,750, 56,850, and 56,950+.

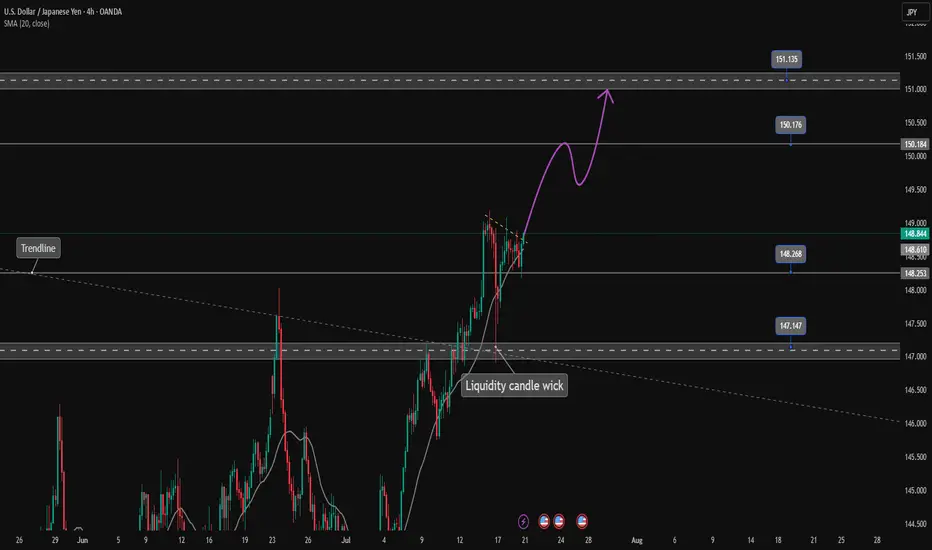
USDJPY is continuing its uptrend, let's BUY✏️ OANDA:USDJPY broke the price channel and continued its uptrend at 151,000. The previous h4 candle wick had a liquidity sweep to 147,000, showing that the buyers are dominating the market. The USDJPY trading strategy will mainly BUY to the old peak around 151,000. When the price breaks 147,000, a corrective downtrend will begin to form.
📉 Key Levels
Support: 148.200 - 147.200
Resistance: 150.100 - 151.100
Buy trigger: Breakout above 148,800
BUY 147,200 (buyer liquidity zone)
Target: 145,000
Leave your comments on the idea. I am happy to read your views.