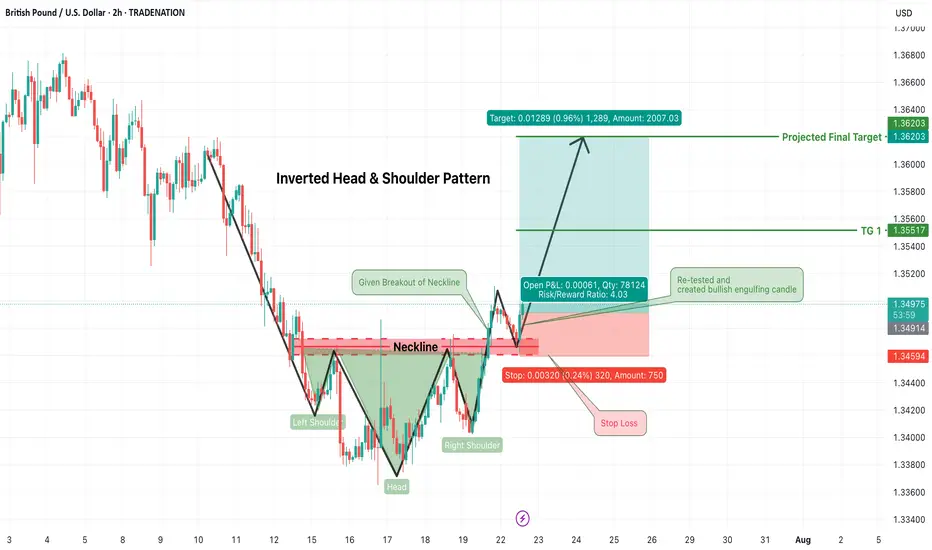
GBPUSD Long Trade Alert – Inverted Head & Shoulders BreakoutGBPUSD has confirmed a classic Inverted Head & Shoulders pattern, signaling a strong bullish reversal opportunity on the 2-hour chart. Price has successfully broken above the neckline resistance zone (~1.3490) and has now retested that zone, forming a bullish engulfing candle — an ideal confirmation for long entries.
🟢 Trade Plan:
Entry: After bullish engulfing candle formed on neckline retest (~1.3490–1.3500)
Stop Loss: Just below the right shoulder low / retest swing low (~1.3455)
Risk/Reward Ratio: ~4:1 (High reward with tightly controlled risk)
🎯 Target Levels:
Target 1: 1.3555
Final Target (Projected): 1.3620
These levels align with structure resistance and measured move of the pattern
📌 Why This Trade Matters:
Pattern confirmed ✅
Retest successful ✅
Bullish confirmation candle ✅
Clean invalidation and upside potential ✅
This is a textbook reversal play, offering solid structure, clear stop placement, and attractive upside. Perfect for swing traders or short-term position setups.
📉 Trade what you see, not what you think. Let price action lead your execution.
=================================================================
Disclosure: I am part of Trade Nation's Influencer program and receive a monthly fee for using their TradingView charts in my analysis.
=================================================================
Pricemovement
USDJPY Symmetrical Triangle – Be Ready for Breakout or BreakdownUSDJPY is currently squeezed inside a well-formed symmetrical triangle, indicating a breakout is imminent. This consolidation pattern is nearing its apex, and price action is getting tighter. A sharp move in either direction could unfold soon. Here's how to prepare:
🟢 Bullish Breakout Setup:
Entry Trigger: 1H candle close above 148.70
Stop Loss: Below last higher low or triangle support (~148.15)
Targets:
TG1: 149.20
TG2: 149.60
Final TG: 149.95–150.00
Bias: Favors trend continuation (previous uptrend)
🔍 Confirmation: Strong breakout candle with momentum and/or volume.
🔴 Bearish Breakdown Setup:
Entry Trigger: 1H candle close below 148.15
Stop Loss: Above triangle resistance (~148.70)
Targets:
TG1: 147.60
TG2: 147.20
Final TG: 146.80
Bias: Reversal or failed trend continuation
🔍 Confirmation: Clean breakdown with bearish candle close + possible re-test rejection.
⚠️ Avoid premature entries inside the triangle. Wait for a confirmed breakout or breakdown with candle close and rejection follow-up.
🎯 Tip: Triangle breakouts often result in fast directional moves. Plan your lot size based on volatility and stick to your risk parameters. This is a high-probability setup — trade with discipline.
=================================================================
Disclosure: I am part of Trade Nation's Influencer program and receive a monthly fee for using their TradingView charts in my analysis.
=================================================================

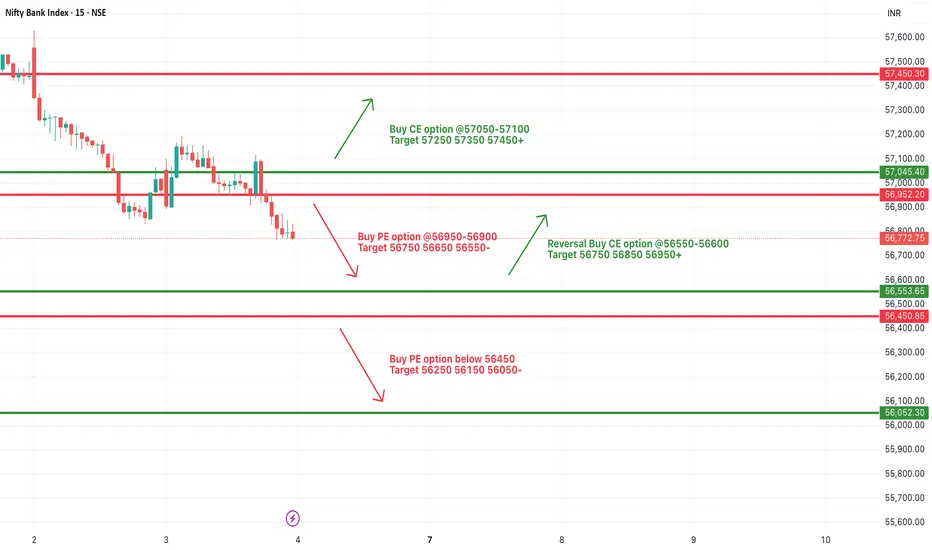
[INTRADAY] #BANKNIFTY PE & CE Levels(18/07/2025)Bank Nifty is expected to open flat around the 56800 zone, suggesting indecision in the early session. If it manages to move upward and sustain above the 57050–57100 resistance range, it could invite bullish momentum targeting 57250, 57350, and even 57450+. A breakout above this level can trigger a continuation of upward movement, but volume and price confirmation are essential.
On the downside, if the index stays weak and slips below the 56950–56900 zone, we may see fresh bearish pressure pulling it toward 56750, 56650, and 56550 support levels. This zone remains a crucial intraday pivot for traders to watch.
A reversal opportunity may also emerge if the index drops further near 56550–56600 and then shows a sharp recovery. In such a case, targets of 56750, 56850, and 56950+ are possible, making it a good support-based bounce trade. Overall, the market might remain sideways with both opportunities for quick scalps and reversals—focus on key levels and act with strict stop losses.

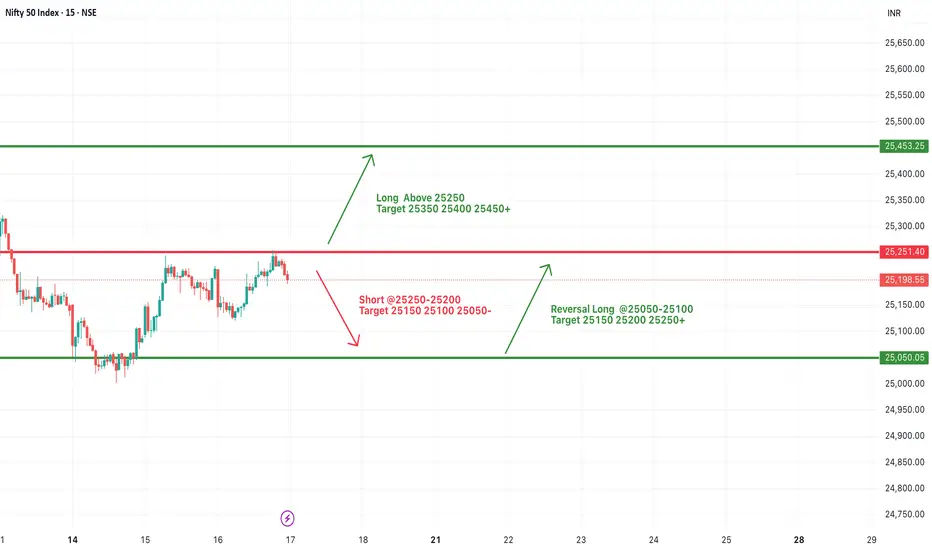
#NIFTY Intraday Support and Resistance Levels - 17/07/2025Opening Expectation: Slight Gap-Up Around 25200
Nifty is likely to open slightly gap-up near the 25200 level, showing early signs of strength. If the index manages to sustain above the 25250 level, we may see a continuation of the upward momentum with targets around 25350, 25400, and 25450+. This zone marks the upper resistance, and a breakout with strong volume could push prices into a bullish trend for the session.
On the other hand, if Nifty faces rejection around 25250–25200 and begins to slide, a short opportunity opens up with downside targets at 25150, 25100, and 25050. Sustained weakness below these levels could intensify selling pressure. However, in case the index reverses and bounces from the 25050–25100 zone, a quick intraday long trade can be considered toward 25150, 25200, and 25250+.
Today’s bias remains slightly positive, but the session may remain volatile between key levels. Traders should focus on price action around the 25250 resistance and use trailing stop losses with strict risk control.
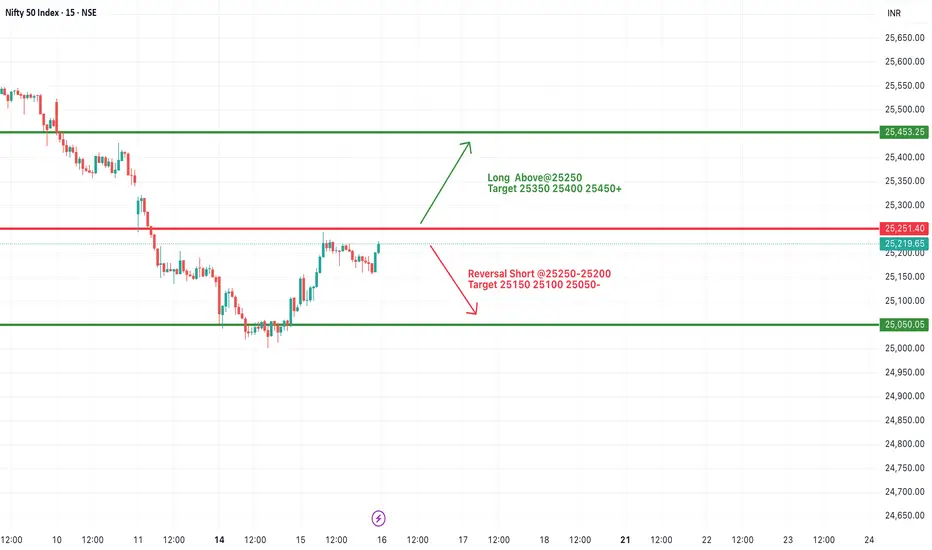
#NIFTY Intraday Support and Resistance Levels - 16/07/2025Nifty is likely to open flat near the 25200 mark, with the index currently hovering just below a key resistance zone of 25250. A decisive breakout above 25250 may provide momentum for a further upside rally toward 25350, 25400, and possibly 25450+. This level has acted as resistance in the past, so sustaining above it will be crucial for any bullish continuation.
On the flip side, 25250–25200 is also a potential reversal zone. If Nifty fails to break and sustain above it, then sellers may take control, and the index could see a pullback toward the immediate support levels of 25150, 25100, and 25050.
Since the index is near a crucial breakout/rejection point, early session price action will determine the direction.
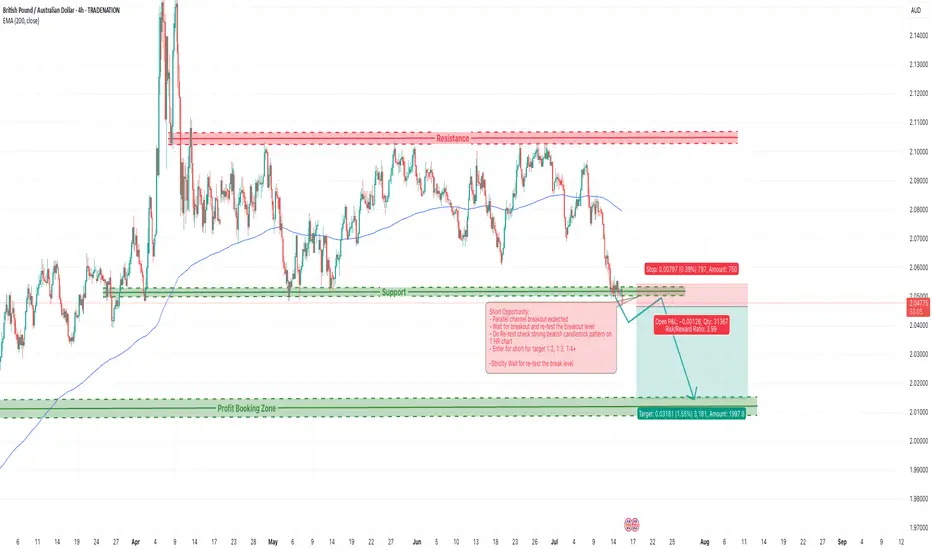
GBPAUD Weekly Trade Setup–Parallel Channel Breakdown Opportunity1. Overview of GBPAUD Technical Setup
As of 15th July 2025, the GBPAUD 4-hour chart reflects a price currently positioned at a critical support level around 2.0470–2.0480, which has held multiple times since early April. The price action leading to this point has formed a classic descending parallel channel, with price making lower highs and testing horizontal support with increased frequency.
Key observations:
Price is well below the 200 EMA (currently around 2.0794), confirming a bearish long-term bias.
The resistance zone at 2.1070–2.1120 has proven strong over time, pushing back multiple rallies.
Price is compressing — getting squeezed into the lower boundary of the channel with shorter pullbacks, often a precursor to breakout.
The setup is aligning for a high-probability short trade, with a potential move toward the next major demand zone around 2.0100.
The Breakdown Thesis – What We See on the Chart
The current structure of GBPAUD tells a very clear story:
After a rally in early April, price has been trading within a consolidation range, failing to make higher highs.
The support around 2.0470 has now been tested repeatedly with lower bounces each time.
Price recently made a lower high and returned to support with momentum, increasing the probability of a breakdown.
We are expecting a bearish breakout of this support level, followed by a re-test of the broken zone, and then a strong downside continuation.
Risk Management Strategy
Every trade setup — no matter how technically perfect — must begin with a strong risk management plan.
For this GBPAUD setup:
Entry Trigger: Breakdown below 2.0470 and successful re-test rejection with bearish candle confirmation
Stop Loss: Above re-test high; ideally, just above 2.0530 (~66 pips risk)
Target 1: 2.0300 (170+ pips)
Target 2: 2.0200
Target 3 / Final: 2.0100 (potential 370+ pip move)
This gives us an excellent Risk:Reward ratio of ~1:5 or more, allowing traders to be wrong several times and still remain profitable over time.
Opportunities in the market don’t come from guessing — they come from waiting. The GBPAUD parallel channel setup is a brilliant example of structure-based trading that combines logic with discipline. Whether you're a full-time FX trader or a part-time swing participant, setups like these are where consistency is built.
Watch the breakdown. Wait for the re-test. Execute only when the market confirms your plan.
Happy Trading!
=================================================================
Disclosure: I am part of Trade Nation's Influencer program and receive a monthly fee for using their TradingView charts in my analysis.
=================================================================
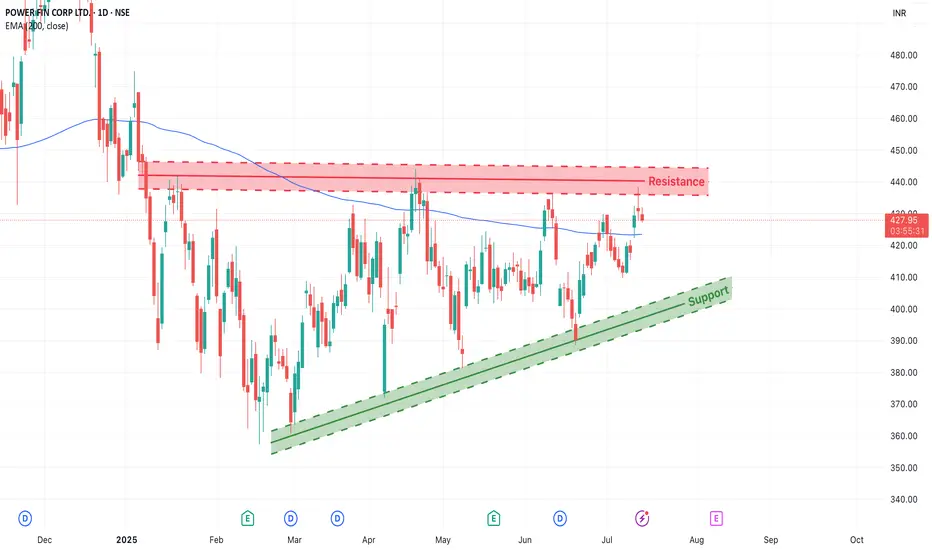
PFC– At Resistance with Ascending Triangle PatternPower Finance Corporation (NSE: PFC) is forming a technically clean structure — trading within a rising trend channel and now testing a critical resistance zone around ₹430–₹440.
This is a make-or-break level, and the market could tip in either direction depending on how price reacts this week.
1. Chart Structure Overview
Support Zone: Defined by a rising green trendline connecting higher lows since March 2025.
Resistance Zone: Red band between ₹430–₹440, where price has previously reversed multiple times.
200 EMA (Blue Line): Currently hovering around ₹423, adding confluence as a dynamic support/resistance level.
This convergence makes the current price zone crucial for directional confirmation.
2. Two Trade Scenarios
Scenario 1: Bullish Breakout (Trend Continuation)
If the price breaks above ₹440 with strong bullish candles, traders can look for:
✅ Entry after a confirmed breakout + re-test of the ₹430–₹435 zone
🎯 Target Zones: ₹455, ₹470+
🛡️ Stop Loss: Below the swing low of the re-test (₹425 or as per price structure)
🔁 Risk/Reward: 1:2 or better
Scenario 2: Resistance Rejection (Short-Term Pullback)
If the price fails to break above ₹430–₹440 and shows reversal patterns:
✅ Entry on confirmation (e.g., bearish engulfing, rejection wick)
🎯 Target Zones: ₹410 (near rising trendline), possible extension to ₹400
🛡️ Stop Loss: Just above the resistance (~₹442–₹445)
🔁 Risk/Reward: 1:2 to 1:3 depending on entry
Thread>
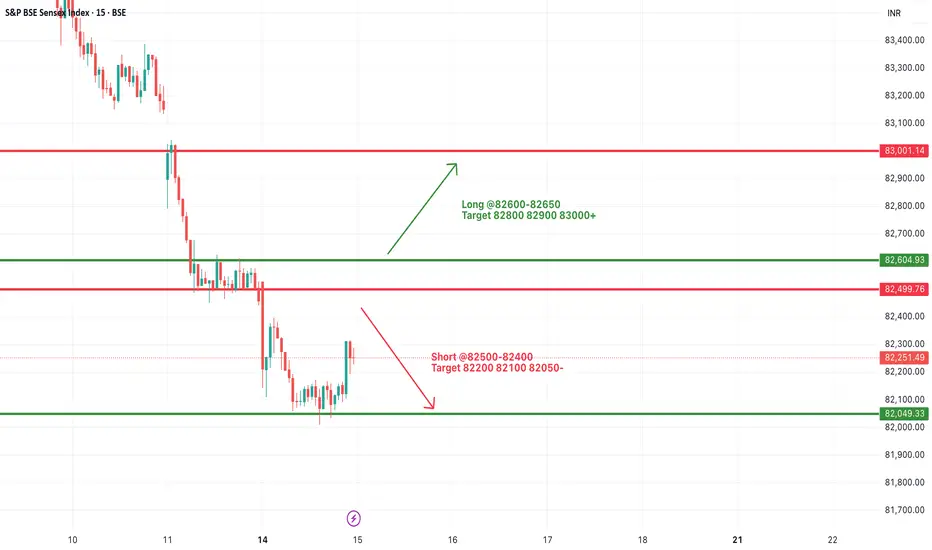
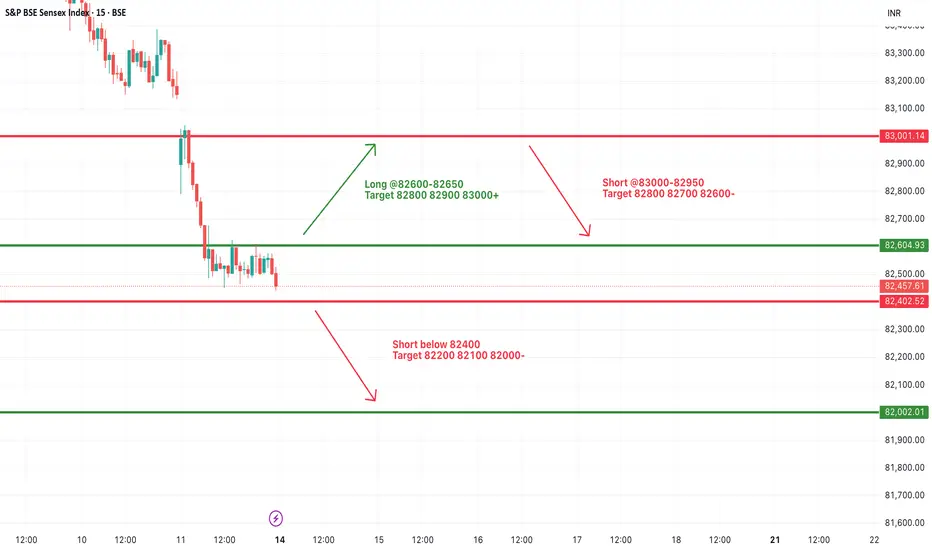
#SENSEX Intraday Support and Resistance Levels - 15/07/2025Sensex is likely to kick off the session with a gap-up opening around the 82500 level, reflecting early bullish momentum. If this initial strength holds and the index begins to build above the 82600–82650 zone, it could signal the start of a recovery leg toward higher resistance levels at 82800, 82900, and potentially 83000+. Sustained action above 82650 may encourage momentum traders to chase strength during the day.
However, the 82500–82650 range will act as a battleground. Failure to defend this zone could invite selling pressure. A breakdown below 82500 may expose the index to intraday weakness, opening downside targets at 82200, 82100, and even 82050. In this case, expect volatility to increase near support levels.
Traders should approach with a flexible strategy—watching for breakout confirmation above 82650 or signs of reversal pressure below 82500. Today’s early range could set the tone for the entire session.
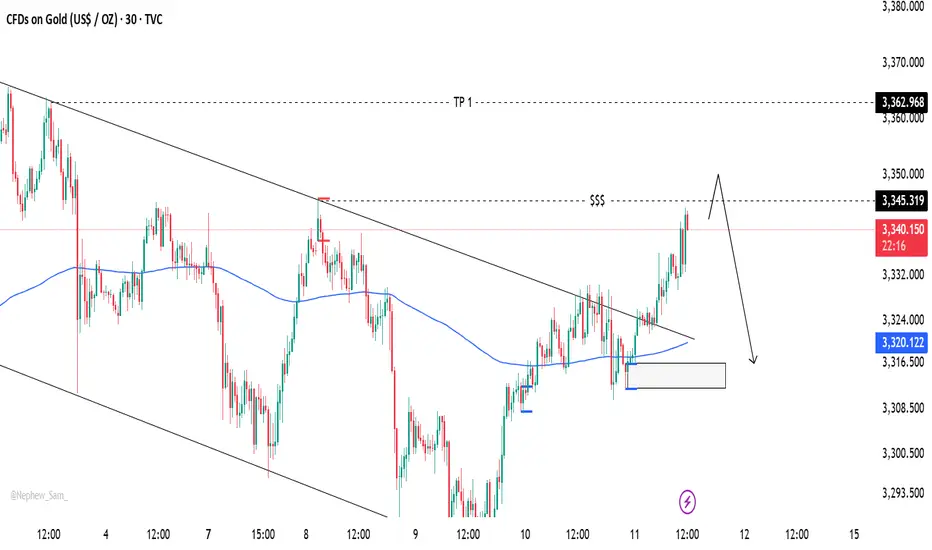
Gold’s Chart Update Next Move: Bullish or Bearish?Gold has shown strong bullish momentum 💪 as it breaks through the descending trendline 📉, positioning itself to target the upper liquidity zone 💰. Right now, we have two key scenarios to watch:
1️⃣ Bullish Scenario: If Gold breaks above the 3345 level and closes a solid candle above it 🔝, we could see a move towards 3360 🚀, signaling further upward potential.
2️⃣ Bearish Scenario: However, if Gold sweeps the 3345 zone and fails to maintain the bullish momentum 🔻, we may see a pullback that could push prices lower 📉.
Stay vigilant 👀 and keep an eye on price action for the next big move! 🔍📊
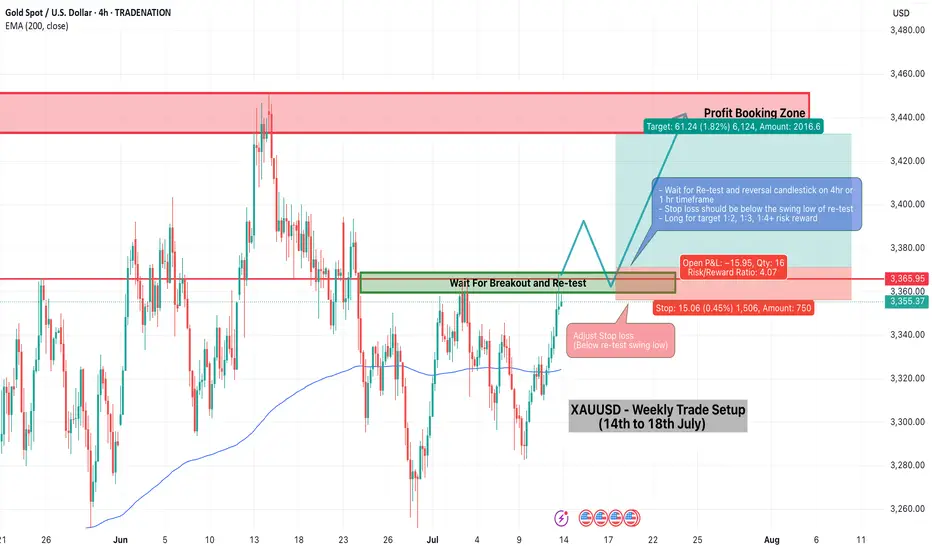
XAUUSD Weekly Trade Setup(14-18th July 2025) - Bullish StrategyIn the ever-volatile world of commodities, Gold (XAUUSD) has yet again presented a promising technical setup. For traders looking to capitalize on price action and structure-based strategies, the upcoming week (14th to 18th July 2025) offers a clean breakout and retest opportunity backed by a strong risk/reward ratio.
Let’s break down the trade plan in detail.
1. Overview of the Current Market Structure
As shown in the 4-hour chart, XAUUSD is approaching a key horizontal resistance zone around 3360–3370. Historically, this area has acted as a rejection point for buyers. However, the recent bullish momentum, supported by price trading above the 200 EMA, suggests a potential breakout.
This forms the basis of a Breakout-Retest-Continuation strategy – one of the most reliable setups in price action trading.
2. The Trade Plan
Here’s the structured plan for this setup:
🔵 Step 1: Wait for the Breakout
Price must break above the resistance zone (3360–3370) with a strong bullish candle.
Avoid chasing the breakout; instead, let the market confirm its direction.
🟠 Step 2: Look for the Retest
After the breakout, wait for the price to pull back to the broken resistance, now acting as support.
Confirm this retest with a reversal candlestick pattern (e.g., bullish engulfing or hammer) on the 1H or 4H timeframe.
🔴 Step 3: Entry and Stop Loss
Enter the trade after the confirmation candle closes.
Place a stop loss below the swing low of the retest zone.
This protects the trade in case of a false breakout.
🟢 Step 4: Set Your Target
The profit booking zone lies around the 3440–3450 region.
This setup offers a Risk/Reward Ratio of 1:4, targeting 1:2, 1:3, and potentially 1:4 if momentum continues.
3. Why This Setup Makes Sense
EMA Confirmation: Price is trading above the 200 EMA, showing bullish bias.
Clean Price Action: Well-defined structure makes it easy to identify breakout/retest levels.
Strong Risk Management: The stop is tight and logical, while the upside potential is considerable.
Psychological Support Zone: 3360–3370 has repeatedly acted as a key decision level.
4. Trade Management Tips
Trail your stop loss once 1:2 R:R is achieved.
Consider partial profit booking at 1:2 or 1:3 to lock in gains and reduce risk.
Be patient – the key to this strategy is waiting for the retest confirmation.
5. Final Thoughts
Trading XAUUSD can be both rewarding and risky. This weekly setup gives you a disciplined approach to enter the market at a high-probability point with excellent reward potential. Whether you’re a swing trader or an intraday scalper on lower timeframes, this strategy adapts well with proper confirmation.
Stay tuned for live updates, and as always – plan your trade, and trade your plan.
Happy Trading!
=================================================================
Disclosure: I am part of Trade Nation's Influencer program and receive a monthly fee for using their TradingView charts in my analysis.
=================================================================
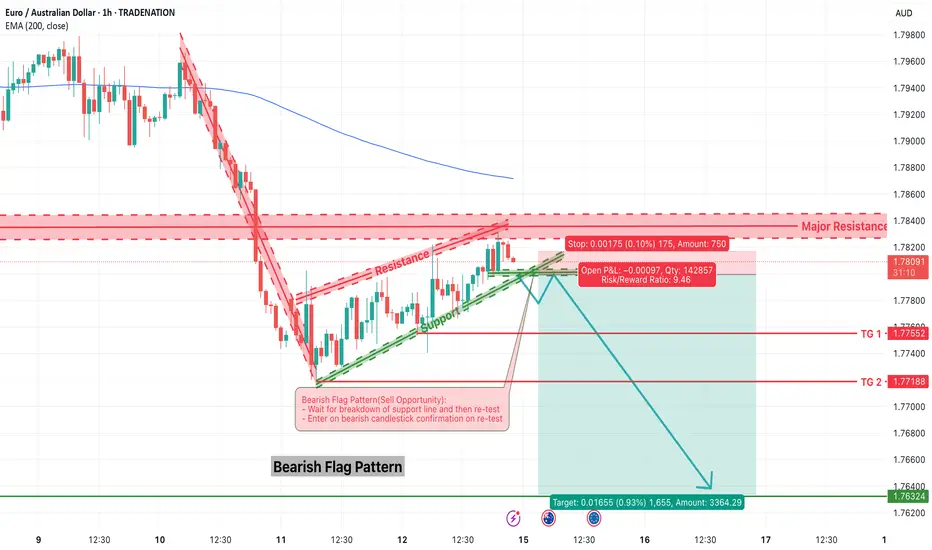
EURAUD – Bearish Flag Breakdown OpportunityThe EURAUD pair is showing signs of trend continuation via a classic bearish flag pattern formation. After a sharp decline, the market has entered into a tight consolidation channel, climbing steadily inside a sloped flag structure. Price is now testing a critical resistance area near 1.7830–1.7840 while hovering just below the 200 EMA.
This setup offers a high-probability sell opportunity — but only after confirmation.
1. Structure Overview
The initial sharp downtrend is followed by a consolidation channel — a textbook bearish flag.
Price is approaching major resistance (1.7830–1.7840) and 200 EMA, acting as a ceiling.
A breakdown from the rising support of the flag is expected to trigger a continuation toward the downside.
2. Trade Plan – Bearish Flag Breakdown
✅ Entry Plan:
Wait for a breakdown of the green support trendline (flag support).
Then, wait for a re-test of the broken support (now resistance).
Enter short only after a bearish candlestick confirmation (e.g., bearish engulfing or rejection wick) on the 15-min or 1-hour chart.
🛡️ Stop Loss:
Place the stop loss just above the major resistance zone, around 1.7835–1.7840.
🎯 Target Zones:
Target 1 (TG1): 1.7755
Target 2 (TG2): 1.7718
Final Target: 1.7632
Risk/Reward Ratio: 1:2, 1:4, 1:9.4+
3. Why This Trade Makes Sense
Bearish Flag is a reliable continuation pattern in strong downtrends.
Price is failing to break above key resistance and 200 EMA.
The flag offers a tight SL and large downside potential — ideal conditions for R:R setups.
Confluence of structure, pattern, and trend all align for short bias.
4. Trade Management Tips
Scale out partial profits at TG1 and TG2, and trail stop for final target.
If breakdown fails, avoid chasing price — re-evaluate bias if price breaks above 1.7840.
5. Final Thoughts
This EURAUD chart is a textbook case of pattern + price action + resistance confluence. The flag structure is well-defined, and the reward-to-risk ratio is significantly favorable if the breakdown confirms.
📌 Watch for:
Breakdown of rising support
Retest and bearish candle
Entry only on confirmation
High-probability setups don’t require prediction — they require preparation.
=================================================================
Disclosure: I am part of Trade Nation's Influencer program and receive a monthly fee for using their TradingView charts in my analysis.
=================================================================
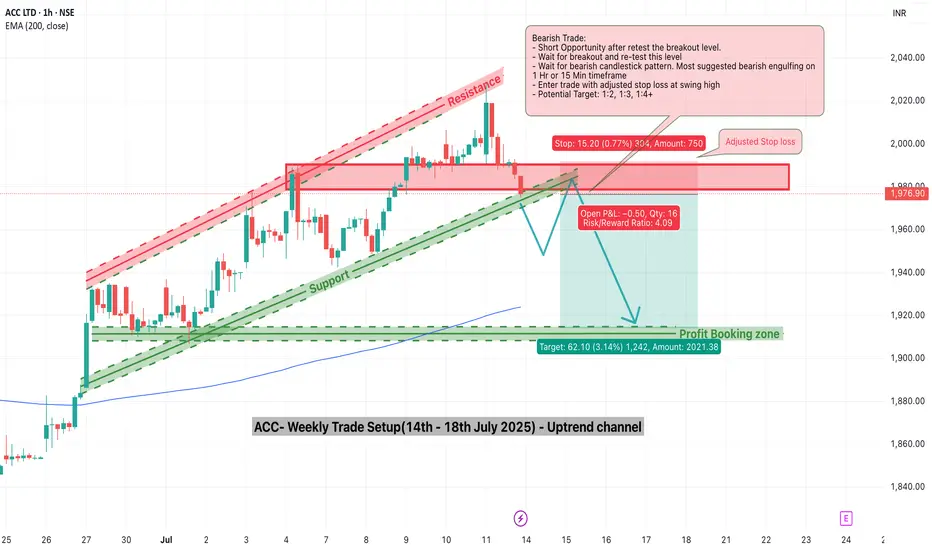
ACC Trade Setup for the Week(14–18 July 2025) – Uptrend ChannelACC Ltd. (NSE: ACC) has been trading inside a clean uptrend channel for the past few weeks, bouncing consistently between rising support and resistance. Now, it approaches a critical inflection point — the lower support of the channel.
While no breakdown has occurred yet, the structure is weakening, and a bearish opportunity may soon present itself. Let’s explore how to trade this if the setup confirms.
1. What’s Happening on the Chart?
ACC is trading close to the channel support zone (~₹1975).
The resistance zone near ₹2000–₹2020 has held strong.
A potential breakdown below the rising green support trendline could trigger a bearish move toward the ₹1910–₹1920 demand zone.
But nothing is confirmed yet — this is a watchlist setup.
2. Trade Setup – Conditional Bearish Opportunity
✅ Trade Plan:
Wait for breakdown of the rising support line.
After breakdown, wait for a re-test of the broken support zone (~₹1975–₹1980).
Look for bearish confirmation via a candlestick pattern (engulfing or strong rejection) on the 15-min or 1-hour timeframe.
🚨 Entry Trigger:
Only enter short if re-test holds and price starts reversing.
📉 Stop Loss:
SL should be above the re-test high (around ₹1990–₹1995).
🎯 Target:
Profit booking zone: ₹1910–₹1920.
Potential R:R: 1:2, 1:3, or even 1:4 depending on entry.
3. Why This Setup Matters
Trend exhaustion is visible near the upper resistance of the channel.
A clean breakdown + re-test gives a low-risk entry.
The 200 EMA lies near the target zone, providing confluence for mean reversion.
4. What If There’s No Breakdown?
If price respects the support and bounces again, no trade should be taken on the short side.
In that case, look for possible bullish reversal signals back toward channel resistance — or stay neutral.
5. Final Thoughts
This is a highly conditional setup — and patience is the key. Don’t jump the gun. The best trades happen after confirmation.
🔔 What to watch this week:
Breakdown below ₹1975 support
Re-test and rejection from ₹1975–₹1985
Confirmation candle (bearish engulfing)
Only then consider a short trade toward ₹1910 with a well-placed SL.
Plan your trade. Wait for structure. Trade only when the market shows its hand.
#SENSEX Intraday Support and Resistance Levels - 14/07/2025Sensex is likely to open slightly gap-down, reflecting weakness carried over from the previous session. The index is currently trading near the 82450 zone. A breakdown below the 82400 level may trigger further downside movement, with potential support targets at 82200, 82100, and 82000. This zone should be monitored closely for continuation or reversal.
On the upside, any strong recovery above the 82600–82650 level could push the index higher, with resistance targets at 82800, 82900, and 83000+. Sustaining above this range may indicate buying interest returning in the market.
If Sensex spikes toward the 82950–83000 zone and faces resistance, a reversal from there could create shorting opportunities with targets at 82800, 82700, and 82600. However, a clear breakout above 83000 would negate this short setup and shift the bias to bullish.
The index is currently in a consolidation zone, and price action around 82600–82400 will be critical to determine the day’s direction.
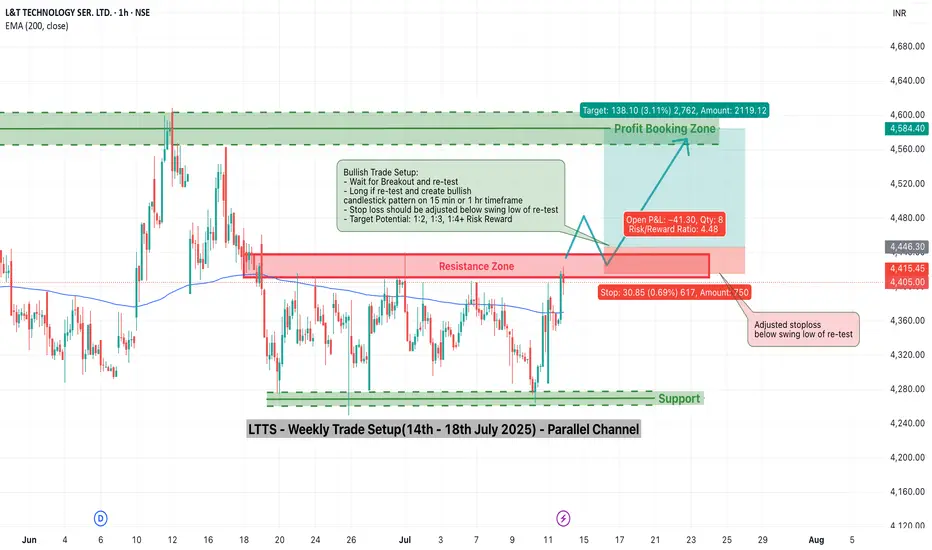
LTTS Weekly Trade Setup(14th-18th July 2025) – Parallel ChannelThis week, L&T Technology Services (LTTS) is showing a potential breakout opportunity that requires patience and precision. As the stock approaches a key resistance zone near ₹4445, traders should resist the urge to jump in early and instead wait for a breakout and confirmed re-test before entering any long positions.
Let’s break this down.
1. Why the Breakout is Important
- LTTS has been consolidating within a parallel channel between ₹4280 (support) and ₹4445 (resistance). Breakouts from such structures often trigger significant moves — but only when confirmed.
- A false breakout can trap early traders. Hence, waiting for the price to break above ₹4445 and then re-test this level is critical.
2. The Strategy – Wait and React
📌 Step 1: Watch for Breakout
Monitor price action as it approaches and breaches the ₹4445 resistance.
Look for strong bullish candles with volume to validate the breakout.
📌 Step 2: Wait for Re-test
After breakout, price may pull back to test the previous resistance.
This re-test acts as a confirmation that bulls are defending the breakout.
📌 Step 3: Look for Confirmation
Enter only when you see a bullish candlestick pattern (like a bullish engulfing or hammer) near the re-test level on 15-min or 1-hour charts.
🛡️ Stop Loss:
Place your stop below the swing low of the re-test.
This protects you if the breakout fails.
🎯 Target:
Profit booking zone is near ₹4580–₹4600.
Risk/reward ratio: 1:2, 1:3, 1:4+
3. Why Re-test Entries are Powerful
They allow low-risk entries with a tight stop loss.
You avoid chasing price and reduce emotional trading.
Confirmation helps you filter out false breakouts.
4. Final Words
In trading, discipline often beats speed. This LTTS setup is all about timing and structure.
🔔 Watch for the breakout.
🧘♂️ Wait for the re-test.
🎯 Enter only with confirmation.
If executed properly, this trade offers a clean, high R:R opportunity with a clearly defined setup.
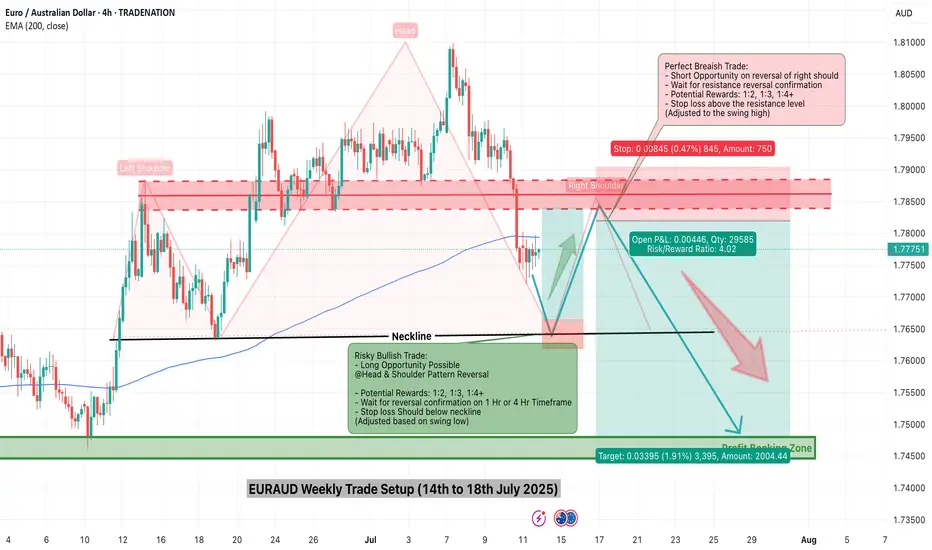
EURAUD Weekly Trade Setup(14 to 18th July 2025) - Head&ShoulderThis week, EURAUD (Euro/Australian Dollar) has entered a critical price zone, providing a textbook technical opportunity for traders. A clear Head & Shoulders pattern has formed on the 4-hour chart, pointing toward a potential trend reversal from bullish to bearish.
Let’s explore how to trade this intelligently from both bullish and bearish perspectives.
1. Bearish Setup – Head & Shoulders Pattern Breakdown
This is the primary trade idea for the week.
✅ Trade Logic:
Price has completed a classic Left Shoulder → Head → Right Shoulder formation.
The neckline (support) will be tested.
The current price is will pulling back to retest the right shoulder resistance zone, offering an ideal short opportunity.
🔻 Entry Plan:
Wait for bearish reversal confirmation (candlestick rejection or bearish engulfing) on the 1H or 4H timeframe.
Enter short once confirmation appears near 1.7850–1.7900.
📉 Stop Loss:
Place SL above the right shoulder high, adjusting for volatility and swing high (around 1.7950).
🎯 Targets:
Target zone: 1.7450–1.7500 (profit booking zone marked on the chart)
Potential Risk/Reward Ratio: 1:2, 1:3, or even 1:4+
2. Alternative Bullish Setup – Reversal at Neckline (High Risk)
This setup is for experienced or aggressive traders who spot early reversals.
✅ Trade Logic:
Price may bounce from the neckline and 200 EMA support area.
If this happens, a temporary bullish reversal may push price back toward the right shoulder zone.
🔺 Entry Plan:
Wait for bullish confirmation (reversal candle) near the neckline and EMA support (around 1.7700).
🚨 Stop Loss:
SL must be below the neckline swing low (around 1.7650).
🎯 Targets:
Resistance zone (right shoulder): 1.7850–1.7900
R:R setups of 1:2 or 1:3 possible
⚠️ This is considered a counter-trend trade and should be traded with caution.
3. Technical Confluence and Indicators
Pattern: Head & Shoulders (bearish reversal)
EMA 200: Price reacting around the long-term trend line
Support/Resistance: Cleanly defined horizontal zones
Reversal zones: Highlighted in red (supply) and green (demand)
4. Final Thoughts
This week’s EURAUD setup is a strong example of structure-based trading. With a well-formed head and shoulders pattern and a clean neckline break, the market signals a shift in momentum.
Safe Approach: Trade the short side after resistance rejection.
Risky Approach: Try a long on neckline bounce with tight SL.
Always confirm with your system and maintain strict risk management. Trade what you see, not what you feel.
Ready to trade? Save this setup, monitor price action, and execute only with confirmation.
=================================================================
Disclosure: I am part of Trade Nation's Influencer program and receive a monthly fee for using their TradingView charts in my analysis.
=================================================================
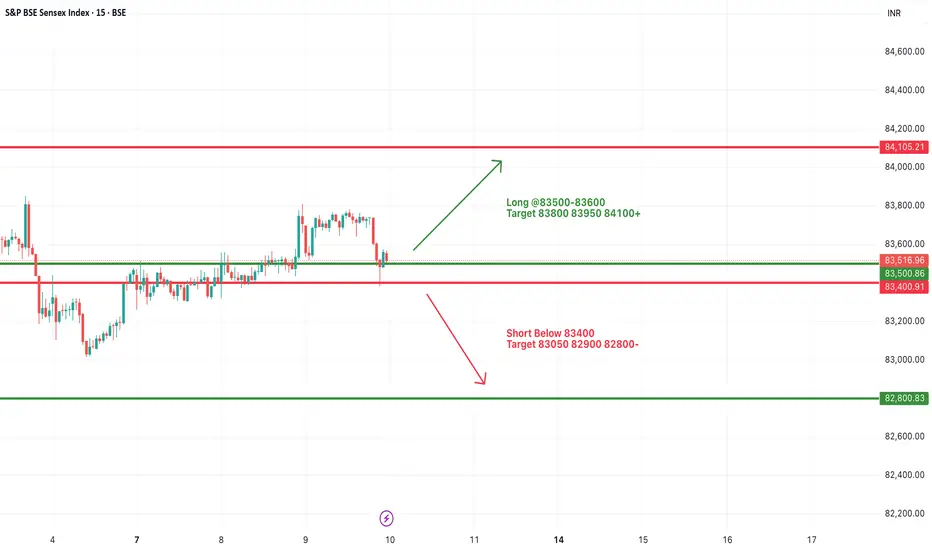
#SENSEX Intraday Support and Resistance Levels - 10/07/2025Sensex is expected to open flat today, continuing the consolidation observed in the past few sessions. The price action remains range-bound with key support near 83400 and resistance around 83600 levels.
Currently, Sensex is hovering near its critical range with buyers and sellers struggling for control. A breakout above the 83500–83600 zone may trigger fresh bullish momentum with targets at 83800, 83950, and 84100+. Sustained movement above 84100 could signal a stronger trend reversal.
On the downside, a breakdown below the 83400 level could lead to weakness, with immediate targets at 83050, 82900, and 82800-.
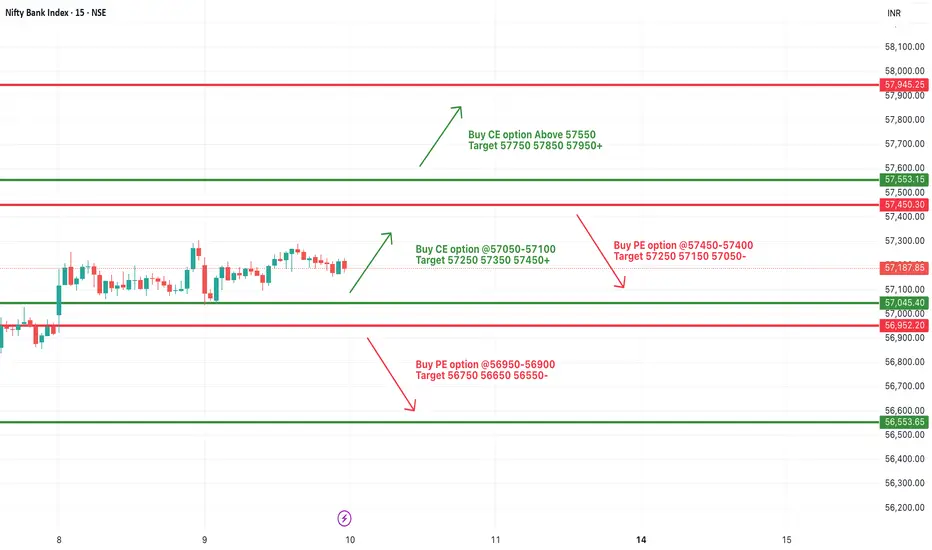
[INTRADAY] #BANKNIFTY PE & CE Levels(10/07/2025)Bank Nifty is expected to open flat today due to the continued consolidation seen over the last few sessions. The index is trading within a tight range between 57450 on the upside and 57050 on the downside, indicating indecision in the market.
A sustain above the 57050–57100 zone could initiate fresh buying momentum, potentially pushing prices towards the targets of 57250, 57350, and 57450+. Sustained move above 57550 may further lead to an extended rally toward 57750, 57850, and even 57950+ levels.
On the other hand, if the index breaks below the 56950–56900 level, it may invite fresh selling pressure. In such a scenario, downside targets are seen at 56750, 56650, and 56550-.
Until a decisive move happens beyond the upper or lower bounds, expect sideways action within the current consolidation range. Traders are advised to wait for a breakout from the range for directional trades.
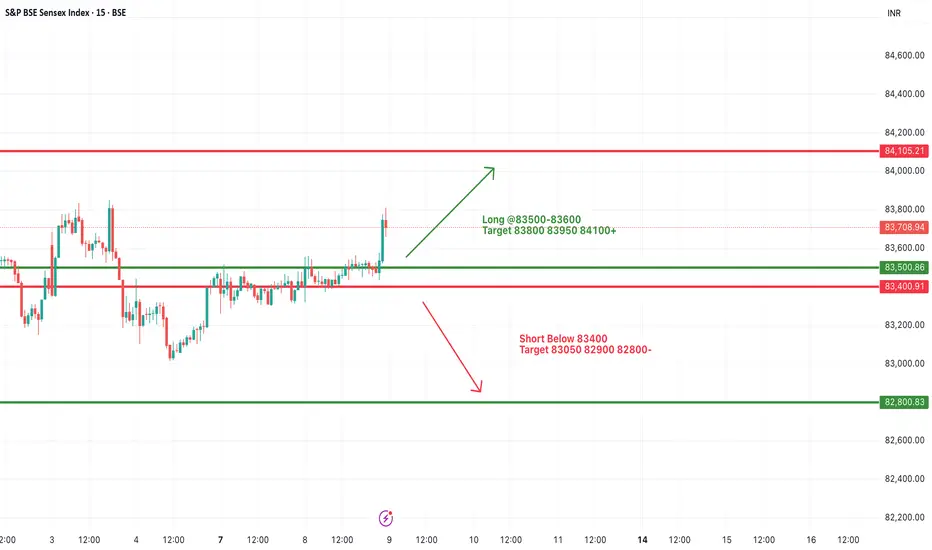
#SENSEX Intraday Support and Resistance Levels - 09/07/2025Sensex is expected to open slightly gap up near the 83500–83600 range, showing positive momentum as it breaks out from its recent consolidation zone. A sustained move above this level could trigger further upside, with immediate targets seen at 83800, 83950, and 84100+ levels. This zone will act as a crucial resistance-turned-support for the session.
However, if the index fails to hold above 83500 and slips below 83400, it may enter a corrective phase. A breakdown below 83400 could lead to a downward move toward 83050, 82900, and possibly 82800-. Overall, trend remains positive above 83600, and traders should watch for confirmation in the opening session.
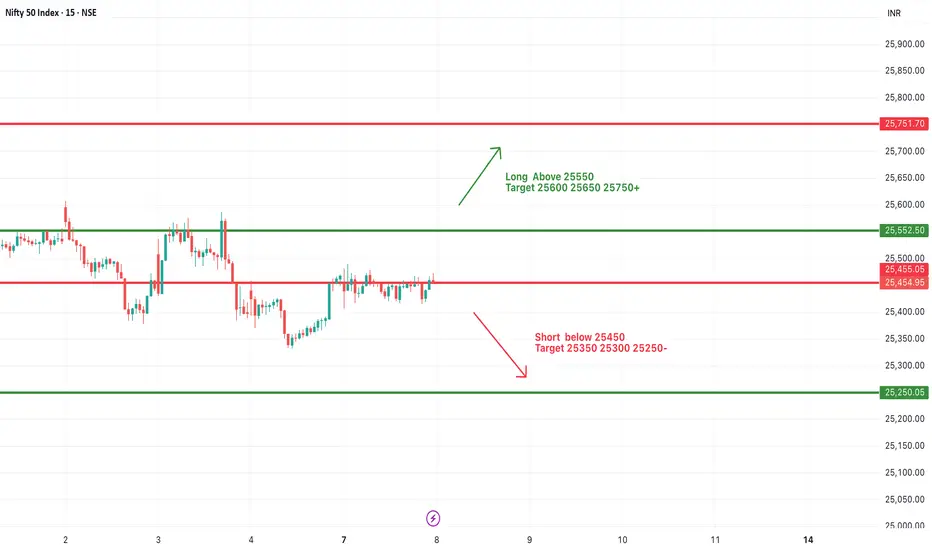
#NIFTY Intraday Support and Resistance Levels - 08/07/2025Nifty is expected to open flat with no major change in the overall levels compared to the previous session. The index continues to hover near a crucial resistance zone around 25450–25500. A breakout above 25550 will indicate bullish strength and may lead to an upward move toward 25600, 25650, and even 25750+. This zone has been tested multiple times, and a decisive break can attract further buying.
On the downside, the support remains at 25450. A break below this level can invite selling pressure, with immediate targets at 25350, 25300, and 25250-. The market is clearly respecting this consolidation band, so any directional move will depend on a confirmed breakout or breakdown from these levels.
Traders should remain cautious and avoid early entries unless a clean move is seen beyond the 25550 or below the 25450 levels.
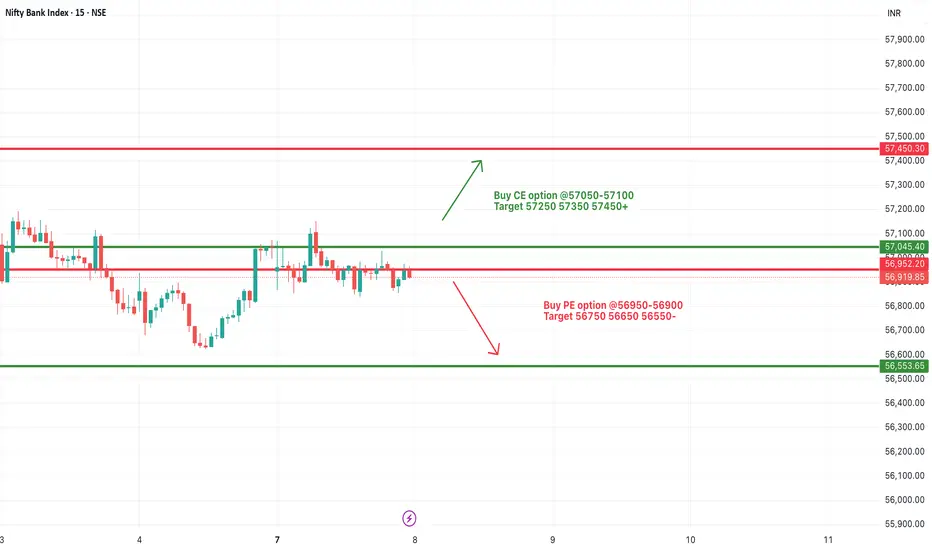
[INTRADAY] #BANKNIFTY PE & CE Levels(08/07/2025)Bank Nifty is expected to open flat with no significant change in levels compared to the previous session. The price action continues to remain within a consolidation range between 56950 and 57050. A breakout above the 57050 level could trigger bullish momentum, with potential upside targets at 57250, 57350, and 57450+. This resistance zone has been tested multiple times, and a clean breakout could attract fresh buying interest.
On the other hand, if Bank Nifty slips below the 56950–56900 support zone, it may lead to fresh selling pressure. In that case, we may see targets of 56750, 56650, and 56550 being achieved on the downside.
Since the market is currently range-bound and trading near the breakout/breakdown zones, traders are advised to stay cautious and wait for a confirmed move above 57050 or below 56950 for directional trades. Risk management is key, especially in this narrow consolidation phase.
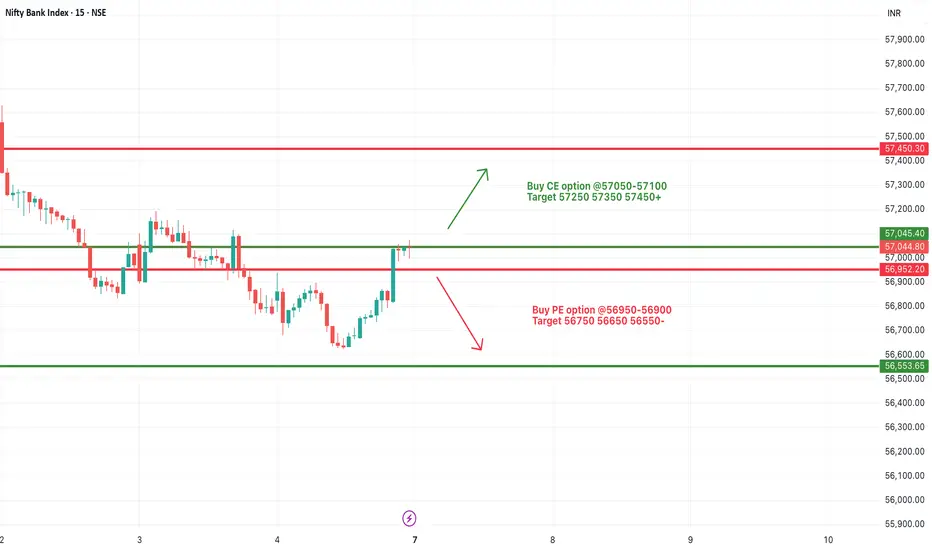
[INTRADAY] #BANKNIFTY PE & CE Levels(07/07/2025)Bank Nifty is expected to open flat near the 57000 mark, which coincides with a crucial resistance level. If the index manages to sustain above the 57050–57100 zone, it may trigger bullish momentum, pushing prices toward immediate targets of 57250, 57350, and potentially 57450+. This breakout zone holds significance as it marks a clear shift in sentiment from recent downtrends to potential reversal.
On the downside, if Bank Nifty faces rejection from current levels and slips below the 56900–56950 zone, it may indicate fresh weakness. In such a scenario, we can expect downward movement with targets at 56750, 56650, and 56550. The 56900 level will act as a short-term support, and a breakdown below it may resume the bearish momentum from the past sessions.
Traders should be cautious near the 57000–57050 zone and wait for a clear directional move. Whichever side breaks first, the movement is likely to gain momentum, so manage positions with strict stop losses and partial booking at each target.
[INTRADAY] #BANKNIFTY PE & CE Levels(04/07/2025)Bank Nifty will open with a gap-up near the 56950 zone, placing it close to an immediate resistance area. If the index sustains above the 57050–57100 level, it indicates bullish strength and could trigger a further upward move toward 57250, 57350, and potentially 57450+. This level acts as a breakout zone for upside momentum. On the other hand, if the price faces resistance around 56950–57000 and starts reversing, a short opportunity opens below 56950–56900, with targets placed at 56750, 56650, and 56550.
In case Bank Nifty falls further and breaches the 56450 mark, it may signal a strong breakdown and continuation of the downtrend, leading to lower targets around 56250, 56150, and 56050. However, if the index takes support at the 56650–56600 zone and shows signs of reversal, it can provide a buying opportunity for a bounce back toward 56750, 56850, and 56950.
Overall, the day’s strategy should be reactive to these key levels, with trades initiated only upon proper price action confirmation. Use trailing stop-loss to protect profits and exit partially at key target levels.
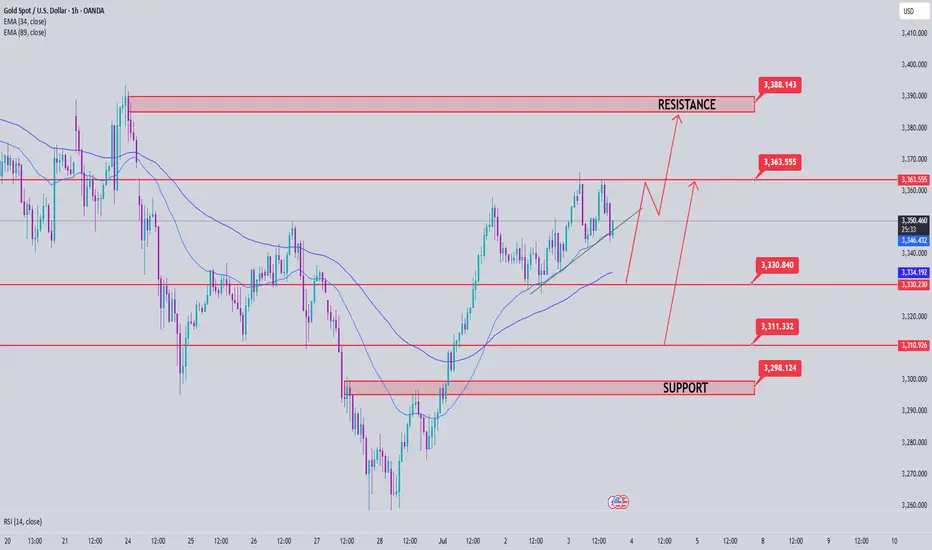
Gold Price Analysis July 3GOLD Technical Analysis - D1 Frame
On the D1 frame, the uptrend is still being maintained with momentum towards the price gap zone. During the European session, selling pressure started to appear around the resistance zone of 3365 - showing that this is the area where the sellers are making counter-moves.
On the chart, the gold price is accumulating and forming a triangle pattern, indicating the possibility of a strong movement phase.
If the price breaks the upper border of the triangle (above the 3363 zone), it will likely open up an opportunity to approach the next resistance at 3388.
On the contrary, if it breaks the lower border (below the 3330 zone), the correction trend may be triggered, heading towards deeper support zones.
Important Zones:
Resistance: 3363 – 3388
Support: 3330 – 3311 – 3297 – 3277
Trading Strategy:
BUY Breakout: When price breaks above 3363
SELL Breakout: When price breaks below 3330