Trading as a Probabilistic ProcessTrading as a Probabilistic Process
As mentioned in the previous post , involvement in the market occurs for a wide range of reasons, which creates structural disorder. As a result, trading must be approached with the understanding that outcomes are variable. While a setup may reach a predefined target, it may also result in partial continuation, overextension, no follow-through, or immediate reversal. We trade based on known variables and informed expectations, but the outcome may still fall outside them.
Therefore each individual trade should be viewed as a random outcome. A valid setup could lose; an invalid one could win. It is possible to follow every rule and still take a loss. It is equally possible to break all rules and still see profits. These inconsistencies can cluster into streaks, several wins or losses in a row, without indicating anything about the applied system.
To navigate this, traders should think in terms of sample size. A single trade provides limited insight, relevant information only emerges over a sequence of outcomes. Probabilistic trading means acting on repeatable conditions that show positive expectancy over time, while accepting that the result of any individual trade is unknowable.
Expected Value
Expected value is a formula to measure the long-term performance of a trading system. It represents the average outcome per trade over time, factoring in both wins and losses:
Expected Value = (Win Rate × Average Win) – (Loss Rate × Average Loss)
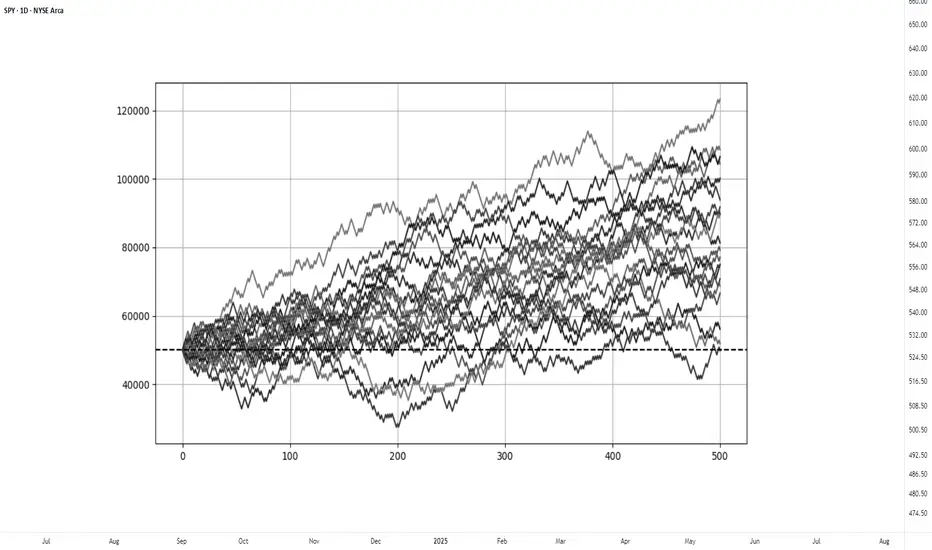
This principle can be demonstrated through simulation. A basic system with a 50% win rate and a 1.1 to 1 reward-to-risk ratio was tested over 500 trades across 20 independent runs. Each run began with a $50,000 account and applied a fixed risk of $1000 per trade. The setup, rules, and parameters remained identical throughout; the only difference was the random sequence in which wins and losses occurred.
While most runs clustered around a profitable outcome consistent with the positive expected value, several outliers demonstrated the impact of sequencing. When 250 trades had been done, one account was up more than 60% while another was down nearly 40%. In one run, the account more than doubled by the end of the 500 trades. In another, it failed to generate any meaningful profit across the entire sequence. These differences occurred not because of flaws in the system, but because of randomness in the order of outcomes.
These are known as Monte Carlo simulations, a method used to estimate possible outcomes of a system by repeatedly running it through randomized sequences. The technique is applied in many fields to model uncertainty and variation. In trading, it can be used to observe how a strategy performs across different sequences of wins and losses, helping to understand the range of outcomes that may result from probability.
Trading System Variations
Two different strategies can produce the same expected value, even if they operate on different terms. This is not a theoretical point, but a practical one that influences what kind of outcomes can be expected.
For example, System A operates with a high win rate and a lower reward-to-risk ratio. It wins 70% of the time with a 0.5 R, while System B takes the opposite approach and wins 30% of the time with a 2.5 R. If the applied risk is $1,000, the following results appear:
System A = (0.70 × 500) − (0.30 × 1,000) = 350 − 300 = $50
System B = (0.30 × 2,500) − (0.70 × 1,000) = 750 − 700 = $50
Both systems average a profit of $50 per trade, yet they are very different to trade and experience. Both are valid approaches if applied consistently. What matters is not the math alone, but whether the method can be executed consistently across the full range of outcomes.
Let’s look a bit closer into the simulations and practical implications.
The simulation above shows the higher winrate, lower reward system with an initial $100,000 balance, which made 50 independent runs of 1000 trades each. It produced an average final balance of $134,225. In terms of variance, the lowest final balance reached $99,500 while the best performer $164,000. Drawdowns remained modest, with an average of 7.67%, and only 5% of the runs ended below the initial $100,000 balance. This approach delivers more frequent rewards and a smoother equity curve, but requires strict control in terms of loss size.
The simulation above shows the lower winrate, higher reward system with an initial $100,000 balance, which made 50 independent runs of 1000 trades each. It produced an average final balance of $132,175. The variance was wider, where some run ended near $86,500 and another moved past $175,000. The drawdowns were deeper and more volatile, with an average of 21%, with the worst at 45%. This approach encounters more frequent losses but has infrequent winners that provide the performance required. This approach requires patience and mental resilience to handle frequent losses.
Practical Implications and Risk
While these simulations are static and simplified compared to real-world trading, the principle remains applicable. These results reinforce the idea that trading outcomes must be viewed probabilistically. A reasonable system can produce a wide range of results in the short term. Without sufficient sample size and risk control, even a valid approach may fail to perform. The purpose is not to predict the outcome of one trade, but to manage risk in a way that allows the account to endure variance and let statistical edge develop over time.
This randomness cannot be eliminated, but the impact can be controlled from position sizing. In case the size is too large, even a profitable system can be wiped out during an unfavorable sequence. This consideration is critical to survive long enough for the edge to express itself.
This is also the reason to remain detached from individual trades. When a trade is invalidated or risk has been exceeded, it should be treated as complete. Each outcome is part of a larger sample. Performance can only be evaluated through cumulative data, not individual trades.
Probability
123 Quick Learn Trading Tips - Tip #7 - The Dual Power of Math123 Quick Learn Trading Tips - Tip #7
The Dual Power of Math: Logic for Analysis, Willpower for Victory
✅ An ideal trader is a mix of a sharp analyst and a tough fighter .
To succeed in the financial markets, you need both logical decision-making and the willpower to stay on track.
Mathematics is the perfect gym to develop both of these key skills at the same time.
From a logical standpoint, math turns your mind into a powerful analysis tool. It teaches you how to break down complex problems into smaller parts, recognize patterns, and build your trading strategies with step-by-step thinking.
This is the exact skill you need to deeply understand probabilities and accurately calculate risk-to-reward ratios. 🧠
But the power of math doesn't end with logic. Wrestling with a difficult problem and not giving up builds a steel-like fighting spirit. This mental strength helps you stay calm during drawdowns and stick to your trading plan.
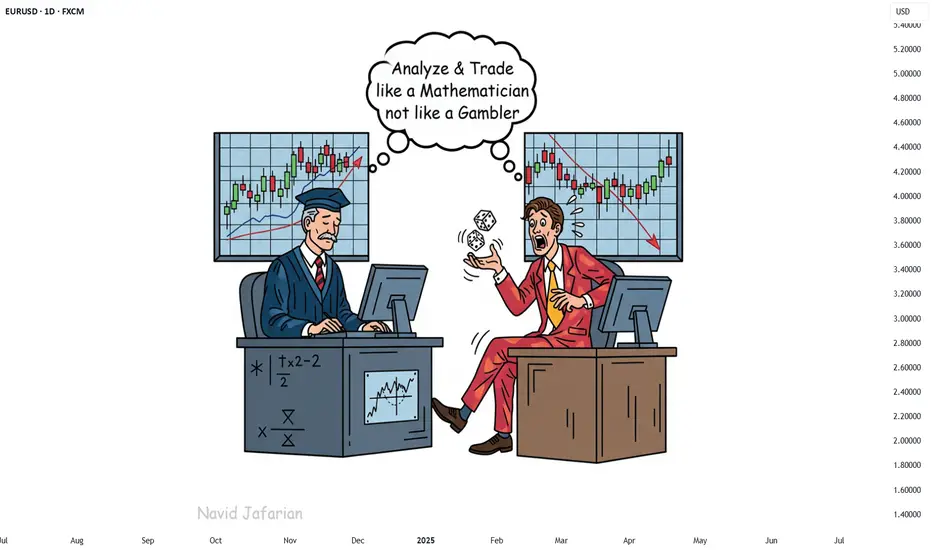
"Analyze with the precision of a mathematician and trade with the fighting spirit of a mathematician 👨🏻🎓,
not with the excitement of a gambler 🎲. "
Navid Jafarian
Every tip is a step towards becoming a more disciplined trader.
Look forward to the next one! 🌟
What Is T-Distribution in Trading? What Is T-Distribution in Trading?
In the financial markets, understanding T-distribution in probability is a valuable skill. This statistical concept, crucial for small sample sizes, offers insights into market trends and risks. By grasping T-distribution, traders gain a powerful tool for evaluating strategies, risks, and portfolios. Let's delve into what T-distribution is and how it's effectively used in the realm of trading.
Understanding T-Distribution
The T-distribution in probability distribution plays a crucial role in trading, especially in situations where sample sizes are small. William Sealy Gosset first introduced it under the pseudonym "Student". This distribution resembles the normal distribution with its bell-shaped curve but has thicker tails, meaning it predicts more outcomes in the extreme ends than a normal distribution would.
A key element of T-distribution is the concept of 'degrees of freedom', which essentially refers to the number of values in a calculation that are free to vary. It's usually the sample size minus one.
The degrees of freedom affect the shape of the T-distribution; with fewer degrees of freedom, the distribution has heavier tails. As the degrees of freedom increase, the distribution starts to resemble the normal distribution more closely. This is particularly significant in trading when dealing with small data sets, where the T-distribution provides a more accurate estimation of probability and risk than the normal distribution.
T-Distribution vs Normal Distribution
T-distribution and normal distribution are foundational in statistical analysis, yet they serve different purposes. While both exhibit a bell-shaped curve, the T-distribution has thicker tails, implying a higher probability of extreme values. This makes it more suitable for small sample sizes or when the standard deviation is unknown.
In contrast, the normal distribution, with its thinner tails, is ideal for larger sample sets where the standard deviation is known. Traders often use T-distribution for more accurate analysis in small-scale or uncertain data scenarios, while normal distribution is preferred for larger, more stable datasets, where extreme outcomes are less likely.
Application in Trading
In trading, T-distribution is a valuable tool for analysing financial data. It is primarily used in constructing confidence intervals and conducting hypothesis testing, which are essential for making informed trading decisions.
For instance, a trader might use T-distribution to test the effectiveness of a new trading strategy. Suppose a trader has developed a strategy using the technical analysis tools and wants to understand its potential effectiveness compared to the general market performance. They would collect a sample of returns from this strategy over a period, say, 30 days. Given the small sample size, using T-distribution is appropriate here.
The trader would then calculate the mean return of this sample and use T-distribution to create a confidence interval. This interval would provide a range within which the true mean return of the strategy is likely to lie, with a certain level of confidence. If this confidence interval shows a higher mean return than the market average, the trader might conclude that the strategy is potentially effective. However, it's important to note that this is an estimation and not a guarantee of future performance.
How to Plug Probability and Normal Distribution in Your T-Calculation
To use a T-calculator for integrating probability and normal distribution, follow these steps:
- Input Degrees of Freedom: For T-distribution, calculate the degrees of freedom (sample size minus one).
- Convert Z-Score to T-Value: If using normal distribution data, convert the Z-score (standard deviation units from the mean in a normal distribution) to a T-value using the formula: T = Z * (sqrt(n)), where 'n' is the sample size.
- Enter T-Value: Input this T-value into the calculator.
- Calculate Probability: The calculator will then output the probability, providing a statistical basis for trading decisions based on the T-distribution.
Limitations and Considerations of T-Distribution
While T-distribution is a powerful tool in trading analysis, it's important to recognise its limitations and considerations:
- Sample Size Sensitivity: T-distribution is most effective with small sample sizes. As the sample size increases, it converges to a normal distribution, reducing its distinct utility.
- Assumption of Normality: T-distribution assumes that the underlying data is approximately normally distributed. This may not hold true for all financial data sets, especially those with significant skewness or kurtosis.
- Degrees of Freedom Complications: Misestimating degrees of freedom can lead to inaccurate results. It's crucial to calculate this correctly based on the sample data.
- Outlier Sensitivity: T-distribution can be overly sensitive to outliers in the data, which can skew results.
Advanced Applications of T-Distribution in Trading
T-distribution extends beyond basic trading applications, playing a role in advanced financial analyses:
- Risk Modelling: Utilised in constructing sophisticated risk models, helping traders assess the probability of extreme losses.
- Algorithmic Trading: Integral in developing complex algorithms.
- Portfolio Optimisation: Assists in optimising portfolios by estimating returns and risks of various assets.
- Market Research: Used in advanced market research methodologies to analyse small sample behavioural studies.
The Bottom Line
The T-distribution is a powerful tool, offering nuanced insights in scenarios involving small sample sizes or uncertain standard deviations. Its ability to accommodate real-world data's quirks makes it invaluable for various trading applications, from strategy testing to risk assessment. However, understanding its limitations and proper application is crucial for accurate analysis.
This article represents the opinion of the Companies operating under the FXOpen brand only. It is not to be construed as an offer, solicitation, or recommendation with respect to products and services provided by the Companies operating under the FXOpen brand, nor is it to be considered financial advice.
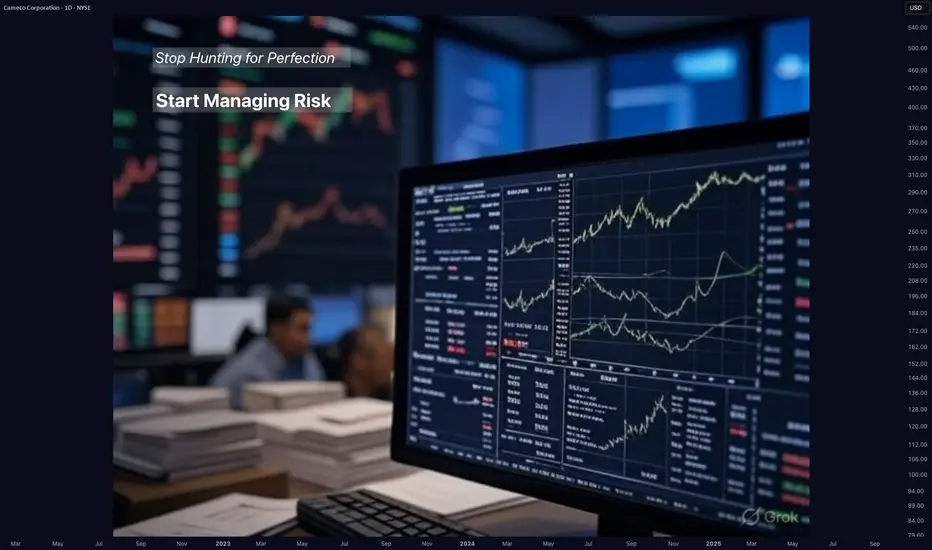
Stop Hunting for Perfection - Start Managing Risk.Stop Hunting for Perfection — Start Managing Risk.
Hard truth:
Your obsession with perfect setups costs you money.
Markets don't reward perfectionists; they reward effective risk managers.
Here's why your perfect entry is killing your results:
You ignore good trades waiting for ideal setups — they rarely come.
You double-down on losing trades, convinced your entry was flawless.
You're blindsided by normal market moves because you didn’t plan for imperfection.
🎯 Solution?
Shift your focus from entry perfection to risk management. Define your maximum acceptable loss, stick to it, and scale into trades strategically.
TrendGo wasn't built to promise perfect entries. It was built to clarify probabilities and structure risk.
🔍 Stop chasing unicorns. Focus on managing the horses you actually ride.
Most Traders Want Certainty. The Best Ones Want Probability.Hard truth:
You’re trying to trade like an engineer in a casino.
You want certainty in an environment that only rewards probabilistic thinking.
Here’s how that kills your edge:
You wait for “confirmation” — and enter too late.
By the time it feels safe, the market has moved.
You fear losses — but they’re the cost of data.
Good traders don’t fear being wrong. They fear not knowing why.
You need to think in bets, not absolutes.
Outcomes don’t equal decisions. Losing on a great setup is still a good trade.
🎯 Fix it with better framing.
That’s exactly what we designed TrendGo f or — to help you see trend strength and structure without delusions of certainty.
Not perfect calls. Just cleaner probabilities.
🔍 Train your brain for the game you’re playing — or you’ll keep losing by default.

Probabilistic thinking. Using Technical logic to get odds.Markets are simple if you think about it.
moderate and long range resistance -- is the best odds for rally.
"horizontal" or 50-50 supports -- risky.
steep supports mean high demand, strong trends. Buying at such supports, at worst it bounces to the upside. (High market with strong trend can mean reversals)
rule: break outs always must coincide with 200dma rallies.
Bonus.
High market, strong trend -- best odds for reversal .
50-50 resistance, with weak support --> trickster market. (trap)
strong trend but no flying 200dma --> trap.
50-50 resistance with strong trend, high market, but weak 200dma ---> good odds for reversal.
keeping it simple.
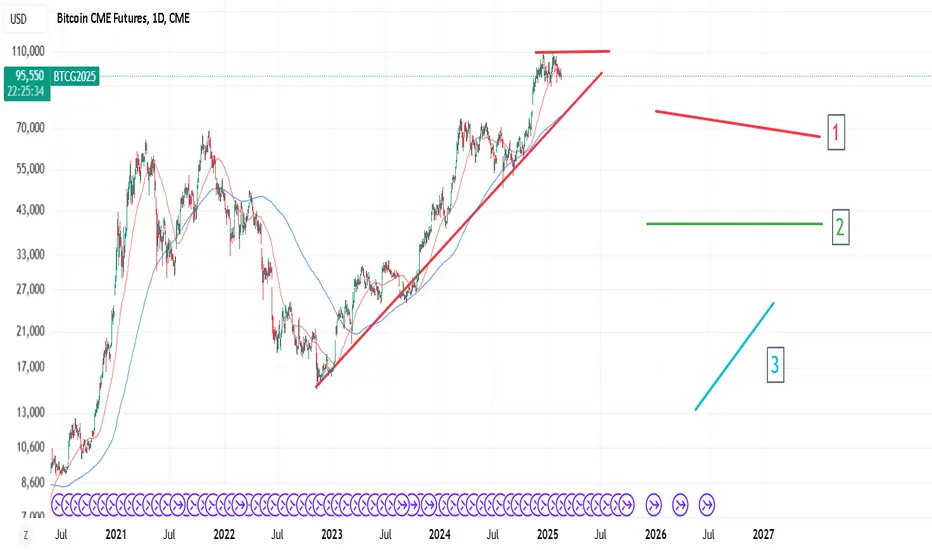
P.S. this method shows why odds favor BTC reversal . Or why 110/120k had to be peak point. for now.
Trade high probabilities using game theoryAccording to statistics, 95% of traders are losing longterm. Not because they lack skill, but because they involve in high variance (or poor probability) situations.
What is game theory? we can define GT with three principles.
*People dont want to lose. (hence.. predictable).
*People buy good things at good price, or they are profit maximizing.
*Everyone is strategic.
** we assume that "nobody can predict future".
** markets respond to feedbacks or signals.
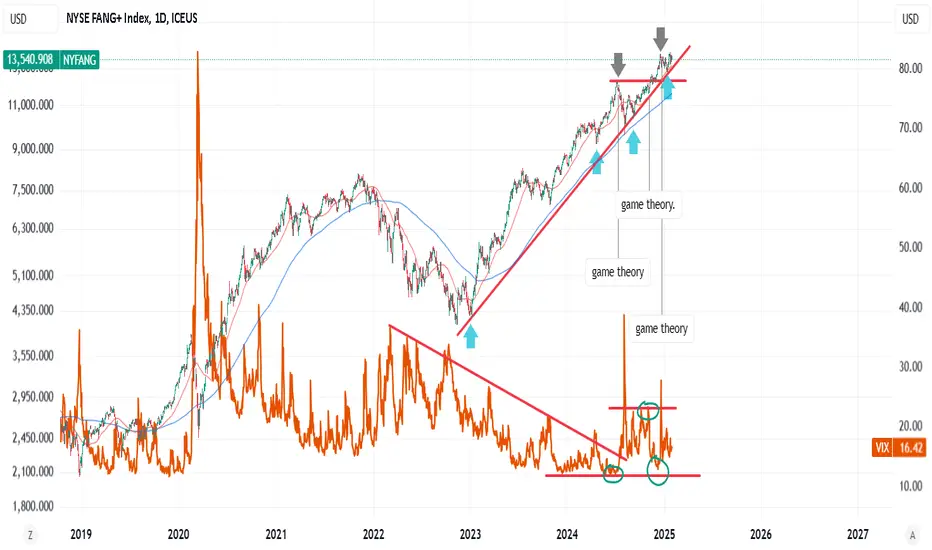
Practice: the higher something goes, potential narrows and risk increases. Deeper something falls, "potential" becomes attractive. Once market decides that it will fall -- people assume crash as possibility. People who can buy at a strong trend line - has benefit of having more information.
(1) Downtrending VIX highs and accumulating lows. a strong signal about SPX peak, with everyone expecting a market correction before US election. ---> GT in practice.
(2) pre-election. Markets be wobbly, pointing to 50-50 probability or risk. Maybe there was fear of NVDA/AAPL high valuations, or the fear due to Trump tariff policy (markets are 6m forward looking) as bond yields were rallying.
If we assume statistically, markets boom after elections. We can predict GT in action (or call it market forces). imo that still is a profitable risk.
People hate uncertainty and they love guarantees. So the "wobble" was reasonable.
(3) VIX higher low.. predictably (GT) sell off follows. Almost as by the book.
other way to put it? people maximize potential while minimize loses/risk. There are periods of volatile markets and periods for one directional rallies.
P.S. Blue arrows are longterm macd turning points.
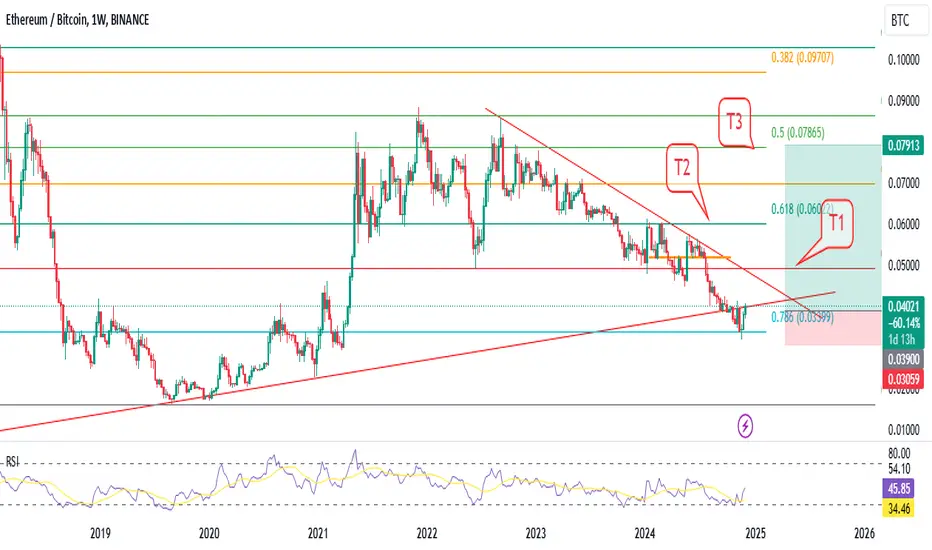
ETCBTC is showing UPTHRUST , it can give better return over BTCreletivly etherium can give better return over bitcoin from this level..
invest 5% of your capital
risk /reward is very good
confidence intrade - High
this is not a financial advoice , just for educational purposes .
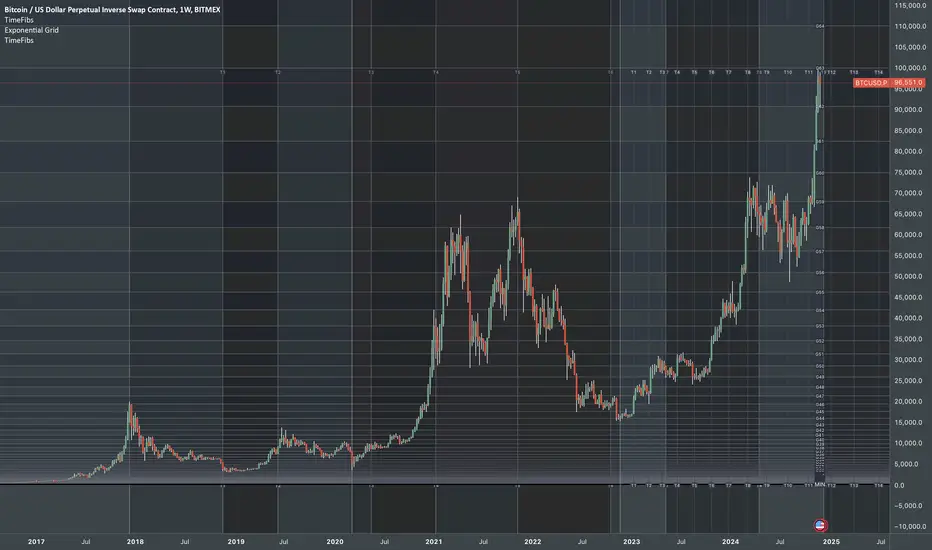
Reality & FibonacciParallels between Schrödinger’s wave function and Fibonacci ratios in financial markets
Just as the electron finds its position within the interference pattern, price respects Fibonacci levels due to their harmonic relationship with the market's fractal geometry.
Interference Pattern ⚖️ Fibonacci Ratios
In the double-slit experiment, particles including photons behave like a wave of probability, passing through slits and landing at specific points within the interference pattern . These points represent zones of higher probability where the electron is most likely to end up.
Interference Pattern (Schrodinger's Wave Function)
Similarly, Fractal-based Fibonacci ratios act as "nodes" or key zones where price is more likely to react.
Here’s the remarkable connection: the peaks and troughs of the interference pattern align with Fibonacci ratios, such as 0.236, 0.382, 0.618, 0.786. These ratios emerge naturally from the mathematics of the wave function, dividing the interference pattern into predictable zones. The ratios act as nodes of resonance, marking areas where probabilities are highest or lowest—mirroring how Fibonacci levels act in financial markets.
Application
In markets, price action often behaves like a wave of probabilities, oscillating between levels of support and resistance. Just as an electron in the interference pattern is more likely to land at specific points, price reacts at Fibonacci levels due to their harmonic relationship with the broader market structure.
This connection is why tools like Fibonacci retracements work so effectively:
Fibonacci ratios predict price levels just as they predict the high-probability zones in the wave function.
Timing: Market cycles follow wave-like behavior, with Fibonacci ratios dividing these cycles into phase zones.
Indicators used in illustrations:
Exponential Grid
Fibonacci Time Periods
Have you noticed Fibonacci ratios acting as critical levels in your trading? Share your insights in the comments below!
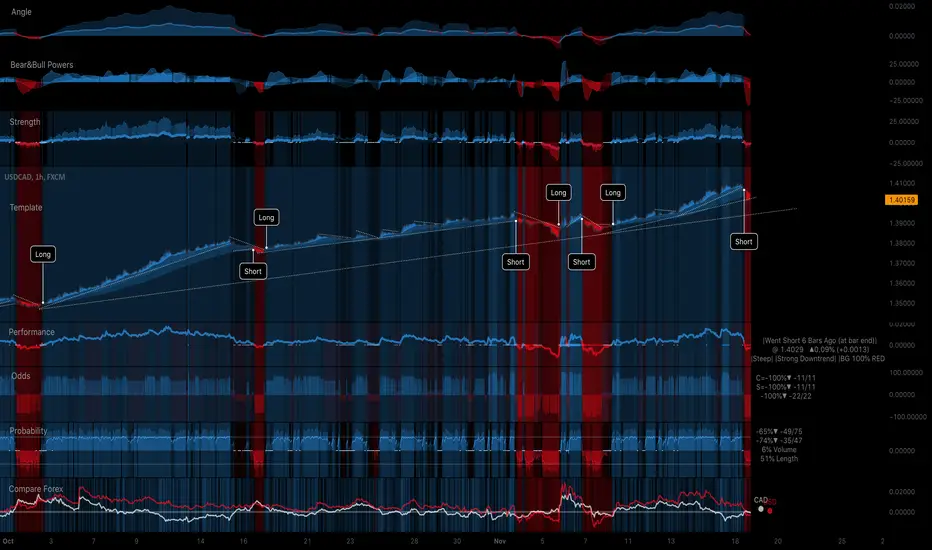
USDCAD H1 - Stress-Free Clear Charts.Stress-Free Clear Charts. (Required 10 years in R&D.)
In this layout, we see these indicators:
(From top to bottom of the screen)
-Angle: Shows the Angle of the Trend.
-Bear&Bull Powers: Displays who are in Power, the Bulls or the Bears.
-Strength: Shows the Strength of the Trend.
-Template: Always clearly shows the direction and precisely where to open and close (where to flip position). We open at the beginning of the Trend and stay in all the way till the end, stress-free. Turns perfectly.
-Performance: We see where to enter and close, the pullbacks and the performance.
-Odds: Shows the Odds everywhere.
-Probability: Shows the Probability all the way.
-Compare Forex: We see the performance of each currency of the Pair on chart. Each line is one currency. USD in Red. CAD in White. When the USD is above the CAD, the USDCAD pair goes up. And vice versa, when the USD is below the CAD, the USDCAD pair goes down. The background color displays the intensity of the trend.
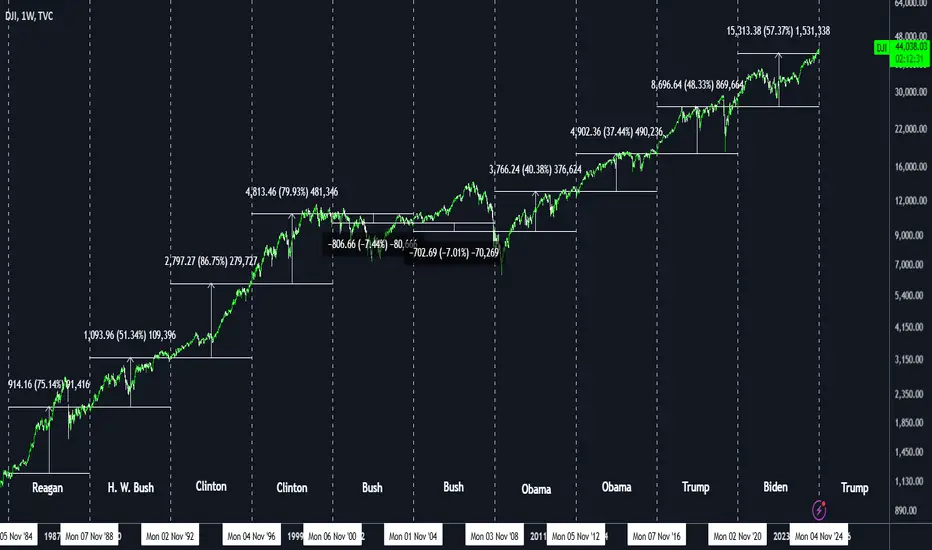
Election Year Cycle & Stock Market Returns - VisualisedIn this chart, we're analysing the open value of the week the US election took place and comparing it to the open of the following election, showing the gain (or loss) in value between each election cycle.
Historically we can see prices in the Dow Jones Industrials Index tend to appreciate the week the election is held. Only twice has the return between the cycles produced a negative return.
Buying stocks on election day, 8 out of 10 times has yielded a profitable return between the election cycles. 80% of the time in the past 40 years returning a profit, has so far been a good strategy to take.
The typical cycle starts with the election results, an immediate positive movement and continued growth before finishing positive.
The Outliers
2000-2004 was the only year which ended negative without prices going higher than the election day.
2004-2008 increased 41.84% before ending negative.
2008-2012 began the cycle falling 30.62% before finishing positive.
The names of presidents who won their respective elections is to visualise who had the presidential term during that specific cycle.
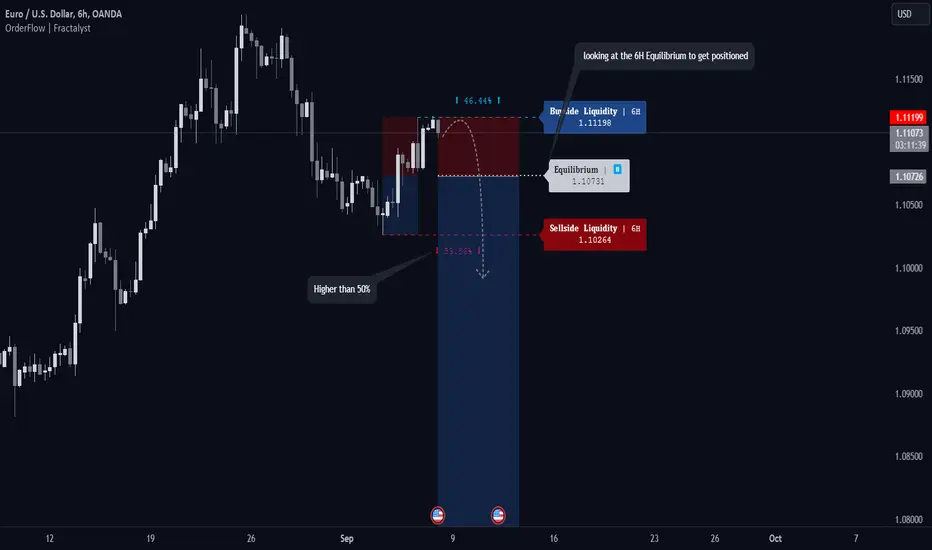
Probabilities in Play: Positioning for EURUSD ShortsEconomic Landscape
Eurozone Challenges
The Eurozone is experiencing sluggish growth, with some nations nearing recession.
Persistent inflation pressures the European Central Bank (ECB) to maintain tight monetary policy.
U.S. Economic Strength
The U.S. economy shows resilience, bolstered by strong job markets and consumer spending.
The Federal Reserve’s hawkish stance on interest rates supports a stronger dollar.
Geopolitical Factors
Ongoing geopolitical tensions, particularly in Eastern Europe, create uncertainty for the Euro.
Trade Idea
Given these fundamentals, my bearish outlook on EURUSD is supported by current global trends. I plan to utilize probability-based strategies to enter short positions. By analyzing key support and resistance levels, along with technical indicators, I aim to identify high-probability entry points for shorts.
Happy trading, and may the probabilities be in your favor!
1W:
6H:
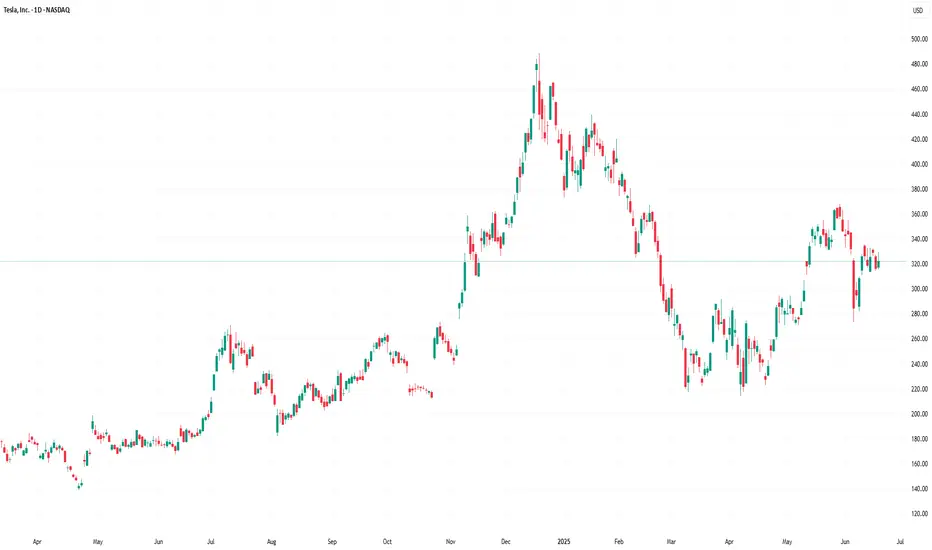
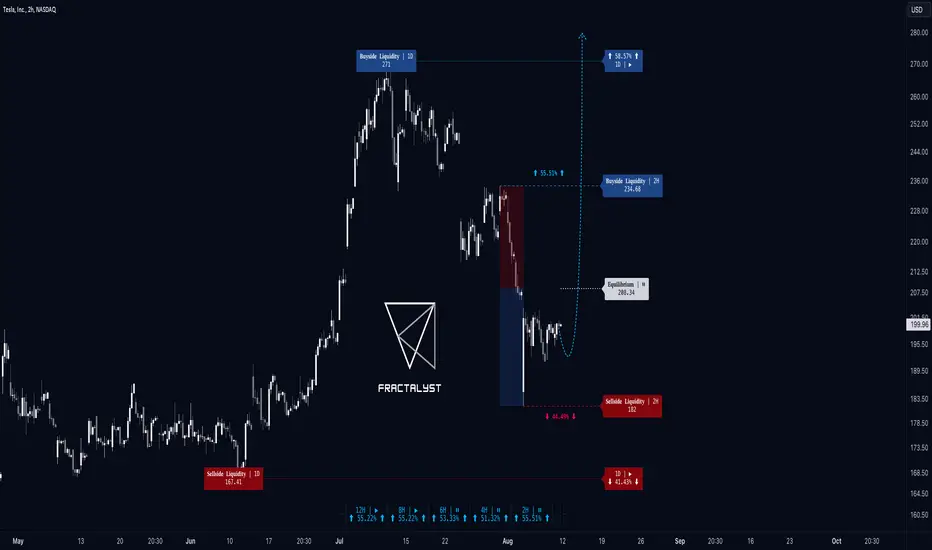
Why TSLA Could Be Set to Rise: Key News and a Great Entry SetupTesla (TSLA) is in the spotlight right now, and several factors suggest a potential bullish trend in the stock next week:
Strong Delivery Numbers: Tesla recently reported its Q2 2024 delivery figures, which exceeded many analysts' expectations. While the numbers were lower than last year's, they still indicate solid performance in a competitive EV market, with other automakers also experiencing growth.
Upcoming Earnings Report: Tesla is scheduled to announce its Q2 2024 earnings on Tuesday. Analysts are forecasting revenue slightly above last year’s figures, with net income expected around $1.72 billion. Investors will be particularly interested in updates about Tesla's robotaxi plans, which have been postponed to October. This anticipation could drive excitement and boost the stock price.
Market Recovery: Recently, TSLA experienced a drop of about 12.4% due to a global market sell-off. However, the stock has started to recover, and this volatility may present a buying opportunity, especially if the market stabilizes.
High Probability Setup: According to technical analysis, there is a high probability setup that has already formed, indicating a favorable entry point for bullish trades. This technical signal, combined with the positive news and upcoming events, enhances the likelihood of a price increase.
With these factors in play, including strong delivery numbers, an important earnings report, and a favorable technical setup, TSLA could see a bullish trend in the coming week. As always, be sure to conduct your own analysis and manage your risks before entering any trades.
6M:
3M:
1M:
2W:
1W:
3D:
2H: Entry
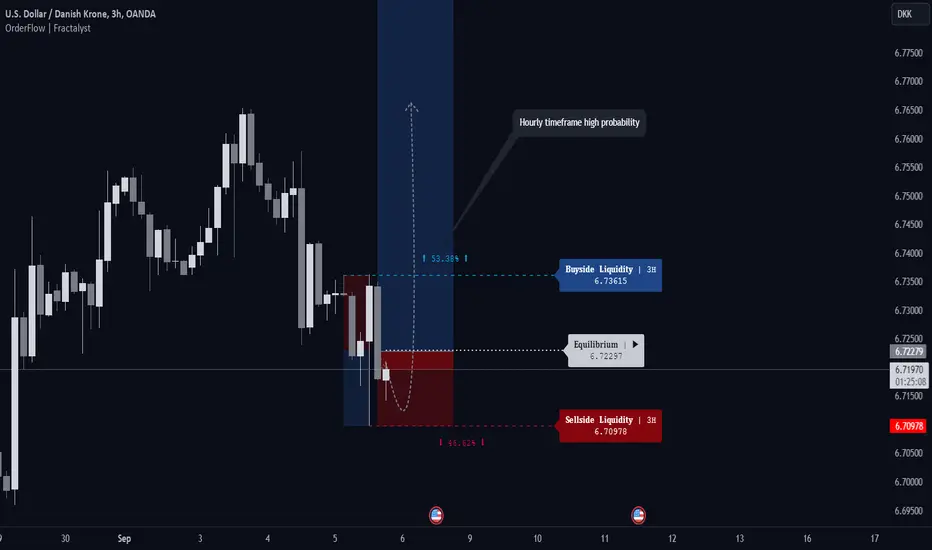
Trading with Confidence: Utilizing Probabilities in USD/DKKU.S. Economic Strength: The U.S. economy continues to demonstrate resilience, with robust job growth and steady GDP expansion. This economic strength supports a bullish outlook for the U.S. dollar against other currencies, including the Danish krone.
Interest Rate Differentials: The Federal Reserve's hawkish stance on maintaining higher interest rates to combat inflation contrasts with the more dovish approach of the Danish central bank. This interest rate disparity favors the USD over the DKK.
Global Uncertainty: Ongoing geopolitical tensions and economic uncertainties in various parts of the world are driving investors towards safe-haven currencies like the U.S. dollar, potentially boosting its value against the Danish krone.
Trading Strategy
To capitalize on this bullish bias for USD/DKK, I plan to utilize probability-based positioning for long entries.
By combining these fundamental factors with a probability-based entry strategy, I aim to position myself effectively for potential movements in the USD/DKK pair.
12M:
1W:
3H:
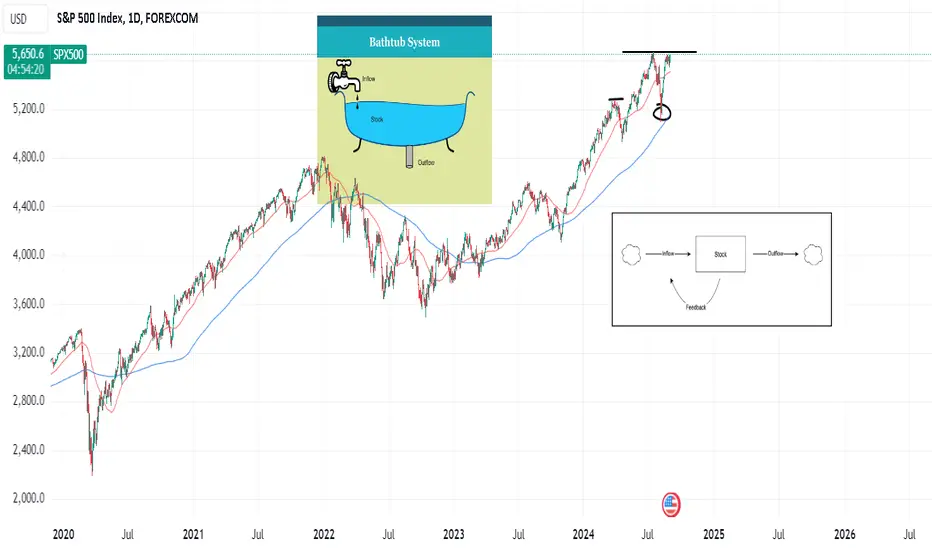
Stock feedback loopStock market is a adaptive system or a stock, with feedback loops (for inflow, outflow function). Where nobody knows the outcome or future, but feedbacks (corrections or resistance) gives tells (makes inflows or outflows). Without a common leader.
Economists think in models (price is the result of supply-demand, or inflow-outflow) that helps to explain system behavior (short term moves), but models are just ideas to explain complex world (models work until they dont). System thinkers study the stock not aggregate behavior .
Looking at markets trough perspective of "eco system" helps better understand the drivers or moving forces?
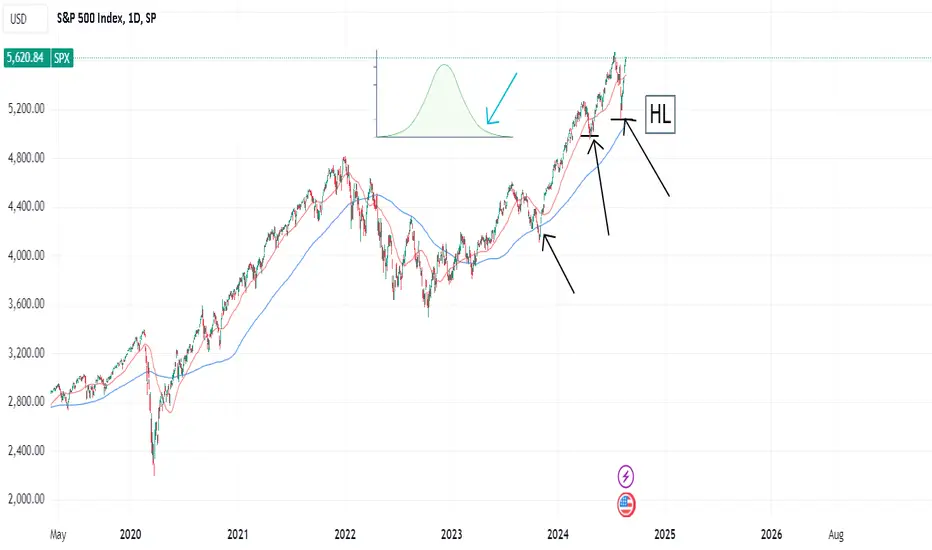
Buy using probabilityThe way probability distribution works is most common the result - higher the result on the bell curve and rare events are on the bottom of curve.
On strong markets, prices rarely ever sit still at pivotal levels like 200dma or high VIX.
Here we also saw higher lows, market only had two directions (crash or bull). If you know how markets work (or the drivers) this was a high probability entry.
Sometimes accumulating VIX points to pressure building up and steam is being taken out from markets?
"Prices are result of Supply-Demand dynamics". I would argue that big players benefit from buying low and defending peaks (as they got nothing to lose). would argue they lose by not buying low.
This is a theoretical idea to give you perspective on strategy?
How to win More Trades (Using Probability)I had a shit last 2 days so I am actually taking today off, I have some work to do on one of my cars so I am going to do that today.
This is also very important, taking a break when you aren't feeling that up to it.
But in this video we discuss probability and how probable any given scenario could be in your favor. If you aren't taking this into consideration you aren't doing what you are supposed to do.

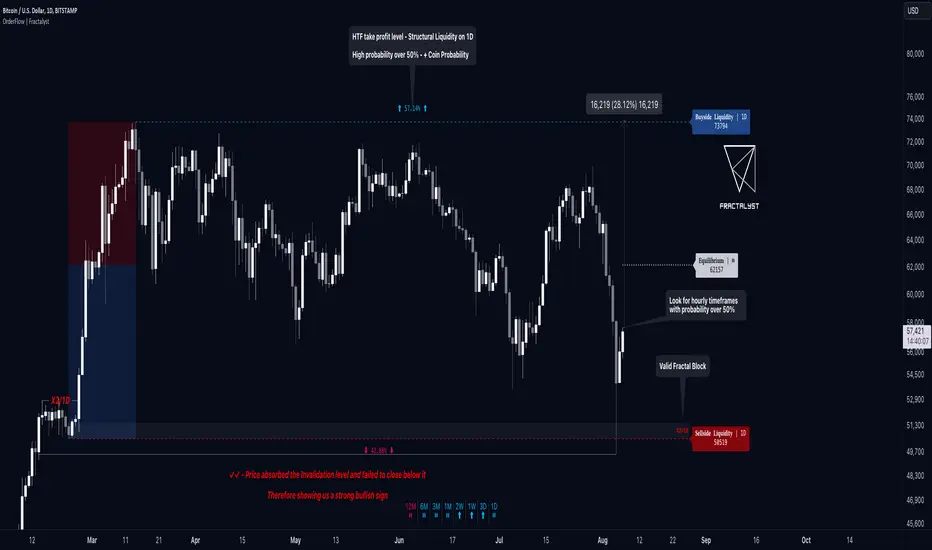
BTCUSD: The Rally Is Just Beginning, Probability Confirms6M: BITSTAMP:BTCUSD
3M: BITSTAMP:BTCUSD
1M: BITSTAMP:BTCUSD
2W: BITSTAMP:BTCUSD
1W: BITSTAMP:BTCUSD
3D: BITSTAMP:BTCUSD
1D: BITSTAMP:BTCUSD
If you have any questions, need further clarification, or would like to share your own insights, feel free to leave a comment below!
The information provided is for educational purposes only and should not be considered financial advice. Trading involves risk, and you may lose some or all of your investment. Always conduct your own research and consult a licensed financial advisor before making any trading decisions.
Think in Probabilities Embracing Uncertainty Your Key To SuccessPicture this: You’re at your trading desk, eyes on the charts, heart pounding as the market swings unpredictably. Do you feel that fear creeping in?
Now, imagine knowing that this unpredictability doesn’t have to scare you. Instead, it can be the key to your success. Let's dive into why thinking in probabilities and staying calm in the face of uncertainty can turn trading from a gamble into a calculated path to consistent success.
Many traders struggle with uncertainty because they lack a solid, tested system. Trading randomly or without a proven strategy leads to anxiety and inconsistency. But once you have a reliable system that suits your lifestyle and mindset, and you fully understand your edge, you realize that while the outcome of each trade is random, the probabilities of your trading system will work out for you over time.
The Role of Probabilities in Trading
Trading isn’t about predicting the next big market move; it’s about understanding the odds and working them to your advantage. Each trade is a small part of a larger statistical framework, where the focus shifts from individual outcomes to the bigger picture.
Why Is Learning To Think In Probabilities So Important For Trading Success?
Reduces Emotional Bias : By thinking in probabilities, you understand that each trade is just one in a series of many. This helps reduce emotional reactions to individual losses or gains, such as revenge trading, doubling up on position sizing, or even smashing your new iPhone against the wall (been there, LOL).
For example, if you know that your strategy wins 60% of the time, you won't be devastated by a single loss. You'll see it as part of the statistical outcome.
Encourages Rational Decision-Making: Knowing your strategy has an actual edge helps you stick to your plan, even during losing streaks, and avoid impulsive decisions. To know your edge, you need to do plenty of backtesting and forward testing so you can gain confidence in the system.
For instance, if you experience a string of losses, understanding that this is normal and statistically probable helps you remain disciplined and not deviate from your strategy.
Builds Confidence in Your System : Confidence comes from knowing your strategy is backtested and has a proven edge over a large number of trades.
This knowledge helps you stay disciplined and focused on executing your plan. For example, if your backtesting shows a positive expectancy over 1,000 trades, you can trust your system even when short-term results are unfavorable.
Things That Have Helped Me Over the Years to Deal With the Uncertainty of Trading
Finding or Developing a System/Strategy That Suits You : As humans, we are all different, and this is especially true in trading. Some people are happy to be in and out of the market fast (scalpers) and have the ability to make big decisions quickly under pressure.
Others are slower thinkers and like to make decisions carefully, staying in the market for a longer period of time (swing traders).
You need to find what you're best at and stick to it. If you have a busy life with work and family, maybe swing trading suits you. If you’re younger and not as busy, then perhaps scalping is your style.
Playing Strategy Games and Games of Chance : This may not be something you've heard before, but I've met many traders, including myself, who have found that games like poker can really help your trading by teaching you to think in probabilities.
Another game I love to play is chess, as it encourages you to think ahead, and I’ve found it has helped me in my trading over the years.
Practicing Visualization : If you've ever read anything on the subconscious mind, you know it’s responsible for 95% of all your automatic behaviors, especially in trading. The subconscious doesn’t distinguish between what is real and what is imagined.
This is why visualization is such a powerful tool to help you embrace market uncertainty. By visualizing yourself placing trades confidently, managing risks well, and handling outcomes calmly, you prepare your mind for real trading scenarios.
This mental practice reinforces your belief in your system and prepares you for the market's ups and downs.
Books That Helped Me Think in Probabilities
Reading has been an invaluable part of my journey to understanding probabilities. Here are some books that have profoundly impacted my trading mindset:
"Thinking, Fast and Slow" by Daniel Kahneman
This book helped me understand how cognitive biases affect decision-making and how to overcome them by thinking more strategically.
"Fooled by Randomness" by Nassim Nicholas Taleb
Taleb's insights into the role of chance and randomness in our lives and the markets were eye-opening and changed how I view risk and probability.
"Beat the Dealer" by Edward O. Thorp
Although this book is about blackjack, Thorp’s exploration of probability and statistics offers valuable lessons for trading.
"The Theory of Poker" by David Sklansky
Sklansky breaks down the mathematics of poker, showing how to make decisions based on probability, a skill directly applicable to trading.
"The Intelligent Investor" by Benjamin Graham
This classic on value investing emphasizes the importance of long-term thinking and understanding market probabilities.
"A Man for All Markets" by Edward O. Thorp
This autobiography offers a fascinating look at how Thorp applied probability theory to beat the casino and the stock market.
"Sapiens: A Brief History of Humankind" by Yuval Noah Harari
Harari’s book provides context on human behavior and decision-making, offering insights into the psychological elements of trading.
"The Signal and the Noise" by Nate Silver
Silver’s exploration of how we can better understand predictions and probabilities is highly relevant to making informed trading decisions.
"Superforecasting: The Art and Science of Prediction" by Philip E. Tetlock and Dan M. Gardner
This book teaches how to improve forecasting skills through careful analysis and thinking in probabilities.
Thinking in probabilities was a game-changer for me. It shifted my focus from trying to predict every market move to playing the long game. By embracing this mindset, I turned fear into confidence and uncertainty into strategy.
Remember, trading isn’t about guessing the market. It’s about responding with a clear, composed mind. Trust your strategy, know your edge, and let the probabilities work in your favor. This approach transformed my trading journey, and it can do the same for you. Happy trading!

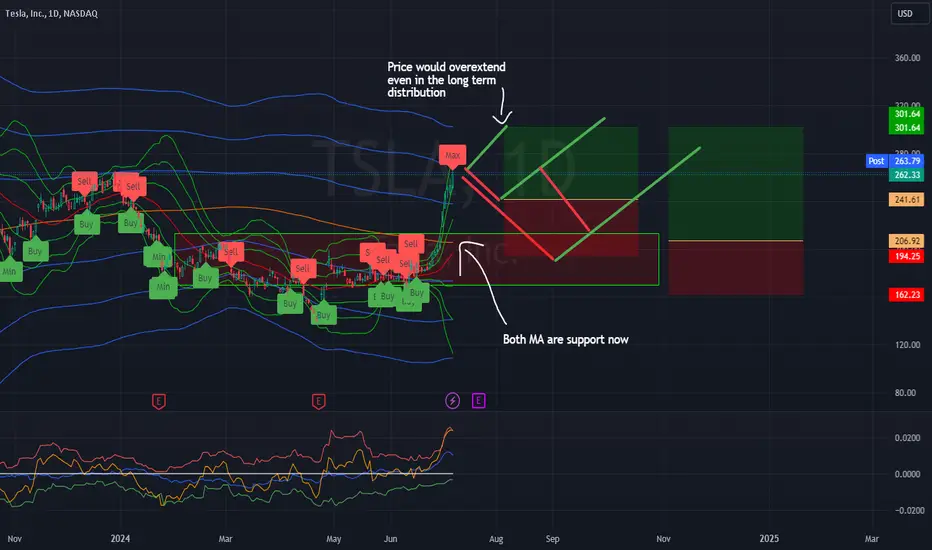
Maximum Hypothesis TestI still believe Tesla is a great company with a lot of future ahead. However, seeing how aggressive price action has been lately, it would be wise to consider taking some profits. This would allow for the trade to keep going, and the previous winning trades will have room to grow into strong investments. It's unlikely that price will continue to uptrend in this manner, but it's great to finally see some life signs out of this company. I'm sure their future will be bright, but as of now we must stay realistic and expect price to uptrend in a normal manner and not in a bubble like form.
I believe it would be best to lay back and wait for more buying opportunities and look to dollar cost average the dip. If price does keep increasing then the unliquidated stocks should keep capturing returns and if it drops then dollar cost averaging would create a great scenario for catching a possible long term uptrend.
Why $EU is Melting Down and Here's How You Can Capitalize on It12M: OANDA:EURUSD
6M: OANDA:EURUSD
3M: OANDA:EURUSD
1M: OANDA:EURUSD
2W: OANDA:EURUSD
1W: OANDA:EURUSD
2H: OANDA:EURUSD
If you have any questions, need further clarification, or would like to share your own insights, please feel free to leave a comment below.

Does Fibonacci Really Work?It's hard to understand how the Fibonacci sequence presents itself in price action. I remember I used to think it was nothing more than lines drawn in a chart in a fancy manner. However, as I began to learn about probability distributions, I began to understand where the sequence reared its head into price action. Although I don't fully comprehend the theory behind the Fibonacci retracement, I did find a mathematical demonstration that proves price action and this sequence are related. You can find the demonstration in the link below. I'm unsure, but I believe this is peer-reviewed.
www.researchgate.net
However, you will notice that this approach is extremely different to the Fibonacci retracement. They look nothing alike. However, it's an interesting concept which could Shead light into understanding the fractal that governs price action. One of which is the Sierpinski triangle
So does the Fibonacci retracement actually work? Well I don't know, but there is only one way to find out, so lets try it

Odds and Psychology.Based on "Think fast and slow", people have two system thinking. System-1 is autonomous, always working in background (ie unconsciousness), lazy, intuitive, fast, has stereotypes. System-2 is rational, hard problem solving, takes effort and energy, cuts trough the BS, etc (ie consciousness).
Based on another book called "superforcasters" and some dude I forgot his name, best approach for odds is to have simple system; where 100% certain. 93% almost certain. 75% probable. 50% about even (or maybe). 25% probably not. 7% almost certainly not. 0% impossible. All forecast are subjective guesses.
The catch; If you think something is 100% - you would go allin with max lever. (If you dont) your beliefs or opinion go against your actions. If you dont believe it's wise to go allin - then odds are not actually 100%. If you are stressed about 93% spot, then maybe it might not be 93% after all. (1:14).
In key SPX areas, based on business cycle and TNX, logic says one odds (or System-2) and your intuition (or feel) says differently. You are either too bearish or too bullish.
This is a simple representation of concept.
Another key concept is that TIME <----> PROBABILITY are at opposite sides of coin. The closer or far away in time something - more or less risk, ie higher or lower probability.
