Handling losses like a pro!Hey traders,
Ever wondered how some of the professional traders can lose tens of thousands of dollars and still not be phased? Well, today I am going to chat about how and why they have the ability to remain consistent and trust the process, and how you can do the same.
Enjoy!
Professional

The News Just Serves To ConfuseI have been a trader for a very long time, so listen as I spit some facts.
News is worse than a distraction, it ACTIVELY inhibits you from making good decisions.
You have TradingView at your fingertips and it contains all the information you need, in a package so advanced it's frightening. STICK TO PRICE ACTION! I will say this again at the end.
I am 100% certain that I only started to be successful after I stopped DIRECTIONAL trading based on news. Of course, I know the broad mass of what's going on in the markets and which news events may have an effect. I haven't stopped listening to and reading the news, but I HAVE started to see it all differently.
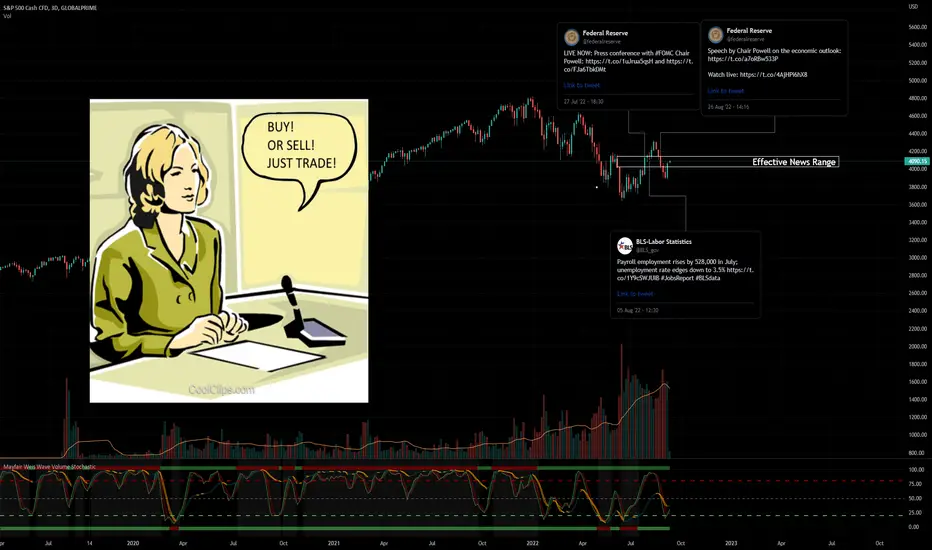
You can see from the chart that all the recent "Shock News" has no real impact unless you are a day trader. rate decision, statements, unemployment, blah blah....
I am not saying that news is not important, I'm saying that you need to translate it and to be aware of why it is written. This probably sounds like a weird thing to say, but hear me out.
Do a memory check with me.
When was the last time that the news was all positive about bitcoin?
Answer: At the top and on the way down, when the big boys were selling it to naïve retail (like you, probably).
Now we are at the bottom, all the news is negative on BTC. I wonder why? (HINT: They want you to panic out so they can buy.)
There are three possible reasons for this.
1. The writers are dumb. They are part of the retail crowd themselves and are therefore subject to the same impulses, fears and hopes. They get carried away when things are pumping, and drop into despair when the markets plunge.
2. The whole industry is driven by the big firms, who obviously want to make as much money as they can. Retail traders are, on average, so bad at trading that brokers don't even put their trades into the market, preferring to risk taking the other side themselves. 75% of retail traders lose money. 90% of retail traders will lose 90% of their first trading account in the first 90 days. If I were a broker I would take the other side of those odds, thanks. All I have to do now is make people trade as much as possible. I get commission, and I probably get their stake as well. How to make people trade as much as possible? PUMP OUT NEWS THAT TRIGGERS TRADING.
3. A combination of 1 and 2. The financial industry, from megabanks through to news services, gurus and brokers, is set up to excite people about trading as much as possible. There is constant pressure to provide reasons why oil rose 5% or SP500 dropped 8% etc etc, and even on slow weeks the sheer amount of stories that are published is mind-blowing. The writers are unlikely to be traders themselves, and they just pump out stories based on what happened yesterday and what MIGHT happen today. It is all designed as a massive call to action that is constant, and traders just like you open (and close) positions based on "market analyst" pieces written by economists and professional analysts employed by the brokers.
Are you beginning to see how it all fits together?
The industry LOVES a day trader most of all, because they lose their stake the fastest, so day trading is promoted as exciting. After all, it IS exciting. Trading gives you a buzz. It's addictive, possibly more so than gambling. It is gambling after all, only slightly different, and if you trade like a gambler, you lose in the end.
So, how do I look at news?
1. If trading short-timeframe, I am aware of figures that are due this week, and avoid holding a position coming up to an announcement, and for a while afterwards.
2. If trading medium- to long-term, I remember that the non-farm payrolls may move the market a few percent sometimes, but when you zoom out you can barely see the effect. As a result most of my trading is swing trading.
3. I regard it as a reverse indicator if anything. It never ceases to amaze me when I am thinking about taking a long in, say, Gold, and then an email hits my inbox containing a bearish Gold story. I don't think I am becoming QAnon but I do think these stories can easily be planted by the big players. What journalist doesn't want to write a story after they interview some "master of the universe" trader from GS or JPM or wherever. Or maybe the boss says "write a Gold story today", so they call up their contact who trades it for a bank. Same effect. The banks are in buy mode, and they need retail to sell it to them.
If this sounds like I think the whole thing is a colossal rigged casino, then I am getting my point across. News is just a part of the effort to separate you from your cash, but it's doing a great job.
So, what to do?
1. Trade on Price Action only.
2. Be aware of news in case it affects a trade you may place or one that you have on,
3. Understand that nearly all news is designed to make you panic in or out of a trade, and regard it VERY cynically. It can be hard to remain calm in the face of a negative headline, but that's what a good pro trader will do. Currently I am long BTC, despite huge negative headlines.
Once again, repeat after me:
You have TradingView at your fingertips and it contains all the information you need, in a package so advanced it's frightening. STICK TO PRICE ACTION!
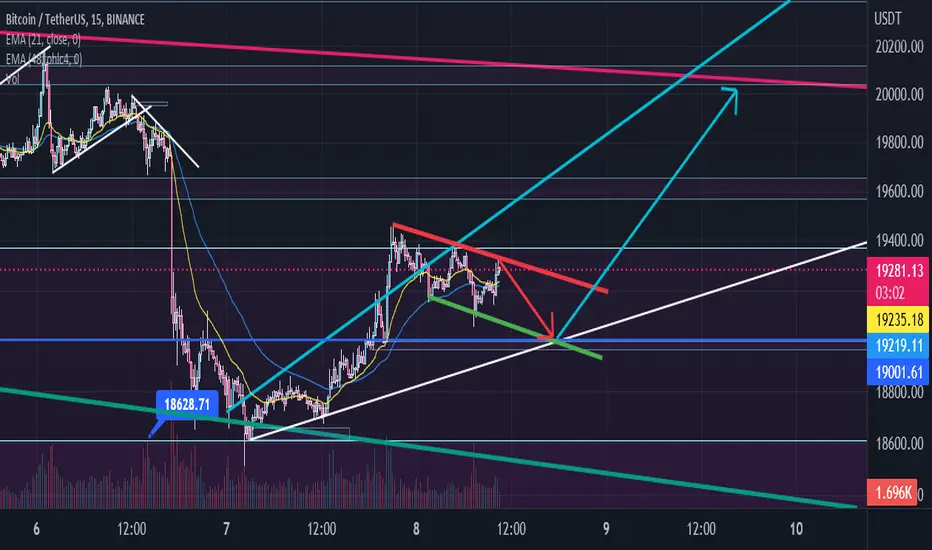
#btc analysis high hand concept🔥hi there I wish the best 4 you guys.
possible movement for bitcoin as a pro perspective.
cheers 🥂 .
DXY price action analysis 4 pro's 🔥hi there guys I wish you the best for you.
in this chart we have the most coronation to the key level areas base on the pros perspective.
cheers 🥂.

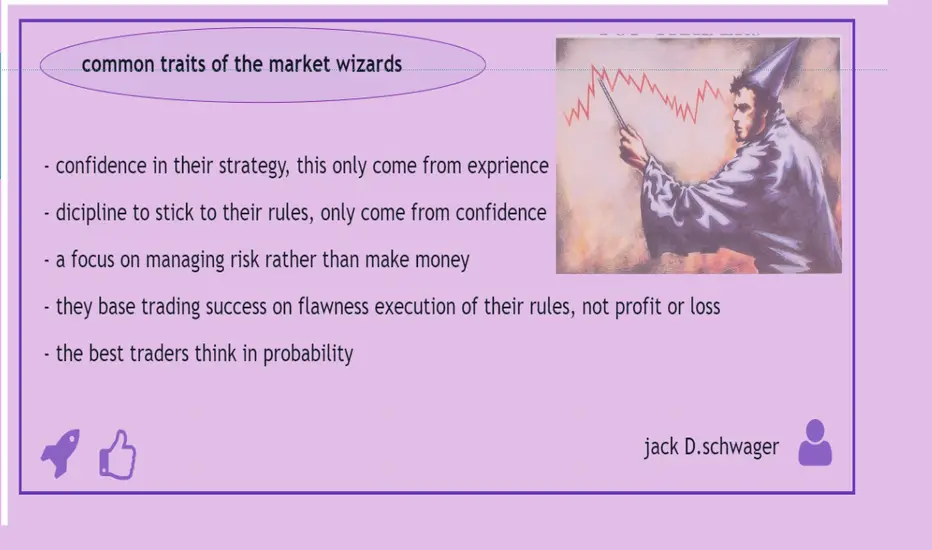
how to be profitable like #wizard markethello guys
what do you add to above items?
DO YOU AGREE OR NOT?
do you becaome professional trader?
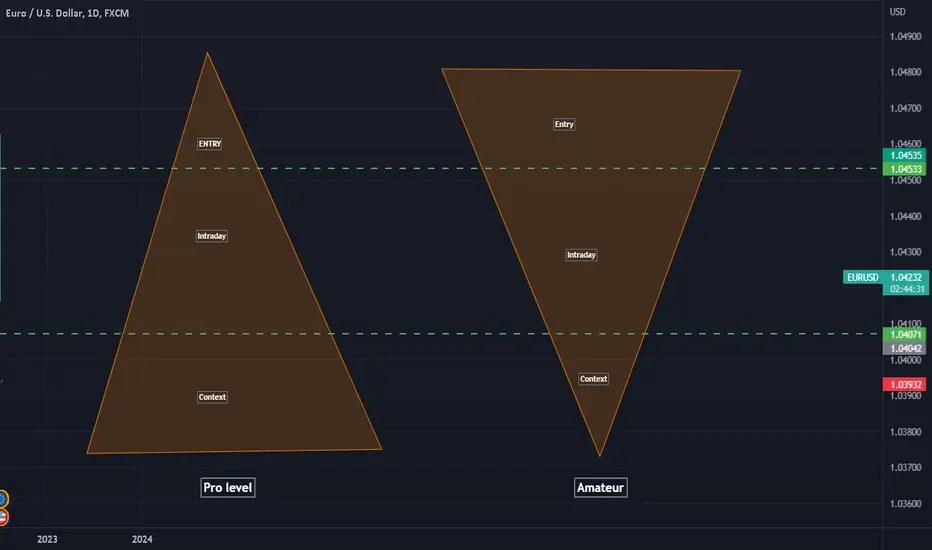
Pro vs AmateurIn trading especially in retail trading we have a massive focus on entries and very little focus on the context behind the trade, we focus alot on things such as indicators, or the perfect candle set up, but we have very little look into the context, so the fundamentals or catalysts behind the move in the first place, we tend to overlook this and focus purely on probability which can take its toll on your account balance.
Whereas in a professional environment they do things very differently with a major focus on the context behind the trades, and why price is going to move a certain a way, and the entry itself is actually a lot smaller part of how and why they trade, it is more the icing on the cake.
So the takeaway is to realise that in a professional environment the focus is less on the indicators and moving averages ect, and more on the reasoning, so to align ourselves closer to professional trading we need to make sure there is always context behind our decision making, in the long term this is how to become consistently profitable.
An interesting way to look at this, is to view the forex market like any other market in the world! it is merely a buying and selling exchange, so would you believe that anywhere else in the world for example the housing market, would a high end property developer be waiting for RSI indicator to be below 30 before buying houses? or would they wait for context like rising interest rates or declining interest rates?
Would they be waiting to see if demand or supply increased before making these high end decisions? so why as a trader should our trading be any different? we need to find value and opportunity!
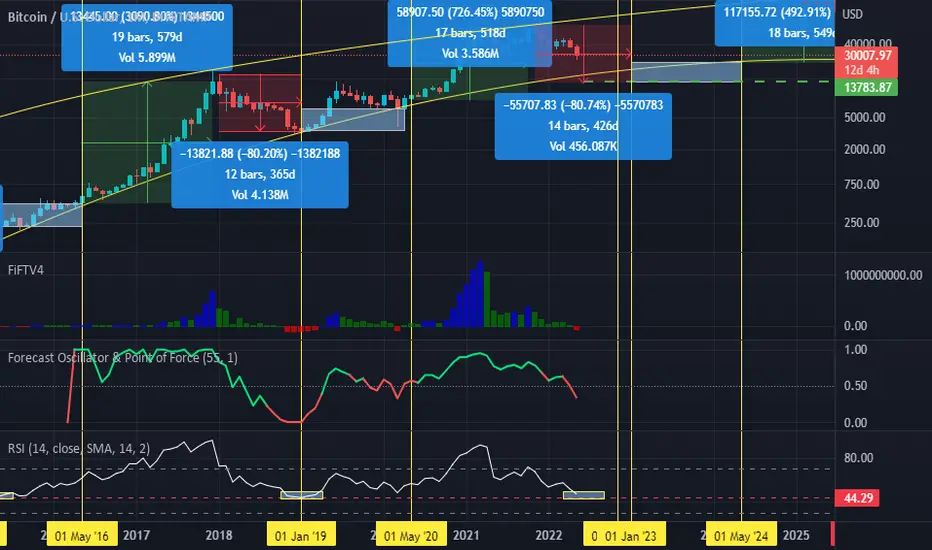
A highly professional analysis of BitcoinThe 2-year long-term trend of #Bitcoin until 2024 and the possibility of a drop to $ 14,000 in #November and #December 2022 and then the end of the fall and the beginning of the 2-year wave of growth.
BTCUSD - my setup all my strategy.
needs 3 touches a key level
I trading only 3 touch
I used volume
DOM
And I pray to God.

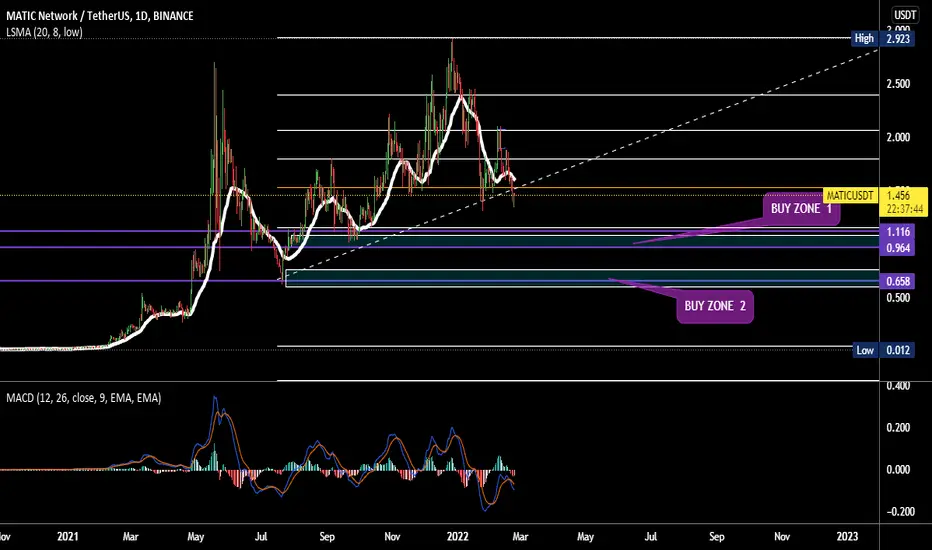
POLYGON MATIC : DON'T BUY UNLESS IT TOUCHS THIS AREA hello guys for this little analysis i made i used the fib retracement this is for long term holding not for scalping i used the one day frame as you can see the price is at the golden area 0.6 . it mean the price already lost 60% from the last ath ; it a very good entry point but the market is still messy no one knows where we're heading . i also used the rsi and the macd and they both show that the price will potentially stil go down to the support that i marked with the callout note . so please be cautious and in my opinion i think matic wil be the next 2022 coin that pumps . i have marked two entry points use only 50 percent of your capital and good luck if you want to add something or ask or comment or criticise please be my guest im all ears .
trade on your own risks
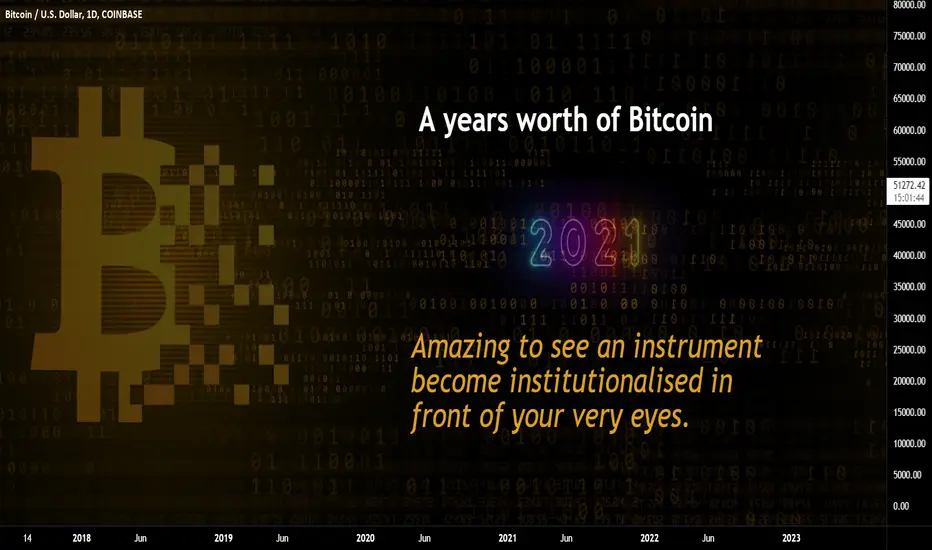
A year in the life of BitcoinAs a professional trader, I have been lucky enough to have been buying Bitcoin since 2011. Here's a post showing what I have seen this last year, which to be fair has been amazing to see first hand.
I remember the buzz of trading penny stocks 20 years ago and crypto seems to have brought that excitement back for many! However, for Bitcoin this year has been proof of the institutional players joining the club. Which is not always as it seems - many retail assume more big players in and the price only moves up.
Here's a view from the last year;
December 2020; (click image for post)
For the first time you where able to see decent correlation with Bitcoin and other instruments pitted against the Dollar. Which meant it was beginning to be taken seriously by the powers that be. The reason I give some history above was to explain that during the 2017 rally, you could see the move was hype rather than large volume from "fund type investors". As a VC investor in technologies around Cyber, AI and Blockchain looking back at that period you could clearly see that it was in the transition period. Many blockchain projects where being invested in by other VC's on one pre-condition. Where the price of Bitcoin was on the day or during the week. If it was up, they would sign a deal, if it was down they would walk away. It was a time of uncertainty for old school money.
Post the drop and run from early 2018 through to 2019. Other projects came to fruition that meant even in the investment world it moved from Technology focused to financial capability driven. By this I mean, when investment came to blockchain prior to 2018 it was a technology investment (although yes it still is today) you need to understand the operators in the investment world. Beyond venture capital you have other entities and these often have even more diversified portfolio's - they include Private Equity, Hedge funds, Family offices and several others. Unlike VC's who have a focus (more often than not) these are what a venture capital fund is often made up of. It's these guys putting the cash into the funds, they also invest in properties and other such investments. Enter the Funds and ETF's in particular.
In chart terms this could be seen as Re-accumulation; although the earlier adopters (myself included) where in the instrument before the MEGA players came to town. Click the image for the post **
This was posted in January this year showing the forecasted targets to the next level.
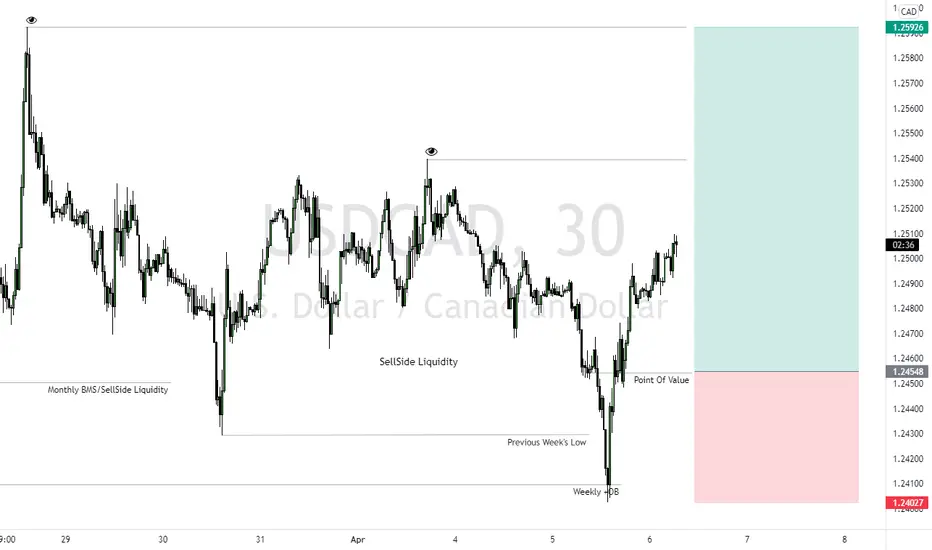
In February I posted an article about the value area;
The value area proved to be very accurate and therefor the justification of the MEGA players starting to take some control of the instrument.
As I saw the psychology of the retail play into the hands of these tactics, every day become more fascinating to watch key levels being used and the retail crowd being controlled and herded like cattle into the waves. I covered some of this in a psychology based post again in March - click link through for post.
This literally was merriment of a technology becoming a real world asset!
As you can see here - this solidified the professional & strong hands not only operating in the space, but controlling it.
This next one - most of my followers know me for. This is where the masses where shouting "accumulation" Again, as clear as day the signs where written and mapped out.
Here's the AFTER image.
So as you are starting to see, it's now playing by the rules - all of this in front of my eyes.
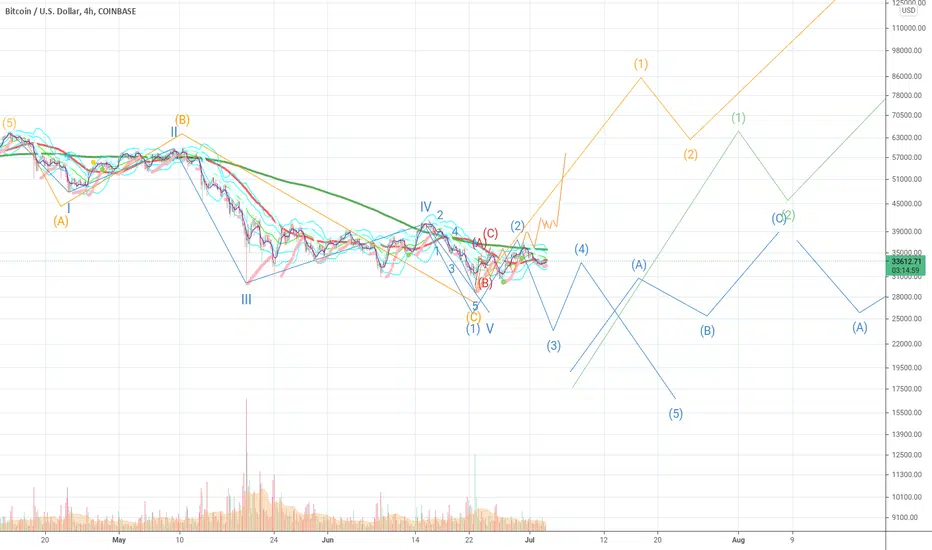
Later in March I wrote out a full on Roadmap; Click image
I covered here the logic for the waves.
And obviously;
In May this year I covered the basics of Wyckoff and why the Rocket call and the Roadmap where viable options. This was featured as an editor's pick by @TradingView
In April; I posted about the Grayscale discount rates.
With Grayscale, Wyckoff and the Elliott situation, we ultimately saw the drop from the previous ATH and the retail crowd had Billions wiped off their positions in a very short period.
In June I was talking about the emotional analysis and why these types of tools work so well.
July - Highlighting the lack of common sense;
August - Why it's not a simple line.
Yes that's a drawing not an image ;-)
End of August - the pullback for the long position up to the new ATH.
September was "what we are going to need for mass adoption"
Even covered some insight to Dark Pools;
Fast foreword a couple of months and we could forecast the monthly 3 situation in terms of Elliott Wave;
The above was the 30th of September into a new high (grey top level) covering clusters below;
October - highlighted the retail sentiment.
Fuelled by this guy;
I had a ton of people come and say "he's not wrong" forgetting he called 92k in April. Retail seeing what they wanted to see and not what's in front of them.
On the 10th of November we saw the September level being used as clear resistance.
In November I talked through the money flow and the COT situation currently;
See link to post in related ideas.
As a professional trader of over 20 years and an active VC investor I am overall Bullish Bitcoin, I do however have one slight hesitation. Mainly to do with the Governments and people in control of the financial systems globally. I covered this in another post - Now I am not saying it's what it is, I am saying "What if"...
So here's the year of Bitcoin posts, running commentary and some education in between.
Disclaimer
This idea does not constitute as financial advice. It is for educational purposes only, our principle trader has over 20 years’ experience in stocks, ETF’s, and Forex. Hence each trade setup might have different hold times, entry or exit conditions, and will vary from the post/idea shared here. You can use the information from this post to make your own trading plan for the instrument discussed. Trading carries a risk; a high percentage of retail traders lose money. Please keep this in mind when entering any trade. Stay safe.
Choose your Destiny
Bitcoin is at a crossroad, but which path will it take? This will depend on you. Which will we see first, 10k? Or 100k?
I know I know, we want 10k so we can enter with minuscule risk and 10x our bags when we cross 100k, but that would be too easy.zzzz. Or would it? Would you buy a bloody Bitcoin that just crashed 50% from 32k to 16k? Easy yes you say? 50% discount easy to buy you say?
Then I suppose you would jump at the opportunity to buy a bloody Bitcoin that just crashed 50% from 64k to 32k? I suppose you already have.
Gold path is Wyckoff accumulation pattern, which seems is being followed pretty picturesque for now. green extended time frame, blue is most bearish sideways possibility
All paths lead to the same outcome, which is Bitcoin souring beyond 100k, only question is when.
We seem to have finished wave 5 down of the bearish impulse from 64k, but could still be in for an extended 5 (in blue on the chart)
It seems unlikely that we will go lower as this area has held for two months now with all the short pressure, but it’s possible we see an extended 5 wave down as far as 18k, I was looking at the 12k area a few months ago, but 30k, and especially under, has been bought aggressively so I’m leaning cautiously bullish towards 55k before a pullback that would likely bottom around 43k, which will have become our new support once we cross that magic number again.
Choose your destiny
Let me know in the comments; which path will you choose?
Professional entertainer, private investment management. DYOR, NFA. (If you don't know what those acronyms stand for, refer to the first acronym)
-Dharma Cat Pro
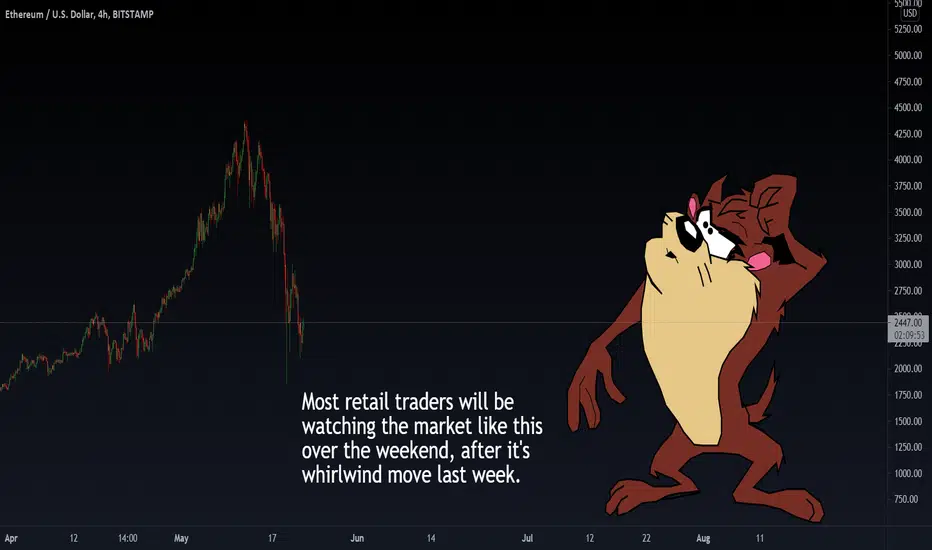
You little DevilI posted a quick update stream this morning for ETH & XRP. Yesterday we covered BTC in a bit more depth.
Here's the link to the stream tradingview.sweetlogin.com
Ok so breaking down the basics, we had an Elliott count making this move a major 3 and having a deep correction.
If you watch the stream - you will see the XRP and ETH correlation to each other and to BTC.
There is an area of concern for me, that would suggest either an ugly move up or we are still in the phase 3-4.
Take a look at this stochastic on the weekly timeframe - there is room for a drop to continue, even if it's not deeper. It's not impulsive to the upside yet either.
In the Total chart there are also some regions and levels of interest for me. Take a look at this one;
Given the correlation and lag on BTC - it is no surprise that most retail traders would have had this feeling over the last 7 days.
The dominance on the other.D is another interesting view.
We were navigating the move down using a combination of Elliott and Wyckoff and this move played out near enough textbook.
Here's a post on the wyckoff basics features recently here on TradingView;
Disclaimer
This idea does not constitute as financial advice. It is for educational purposes only, our principle trader has over 20 years’ experience in stocks, ETF’s, and Forex. Hence each trade setup might have different hold times, entry or exit conditions, and will vary from the post/idea shared here. You can use the information from this post to make your own trading plan for the instrument discussed. Trading carries a risk; a high percentage of retail traders lose money. Please keep this in mind when entering any trade. Stay safe.
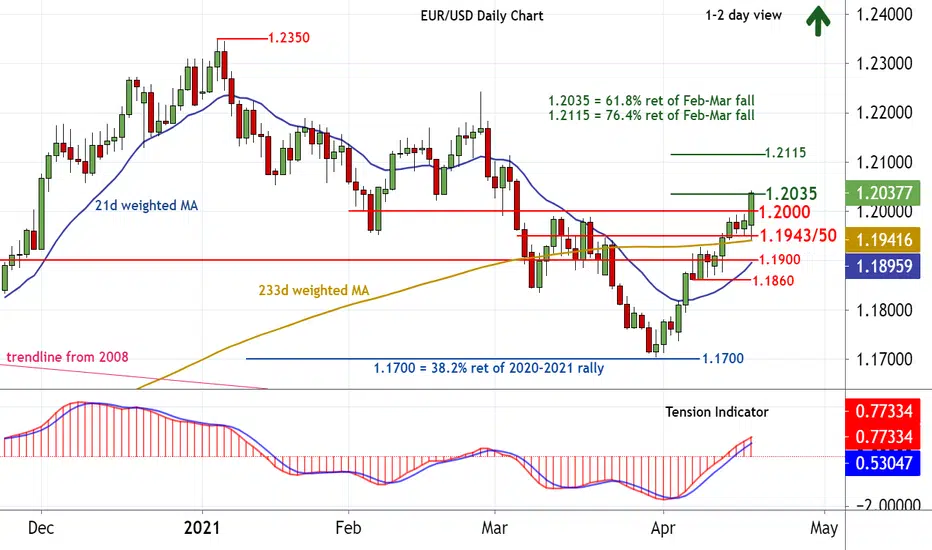
EUR/USD: Extending March gainsConsolidation around 1.2000 has given way to the anticipated break higher, with rising intraday studies prompting a break to the 1.2035 Fibonacci retracement. Daily readings are also positive, and weekly charts continue to improve, highlighting a more robust tone and extension of March gains towards the 1.2115 retracement. Meanwhile, support is raised to congestion around 1.2000 and should underpin any immediate setbacks. A close beneath here, however, would turn sentiment Neutral and put prices back into consolidation above 1.1943/50.
GBPAUD- Bearish Scenario #2Hello fellow traders; time for another analysis w/ SmoothPips
🙏 If you enjoy the analysis please make sure to leave a like and follow; so we can catch these pips together!
❓ What's unique about SmoothFX?
-All trades executed off of the same "strategy"
-Easy to read charts
-Multi Time Frame Analysis
-Learn and Earn experience
-Very high probability
-Experienced
🎯Leave some feedback & let's chat. Always willing to hear other bias'.
📌Remember; markets are moved through liquidity. We will earn more by helping each other.
🤞Please remember not every analysis will be 100% correct. Use your own due dill & discover your own research.
Sincerely,
SmoothPips
<3
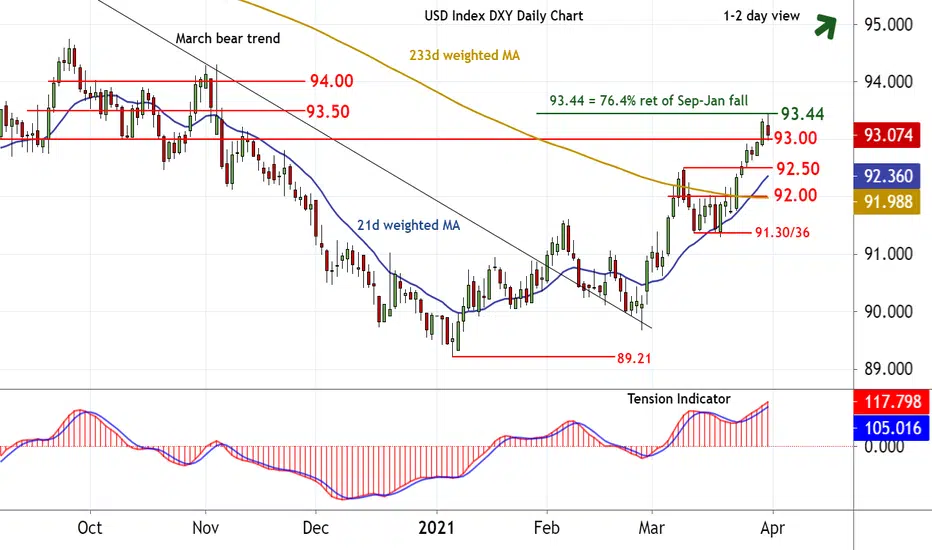
USD Index DXY: Possible pullback before prices continue higherThe test of the 93.44 Fibonacci retracement and congestion around 93.50 is giving way to a short-term pullback, whilst intraday studies track lower and overbought daily stochastics turn down. Congestion support at 93.00 is under pressure, but the rising Tension Indicator and improving weekly charts should limit any break to fresh consolidation above 92.50. Following corrective trade, fresh gains are looked for, with a later close above 93.44/50 confirming continuation of January gains towards 94.00.
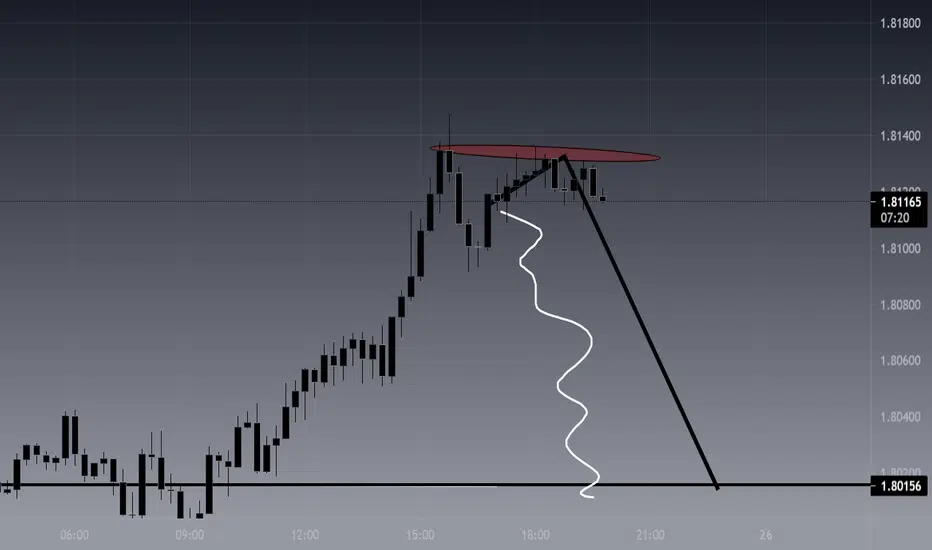
GBPJPY- Hammer Time! *McHammer Voice*
Hello fellow traders; time for another analysis w/ SmoothPips
🙏 If you enjoy the analysis please make sure to leave a like and follow; so we can catch these pips together!
❓ What's unique about SmoothFX?
-All trades executed off of the same "strategy"
-Easy to read charts
-Multi Time Frame Analysis
-Learn and Earn experience
-Very high probability
-Experienced
🎯Leave some feedback & let's chat. Always willing to hear other bias'.
📌Remember; markets are moved through liquidity. We will earn more by helping each other.
🤞Please remember not every analysis will be 100% correct. Use your own due dill & discover your own research.
Sincerely,
SmoothPips
<3
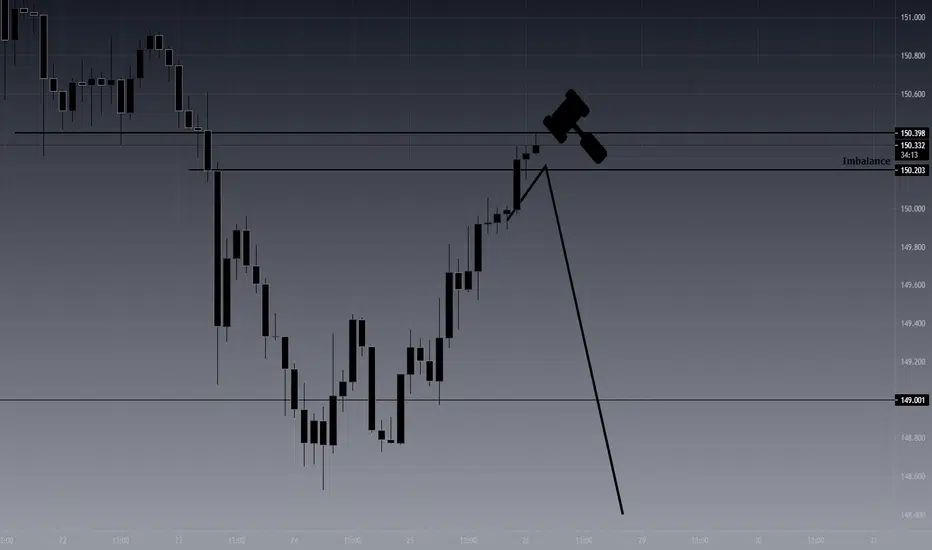
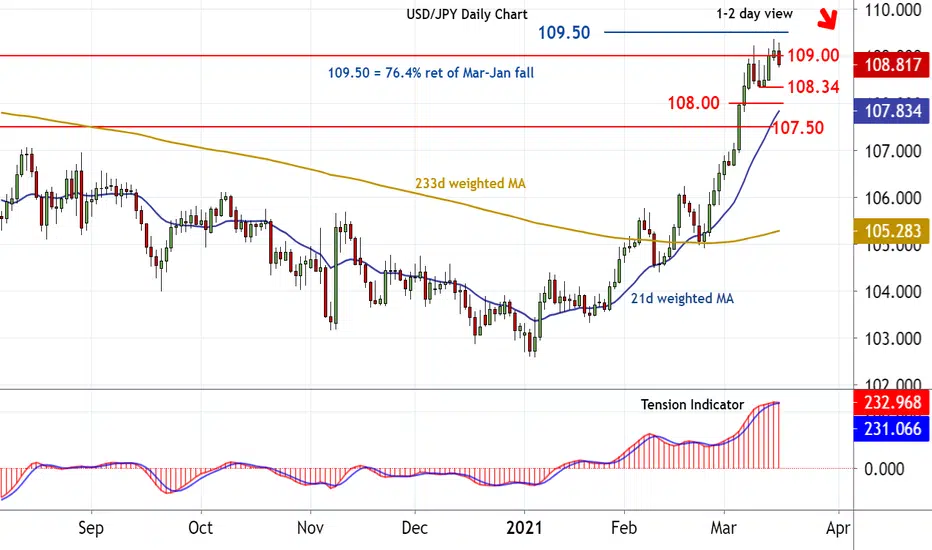
Chart USD/JPY: Leaning lower13:10 GMT - Consolidation below 109.00 is giving way to fresh losses, as intraday studies track lower, with prices now approaching the 108.34 weekly low of 10 March. Falling daily stochastics and the bearish Tension Indicator highlight a deterioration in sentiment and potential for a later break towards 108.00. Beneath here is 107.50. Meanwhile, a close above 109.00 would turn sentiment Neutral, but a further close above the 109.50 Fibonacci retracement, if seen, would turn sentiment outright Positive once again and extend January gains.
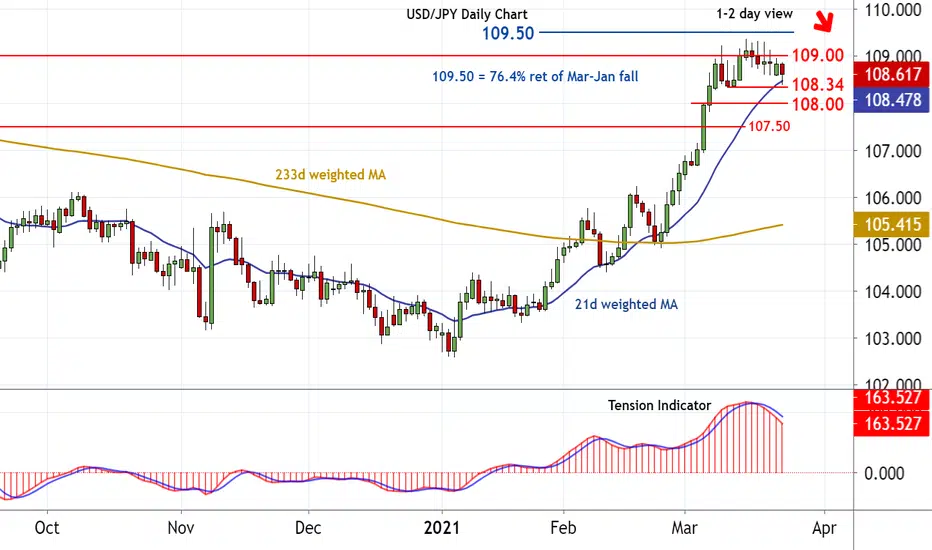
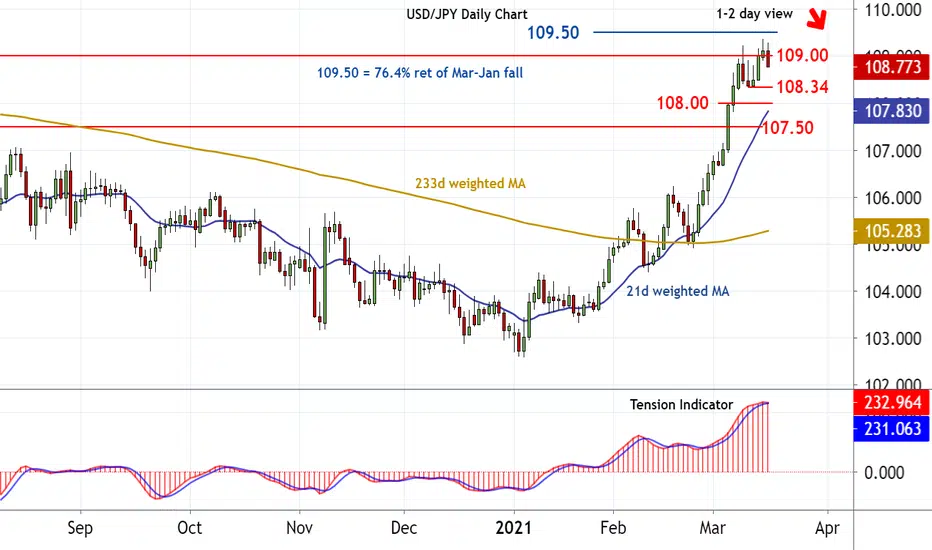
USD/JPY: Turning away from the 109.50 Fibonacci retracement13:35 GMT - The break above 109.00 is meeting fresh selling interest just below the 109.50 Fibonacci retracement, whilst intraday studies track lower. Daily stochastics are also under pressure, unwinding negative divergence, and the positive Tension Indicator is flattening, highlighting increased downside risks in the coming sessions. Immediate support is at congestion around 108.50 and extends to the 108.34 weekly low of 10 March. A close beneath here would turn sentiment Negative, and extend losses below 108.00 towards 107.50. Meanwhile, a close above 109.50 is needed to turn sentiment outright Positive once again and extend January gains.
USD/JPY: Turning away from the 109.50 Fibonacci retracement13:35 GMT - The break above 109.00 is meeting fresh selling interest just below the 109.50 Fibonacci retracement, whilst intraday studies track lower. Daily stochastics are also under pressure, unwinding negative divergence, and the positive Tension Indicator is flattening, highlighting increased downside risks in the coming sessions. Immediate support is at congestion around 108.50 and extends to the 108.34 weekly low of 10 March. A close beneath here would turn sentiment Negative, and extend losses below 108.00 towards 107.50. Meanwhile, a close above 109.50 is needed to turn sentiment outright Positive once again and extend January gains.
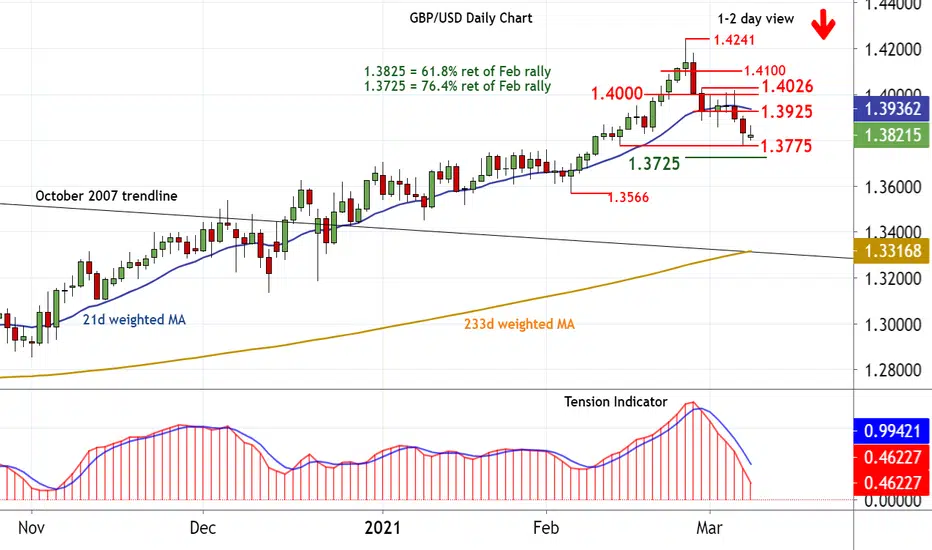
GBP/USD: Focus on the 1.3725 Fibonacci retracementAnticipated losses have reached the 1.3775 low of 12 February, where unwinding oversold intraday studies are prompting short covering and consolidation. However, daily stochastics and the Tension Indicator continue to track lower, highlighting further deterioration in sentiment and scope for further losses in the coming sessions. A later close below 1.3775 will open up the 1.3725 Fibonacci retracement, where fresh consolidation could unfold. Meanwhile, resistance remains at the 1.3925 intraday lows. Negative weekly charts should limit any unexpected break above here to 1.4000/26.
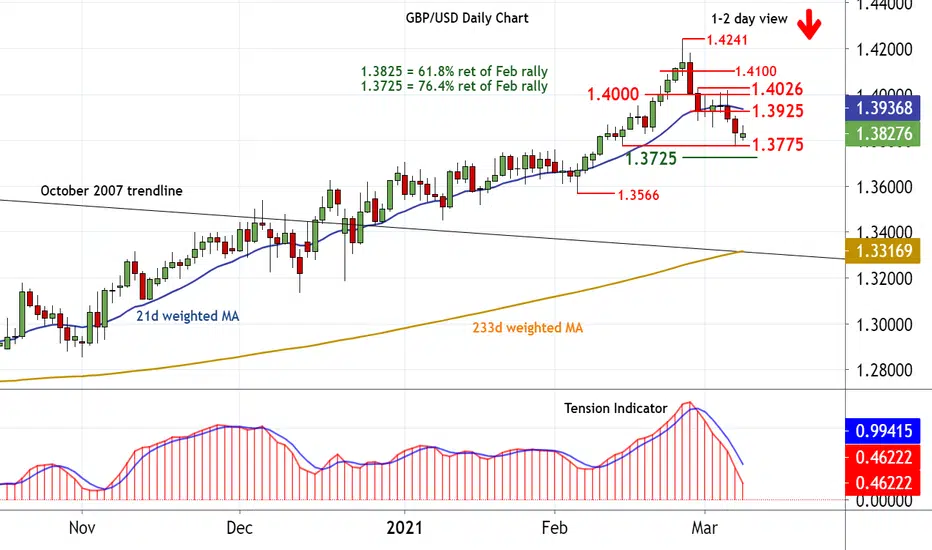
GBP/USD: Focus on the 1.3725 Fibonacci retracementAnticipated losses have reached the 1.3775 low of 12 February, where unwinding oversold intraday studies are prompting short covering and consolidation. However, daily stochastics and the Tension Indicator continue to track lower, highlighting further deterioration in sentiment and scope for further losses in the coming sessions. A later close below 1.3775 will open up the 1.3725 Fibonacci retracement, where fresh consolidation could unfold. Meanwhile, resistance remains at the 1.3925 intraday lows. Negative weekly charts should limit any unexpected break above here to 1.4000/26.
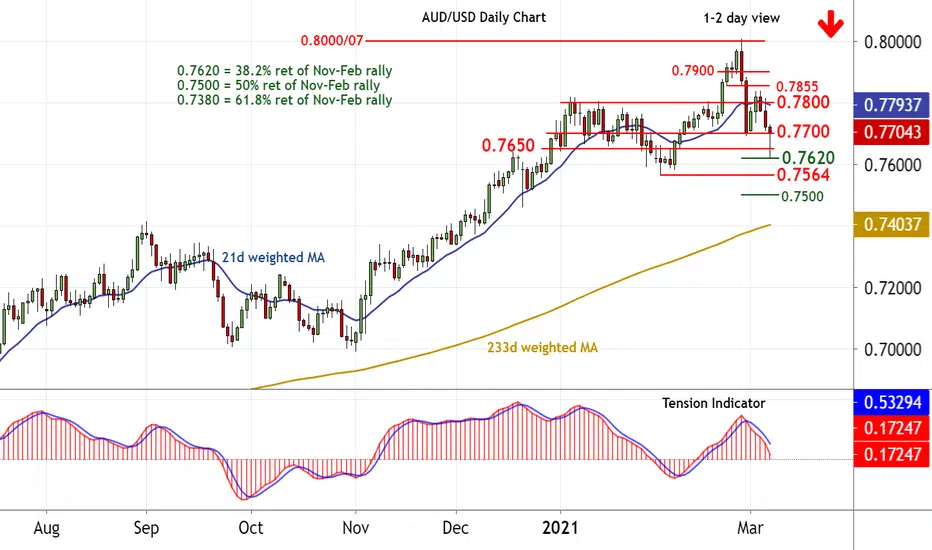
AUD/USD: Coming under pressure14:15 GMT - Anticipated losses have spiked below congestion around 0.7650, with unwinding oversold intraday studies prompting a bounce from the 0.7620 Fibonacci retracement. Short-term gains are possible, before negative daily stochastics and the falling Tension Indicator extend losses still further. A later break below 0.7620 will open up critical support at the 0.7564 current year low from 2 February. Meanwhile, resistance is at 0.7800 and should prove difficult to reach.