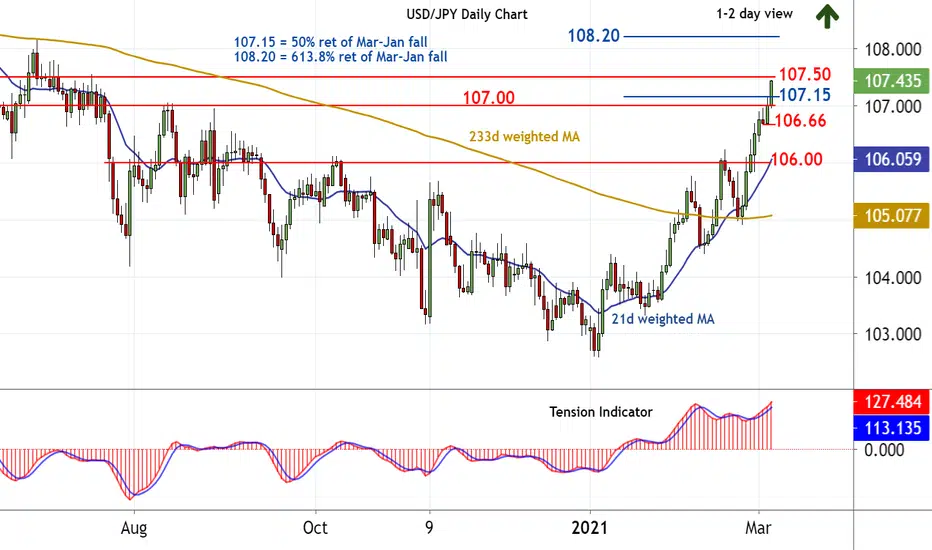
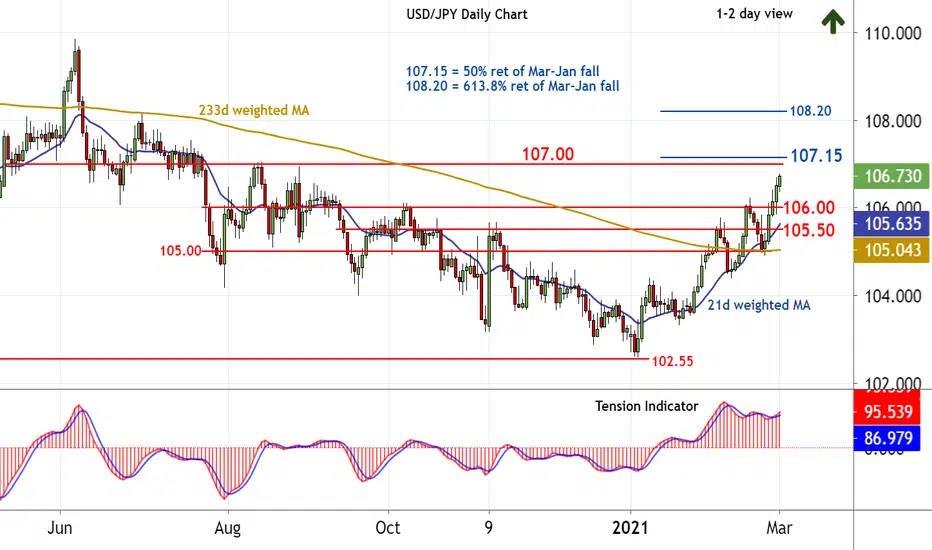
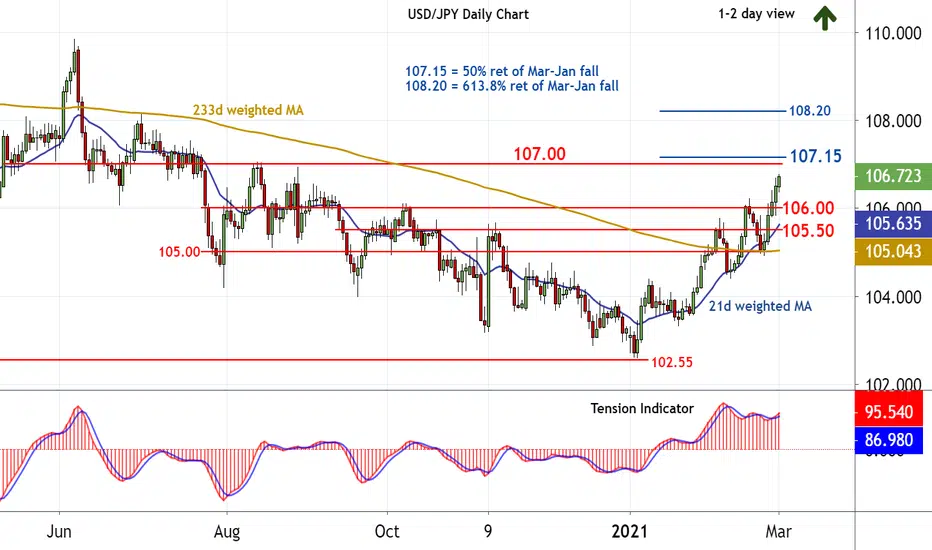
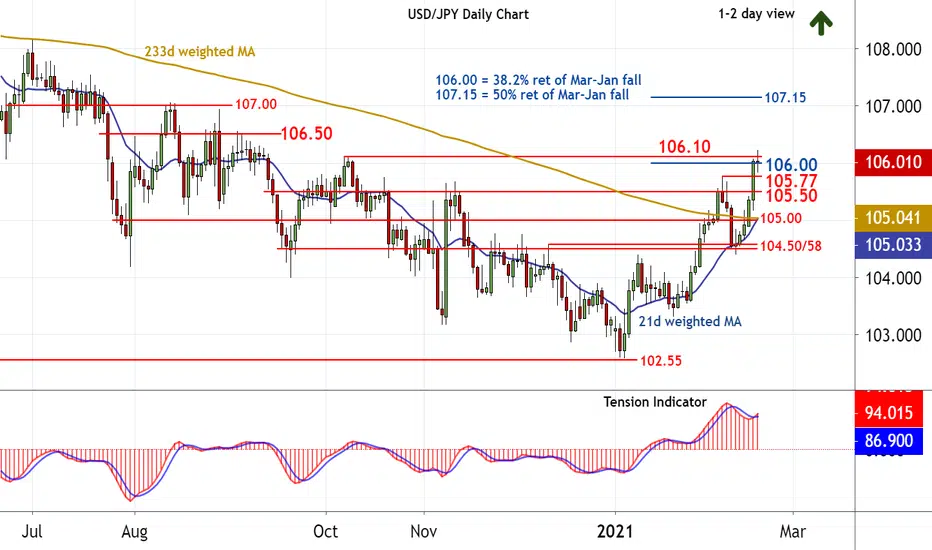
USD/JPY: Extending January gains in JPY-driven trade13:30 GMT - Still no change in the bullish tone, as daily stochastics and the Tension Indicator continue to track higher. The break above the 107.15 Fibonacci retracement has improved sentiment once again, with JPY-driven trade extending January gains towards congestion around 107.50. Broad weekly charts are positive, highlighting later clearance towards 108.00/20. Meanwhile, support is raised to congestion around 107.00 and extends to 106.66. A break beneath here, not seen, will add weight to sentiment and prompt a pullback towards congestion around 106.00, where improving background sentiment could prompt fresh buying interest.
Professional
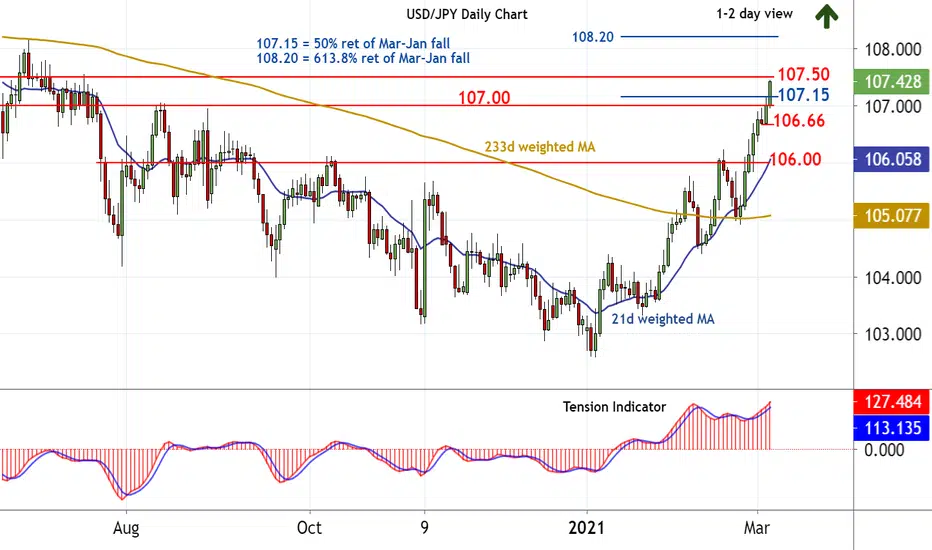
USD/JPY: Extending January gains in JPY-driven trade13:30 GMT - Still no change in the bullish tone, as daily stochastics and the Tension Indicator continue to track higher. The break above the 107.15 Fibonacci retracement has improved sentiment once again, with JPY-driven trade extending January gains towards congestion around 107.50. Broad weekly charts are positive, highlighting later clearance towards 108.00/20. Meanwhile, support is raised to congestion around 107.00 and extends to 106.66. A break beneath here, not seen, will add weight to sentiment and prompt a pullback towards congestion around 106.00, where improving background sentiment could prompt fresh buying interest.
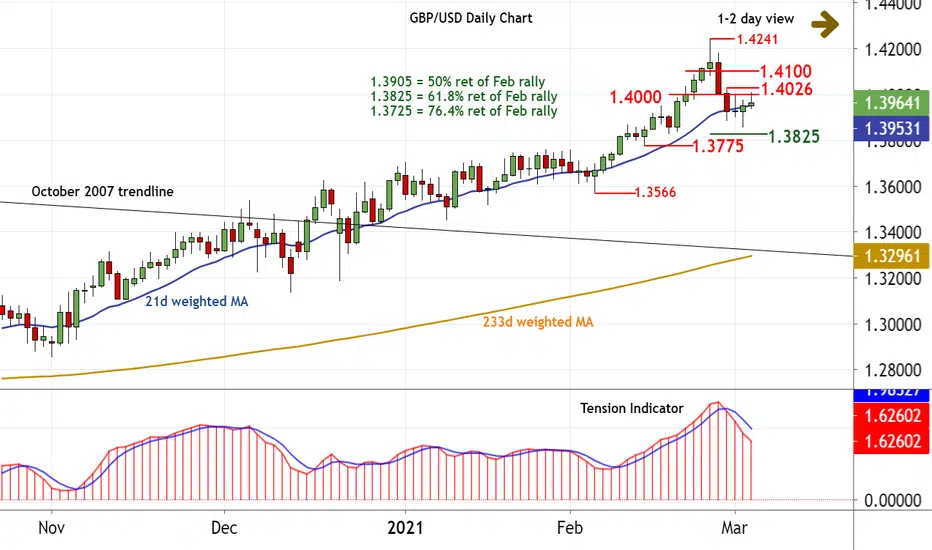
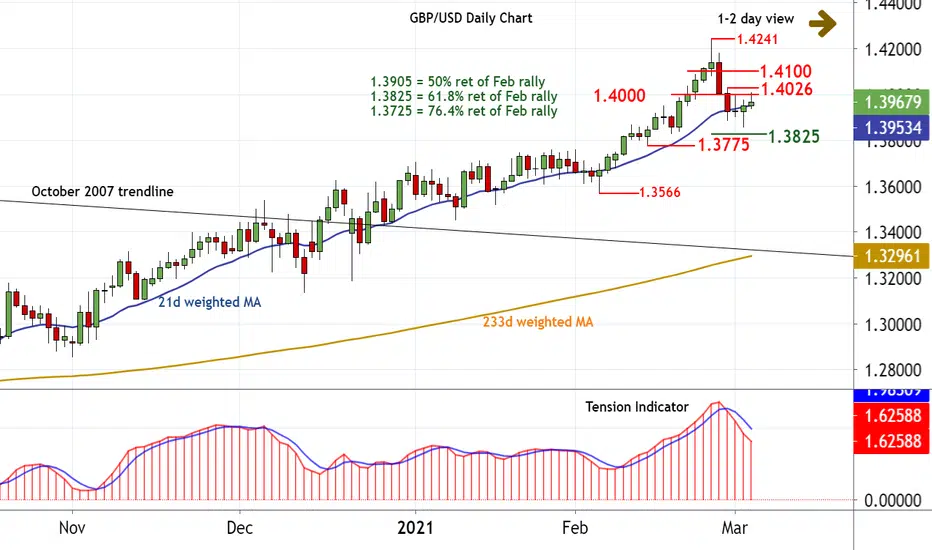
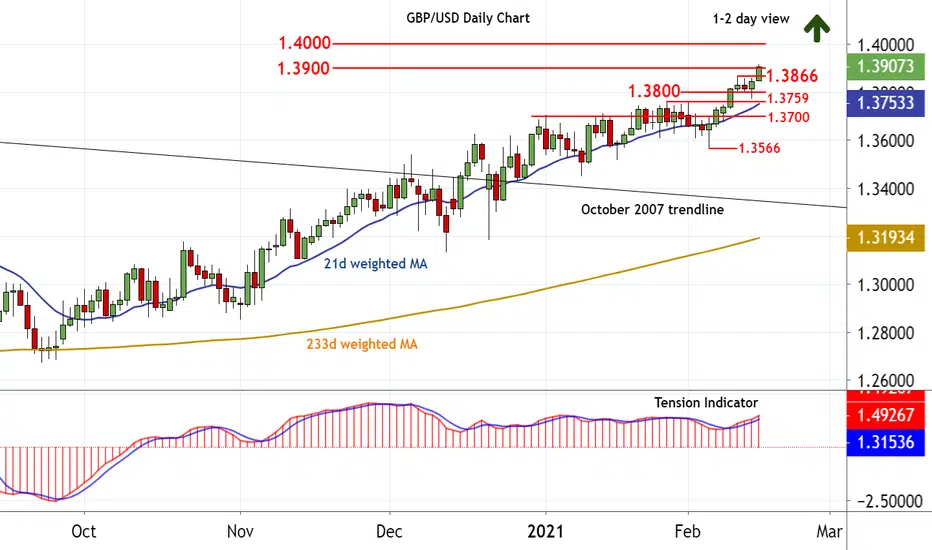
GBP/USD: Short-term consolidation - risk of further lossesSupport is appearing at 1.3860, whilst oversold intraday studies unwind, with prices now pressuring 1.4000. Just higher is the 1.4026 high of 26 February, but the falling Tension Indicator is expected to limit any tests/break of here in fresh selling interest. In the coming sessions, consolidation is expected to give way to fresh losses, with a later break below 1.3860 opening up the the 1.3825 retracement. Meanwhile, a close above 1.4026, if seen, would delay downside tests and turn sentiment cautiously Positive as focus then turns to 1.4100.
GBP/USD: Short-term consolidation - risk of further lossesSupport is appearing at 1.3860, whilst oversold intraday studies unwind, with prices now pressuring 1.4000. Just higher is the 1.4026 high of 26 February, but the falling Tension Indicator is expected to limit any tests/break of here in fresh selling interest. In the coming sessions, consolidation is expected to give way to fresh losses, with a later break below 1.3860 opening up the the 1.3825 retracement. Meanwhile, a close above 1.4026, if seen, would delay downside tests and turn sentiment cautiously Positive as focus then turns to 1.4100.
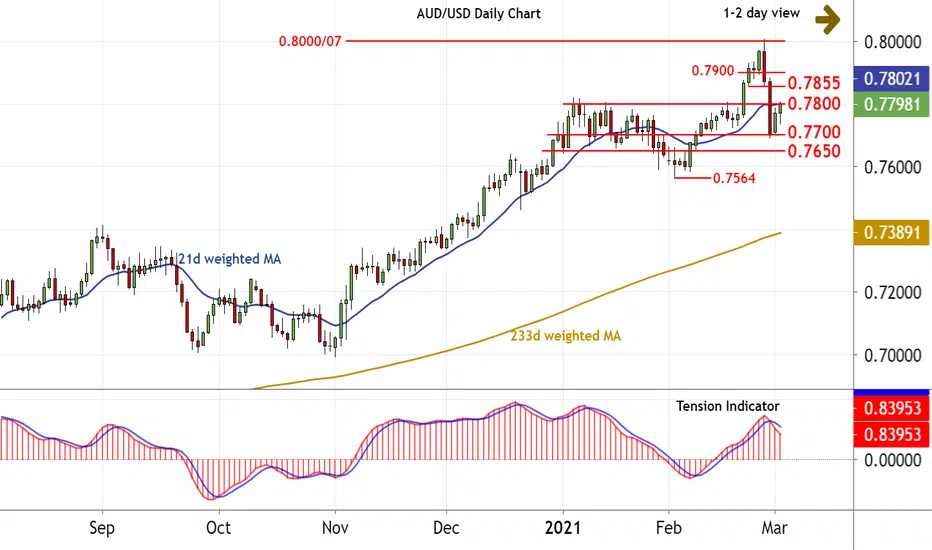
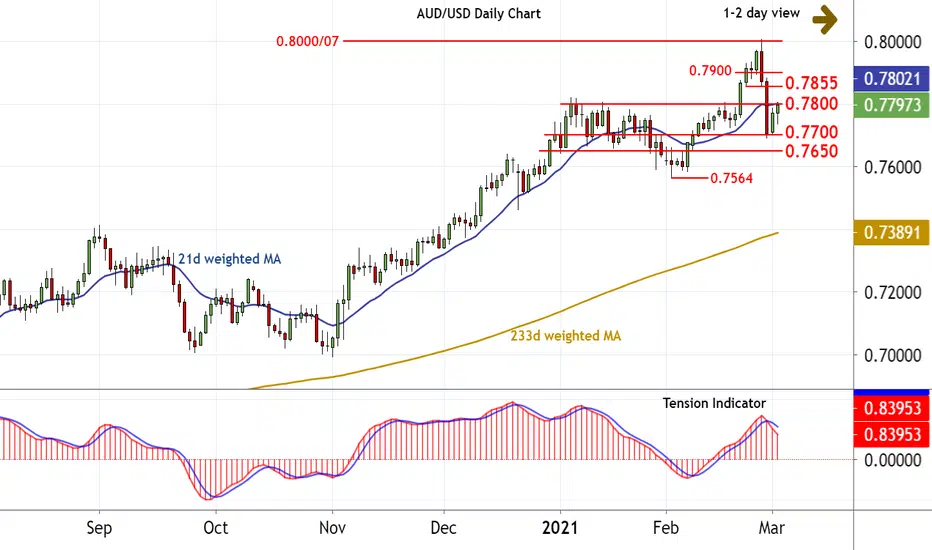
AUD/USD: Limited scope above 0.780014:10 GMT - The anticipated run to 0.7800 has been seen. Intraday studies continue to point higher, suggesting scope for a break, but negative daily stochastics and the falling Tension Indicator should limit scope to 0.7855. Following corrective gains, expectations are for prices to come under fresh pressure, with a later break below 0.7700 targeting 0.7650. Deteriorating weekly charts highlight potential for further slippage towards critical support at the 0.7564 current year low from 2 February.
AUD/USD: Limited scope above 0.780014:10 GMT - The anticipated run to 0.7800 has been seen. Intraday studies continue to point higher, suggesting scope for a break, but negative daily stochastics and the falling Tension Indicator should limit scope to 0.7855. Following corrective gains, expectations are for prices to come under fresh pressure, with a later break below 0.7700 targeting 0.7650. Deteriorating weekly charts highlight potential for further slippage towards critical support at the 0.7564 current year low from 2 February.
USD/JPY: Extending gains13:15 GMT - No change in the bullish tone, as daily stochastics and the Tension Indicator continue to track higher. January gains are now approaching congestion around 107.00 and the 107.15 Fibonacci retracement, where mixed intraday studies could prompt short-term reactions. Broader weekly charts are bullish, however, highlighting a later break and continuation towards 107.50, and higher. Meanwhile, support is down to congestion around 106.00, and should underpin any immediate setbacks. A close beneath here, not seen, would turn sentiment cautiously Negative and open up congestion around 105.50.
USD/JPY: Extending gains13:15 GMT - No change in the bullish tone, as daily stochastics and the Tension Indicator continue to track higher. January gains are now approaching congestion around 107.00 and the 107.15 Fibonacci retracement, where mixed intraday studies could prompt short-term reactions. Broader weekly charts are bullish, however, highlighting a later break and continuation towards 107.50, and higher. Meanwhile, support is down to congestion around 106.00, and should underpin any immediate setbacks. A close beneath here, not seen, would turn sentiment cautiously Negative and open up congestion around 105.50.
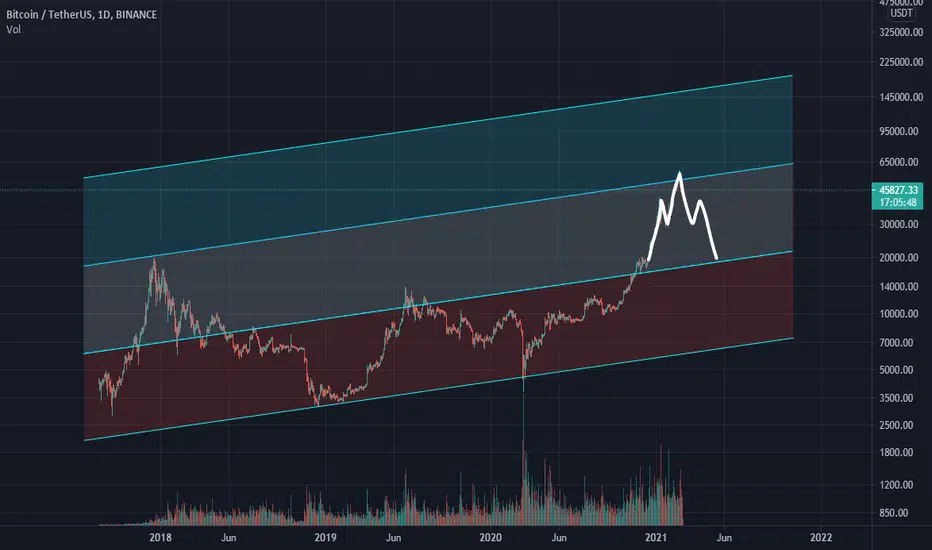
BTCUSDT::Channelthis is the price channel of BTCUSDT , what is your idea ?(comment)
please share your idea with me and click like , send comment and follow me.
thanks to see my technical analysis .
(i send it last week ,but my idea ban becuse i take Advertise at Description)
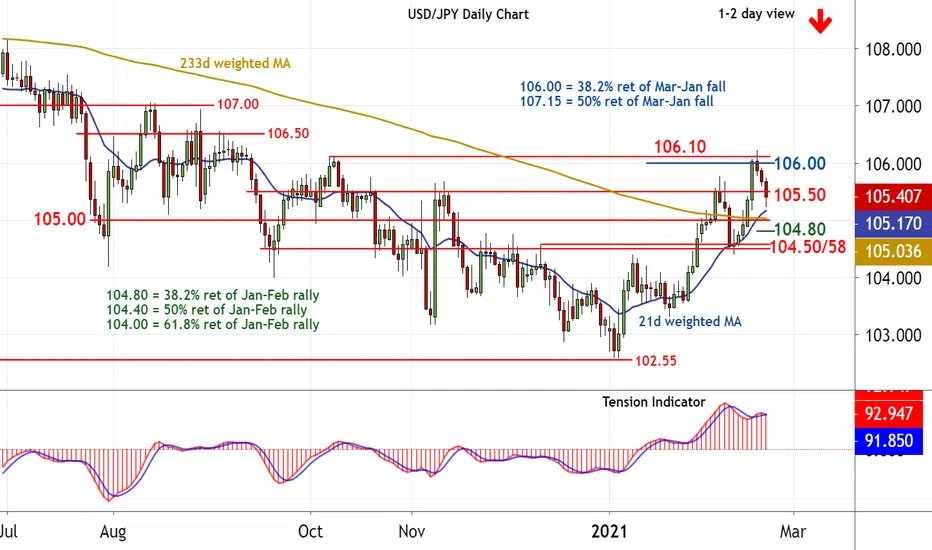
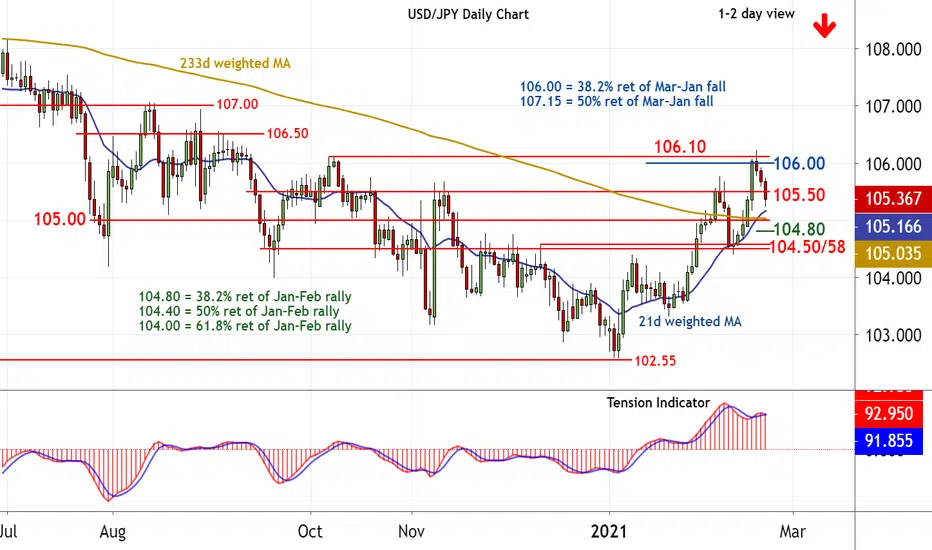
USD/JPY: Extending pullback13:20 GMT - The corrective pullback is extending, whilst daily stochastics and the Tension Indicator continue to track lower, with the break below 105.50 adding fresh weight to sentiment. Focus is turning to congestion around 105.00 and the 104.80 Fibonacci retracement, where already oversold intraday studies could prompt short-term consolidation. Meanwhile, immediate resistance is at 105.50. A close above here would help to stabilise price action, but a close above 106.00/10, not yet seen, will turn sentiment outright Positive and confirm continuation of January gains.
USD/JPY: Extending pullback13:20 GMT - The corrective pullback is extending, whilst daily stochastics and the Tension Indicator continue to track lower, with the break below 105.50 adding fresh weight to sentiment. Focus is turning to congestion around 105.00 and the 104.80 Fibonacci retracement, where already oversold intraday studies could prompt short-term consolidation. Meanwhile, immediate resistance is at 105.50. A close above here would help to stabilise price action, but a close above 106.00/10, not yet seen, will turn sentiment outright Positive and confirm continuation of January gains.
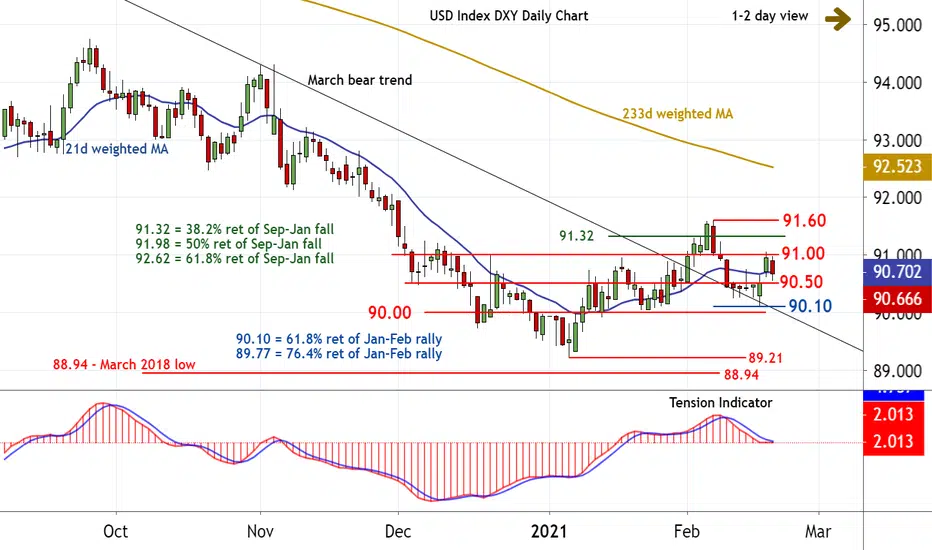
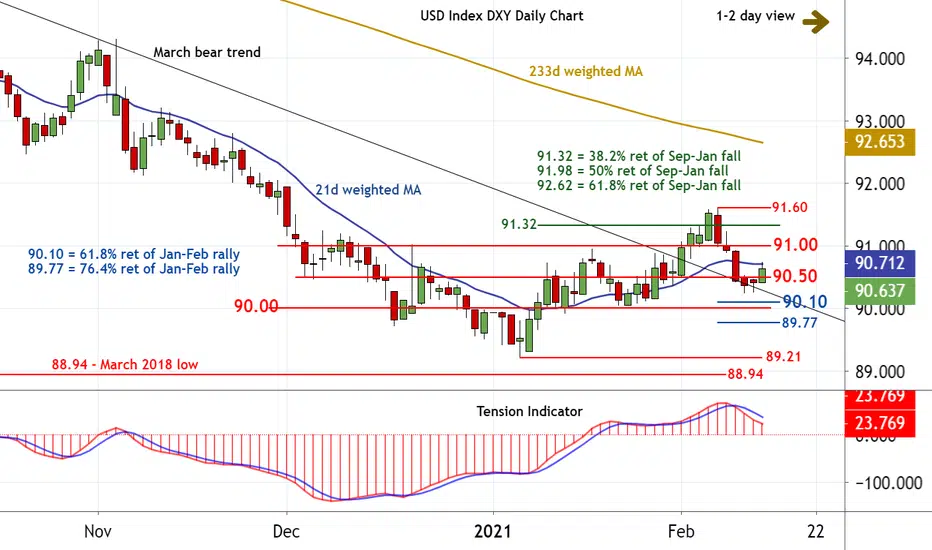
USD Index DXY: Consolidating - weekly charts positive16:10 GMT - The pullback from 91.00 has all but reached 90.50. Prices are currently balanced above here, but negative intraday studies suggest risk of further slippage towards the 90.10 Fibonacci retracement, where improving daily stochastics and the flattening Tension Indicator could prompt fresh consolidation. Following corrective trade, rising weekly charts point to fresh gains, but a close above 91.00 is needed to prompt a cautious upgrade and open up the 91.32 retracement. Critical resistance, however, remains at the 91.60 weekly high of 5 February. A close above here is needed to confirm continuation of January gains and open up 91.98/00.
USD Index DXY: Consolidating - weekly charts positive16:10 GMT - The pullback from 91.00 has all but reached 90.50. Prices are currently balanced above here, but negative intraday studies suggest risk of further slippage towards the 90.10 Fibonacci retracement, where improving daily stochastics and the flattening Tension Indicator could prompt fresh consolidation. Following corrective trade, rising weekly charts point to fresh gains, but a close above 91.00 is needed to prompt a cautious upgrade and open up the 91.32 retracement. Critical resistance, however, remains at the 91.60 weekly high of 5 February. A close above here is needed to confirm continuation of January gains and open up 91.98/00.

USD/JPY: Reached 106.00/10 - scope for still higher12:45 GMT - The break above the 105.77 weekly high of 5 February has reached the 106.00/10 area, where unwinding overbought intraday studies are prompting short-term consolidation. Daily stochastics and the Tension Indicator continue to track higher, however, and background weekly charts are positive, highlighting further gains in the coming sessions. A later close above 106.00/10 will extend January gains towards 106.50, ahead of the 107.15 Fibonacci retracement. Meanwhile, any break below 105.77 should stabilise above 105.50.

USD/JPY: Reached 106.00/10 - scope for still higher12:45 GMT - The break above the 105.77 weekly high of 5 February has reached the 106.00/10 area, where unwinding overbought intraday studies are prompting short-term consolidation. Daily stochastics and the Tension Indicator continue to track higher, however, and background weekly charts are positive, highlighting further gains in the coming sessions. A later close above 106.00/10 will extend January gains towards 106.50, ahead of the 107.15 Fibonacci retracement. Meanwhile, any break below 105.77 should stabilise above 105.50.
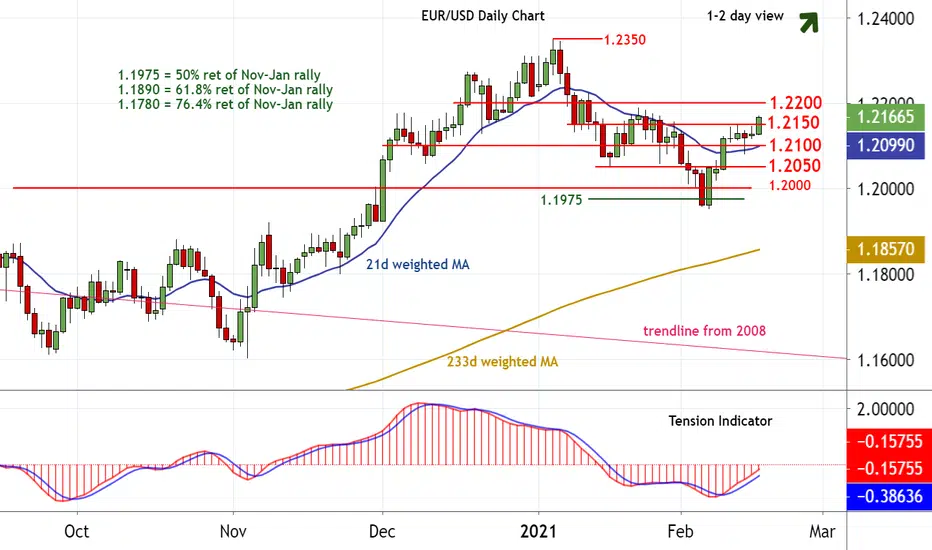
EUR/USD: Scope remains for a break to 1.2200Little change, whilst prices extend consolidation aroubd 1.2150. The daily Tension Indicator continues to track higher, highlighting a break, but overbought daily stochastics and negative weekly charts are expected to limit any tests/break of 1.2200 in fresh selling interest. Meanwhile, support remains at 1.2100 and extends to the 1.2082 low of 12 February. A later close beneath here will add weight to sentiment and open up 1.2050. Any deeper reactions, however, should stabilise above 1.1975-1.2000.
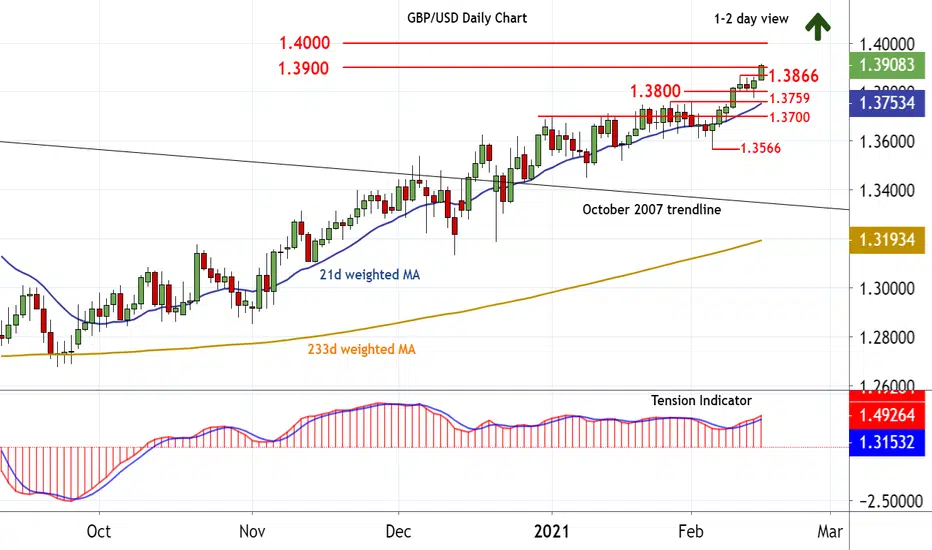
GBP/USD: Breaking higherConsolidation is giving way to a fresh break higher to 1.3900, as intraday studies track steadily higher. Both daily and weekly Tension Indicators remain positive, highlighting scope for further gains in the coming sessions, with a close above 1.3900 extending March 2020 gains towards historic congestion around 1.4000 and the 1.4030 weekly high of late April 2018. However, overbought daily stochastics are expected to prompt profit-taking around here. Meanwhile, support is at the 1.3866 weekly high of 10 February. A close beneath here, if seen, will turn sentiment Neutral and open up deeper losses towards 1.3800.
GBP/USD: Breaking higherConsolidation is giving way to a fresh break higher to 1.3900, as intraday studies track steadily higher. Both daily and weekly Tension Indicators remain positive, highlighting scope for further gains in the coming sessions, with a close above 1.3900 extending March 2020 gains towards historic congestion around 1.4000 and the 1.4030 weekly high of late April 2018. However, overbought daily stochastics are expected to prompt profit-taking around here. Meanwhile, support is at the 1.3866 weekly high of 10 February. A close beneath here, if seen, will turn sentiment Neutral and open up deeper losses towards 1.3800.
USD Index DXY: Turning away from 90.00/1014:50 GMT - The pullback towards 90.00/10 has found fresh support at 90.25, whilst intraday studies track higher and oversold daily stochastics flatten. The break above 90.50 has opened up the 91.00 break level, but the falling Tension Indicator is expected to limit any immediate tests in fresh consolidation. Weekly charts continue to improve, however, suggesting a later break and a run towards critical resistance at the 91.60 weekly high of 5 February. Meanwhile, support remains at 90.00/10 and should continue to underpin any immediate setbacks.
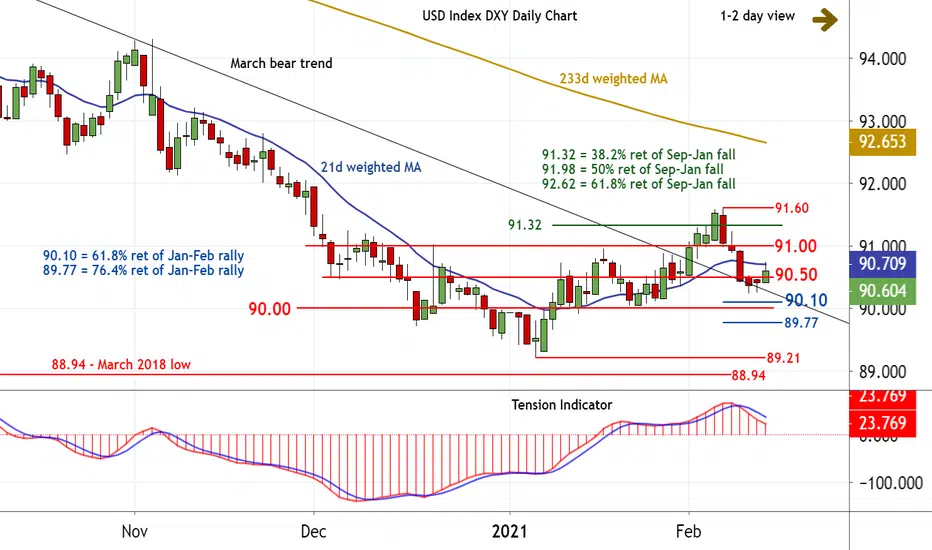
USD Index DXY: Turning away from 90.00/1014:50 GMT - The pullback towards 90.00/10 has found fresh support at 90.25, whilst intraday studies track higher and oversold daily stochastics flatten. The break above 90.50 has opened up the 91.00 break level, but the falling Tension Indicator is expected to limit any immediate tests in fresh consolidation. Weekly charts continue to improve, however, suggesting a later break and a run towards critical resistance at the 91.60 weekly high of 5 February. Meanwhile, support remains at 90.00/10 and should continue to underpin any immediate setbacks.
EUR/USD: Consolidation before higherThe corrective bounce from the 1.1952 weekly low of 5 February is settling into consolidation below 1.2150, whilst overbought intraday studies unwind. Daily stochastics and the Tension Indicator continue to track higher, however, highlighting a later break above 1.2150, but overbought momentum readings and negative weekly charts are expected to prompt fresh selling interest towards 1.2200. Meanwhile, support remains at 1.2100. A close beneath here, if seen, will turn sentiment cautiously Negative and put focus back on congestion around 1.2000.
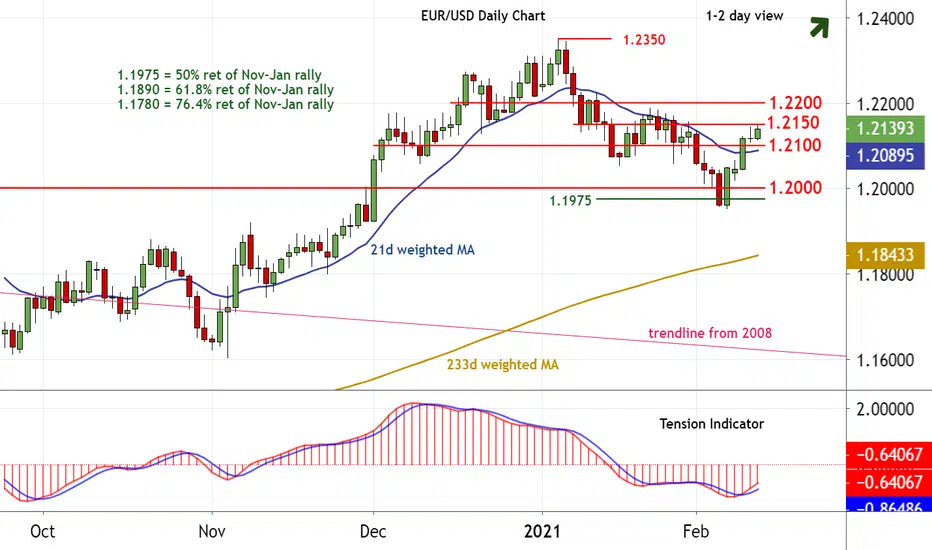
EUR/USD: Consolidation before higherThe corrective bounce from the 1.1952 weekly low of 5 February is settling into consolidation below 1.2150, whilst overbought intraday studies unwind. Daily stochastics and the Tension Indicator continue to track higher, however, highlighting a later break above 1.2150, but overbought momentum readings and negative weekly charts are expected to prompt fresh selling interest towards 1.2200. Meanwhile, support remains at 1.2100. A close beneath here, if seen, will turn sentiment cautiously Negative and put focus back on congestion around 1.2000.
