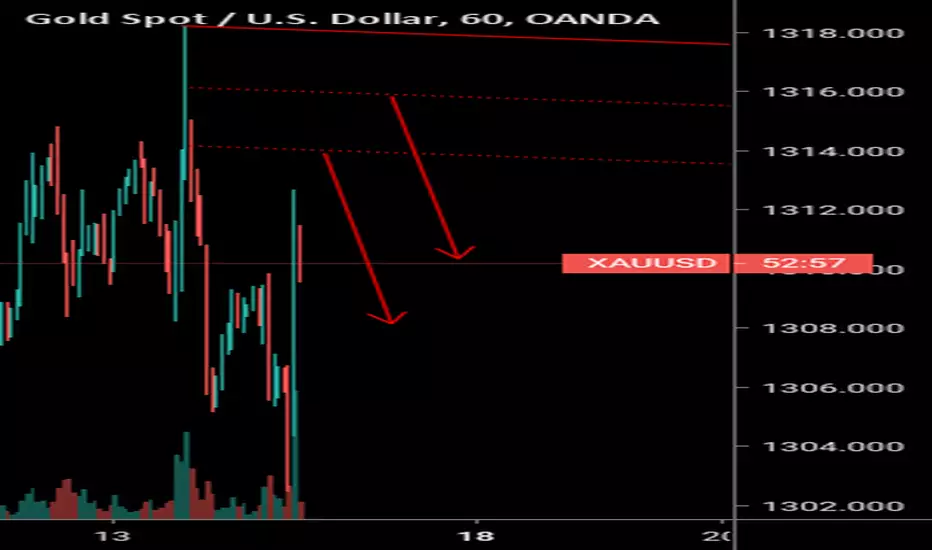
USDCHF SHORT PROJECTION (UPDATE) IF YOU LOOK AT USDCHF YOU CAN SEE THAT THE MOMENTUM HAS BEEN ON THE SELLER SIDE AND THIS PAIR HAS BEEN ON THE MOVE TO THE DOWNSIDE. I HAD MADE A POST LAST WEEK SHOWING THE SIGNIFICANT STRUCTURE LEVELS I THINK THIS PAIR COULD POTENTIALLY VISIT. IT HAS ALREADY HIT 2 OF THOSE LEVELS AND BASED ON MOMENTUM IS LOOKING LIKE IT STILL HAS A WAYS TO GO. KEEP AN EYE ON THIS PAIR AND HOPEFULLY YOU'RE CATCHING OPPORTUNITIES FOR SHORTS ON THE WAY DOWN AS LONG AS MOMENTUM PERMITS YOU TO DO SO. KEEP AN EYE OUT!
CHEERS!
Projection

LTC Halving's "sell the news sell-off" Window Approaching.Short!LTC short based on Christian Investment Analysis' (CIADC.co) Special Report: Cryptonomics
During LTC's first Cryptonomics cycle (halving) LTC rallied for 133 days from $1.12 to $8.12.
47 Days before its 1st halving Litecoin tanked 60% in one day from $8.12 to $3.00
Will Litecoin repeat its volatile behavior approaching its 2nd halving?
It may not be as drastic, but we think it will be profitable $$$ here at CIA...

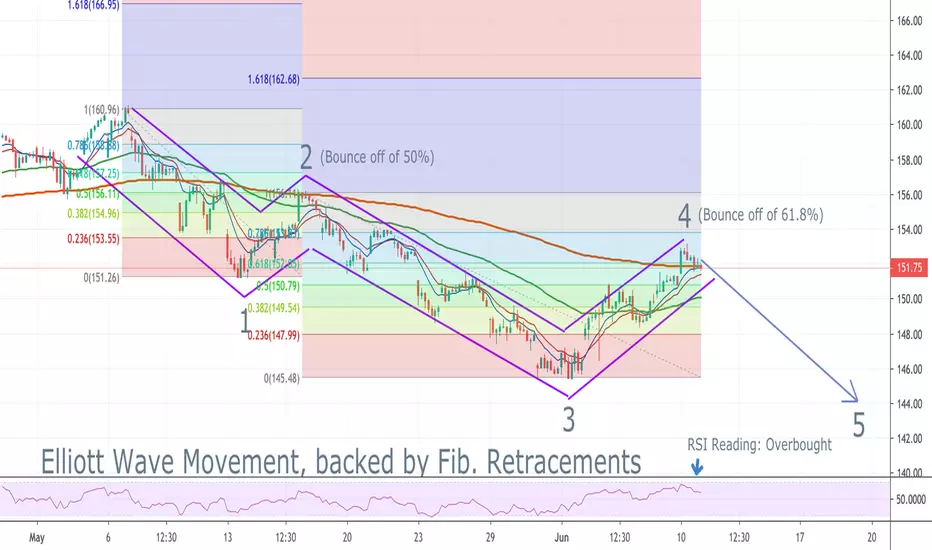
Formations on IWM Leading To Imminent Downward CorrectionThe AMEX:IWM Russell 2000 cap-weighted ETF is showing signs of very imminent downward movement, backed by Elliott Wave Theory, Fibonacci Retracements, and its Relative Strength Index (RSI).
Elliott Wave Theory is a beautiful and fundamental tool for analyzing price action, though it can exhibit many inaccuracies when used to forecast future price movements. In order to determine, in real time, the pivot points at which the wave legs will see a reversal, other indicators and technical studies must be used in conjunction to quantify these price levels.
I have identified (in the past as well) this Elliott Wave Pattern, but too early in the pattern to quantitatively forecast corrective retracements. According to the pattern, we are currently in the fourth leg. To find the point at which price action will look to bounce and continue to finish the overall downward trend (before entering the ABC reversal), I looked at the reversal at point 2. Here, price action perfectly bounced off of the 50% support level and began to form the third leg. (See the point on the chart marked "Bounce off of 50%".) This proved the effectiveness of the cooperative conjunction between Fibonacci Retracements and Elliott Wave Theory.
Using this understanding, I placed the Fibonacci Retracement between points 2, 3, and 4 (what I'm calling 4). At this point (end of day on Monday 6/10/19) IWM is trading at $151.75. This price level is leaning towards a bounce off of the 61.8% level, or $152.05. The RSI on this hourly chart read >70, a sign of overbuying.
If the volatile market paves the way for a news-propelled daily price-action gap (presumably on the upside), we can also expect the fifth leg to form after a bounce off of the 78.5% level, or $153.83.
Summary:
Elliott Wave Theory alone cannot forecast precise price action, but when used in conjunction with Fibonacci Retracements, bounces can be quantitatively projected.
Based on this, we can expect the fifth and final downward leg of IWM to form as a bounce off of the 61.8% retracement level, or $152.05 .
If the daily gap patterns persist (Tuesday opens as a gap up), likely on the upside, price action will presumably find itself combatting with the 78.6% resistance level, or $153.83, before continuing the overall retracement to become the fifth leg of the Elliot Wave pattern.
Especially on these higher time-frames, such broad ETFs are very closely correlated. The ETFs I have in mind are: AMEX:SPY (S&P 500), NASDAQ:QQQ (Nasdaq), and AMEX:IWM (Russell 2000). This means that if the IWM pattern proves correct and is followed, very similar movement will almost certainly occur in these other assets and across asset classes.
Rough and volatile market times: keep your eyes open! Please like, follow, and share.
Prices return to above 21 EMAPrices are targeting the area around 24.11 to regain a foothold above the 21 EMA.

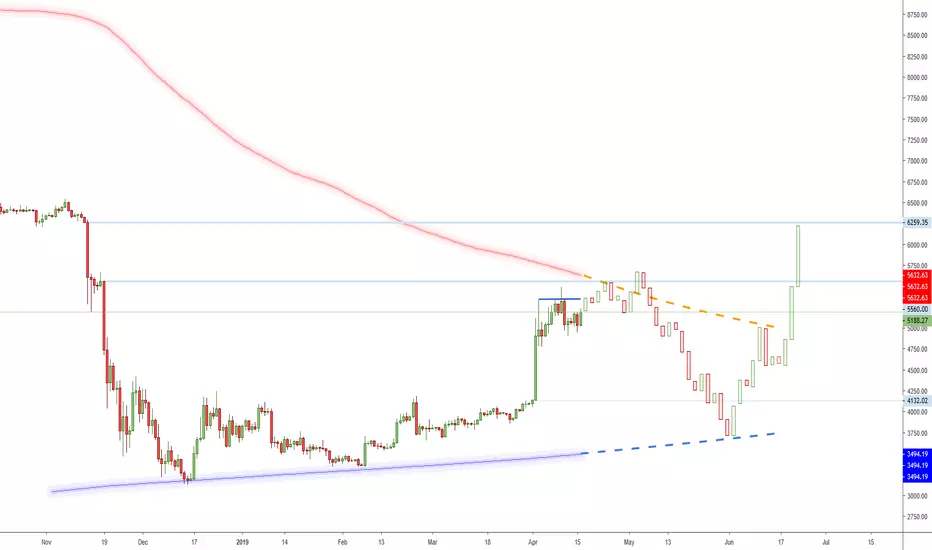
Bitcoin BTCUSD ForecastI could see something like this play out.
Moving averages are the 50 week and 200 week but put on the daily chart (350 bars and 1400 bars)
Daily Chart Coinbase:
Weekly Chart Coinbase:
Bitstamp Weekly Log Chart:
Bitstamp Daily Log Chart:
Let me know your thoughts below!
What is your prediction?


BTTBTC Correction Wave AnalysisBINANCE:BTTBTC
BTT is currently in a correction wave.
Price movement is tight and looks like to be forming a Elliott triangle wave. Looking for a thrust out of the triangle to the upside to finish wave B.
A shallow wave C should follow with support at the 0.00000029-0.00000028 level if we are to see any signs of strong bullish behavior before resuming the previous trend.
This will also form the cup and handle pattern.
If those levels does not hold, then we will see a deeper wave C looking for support at 0.00000025 and then 0.00000021.

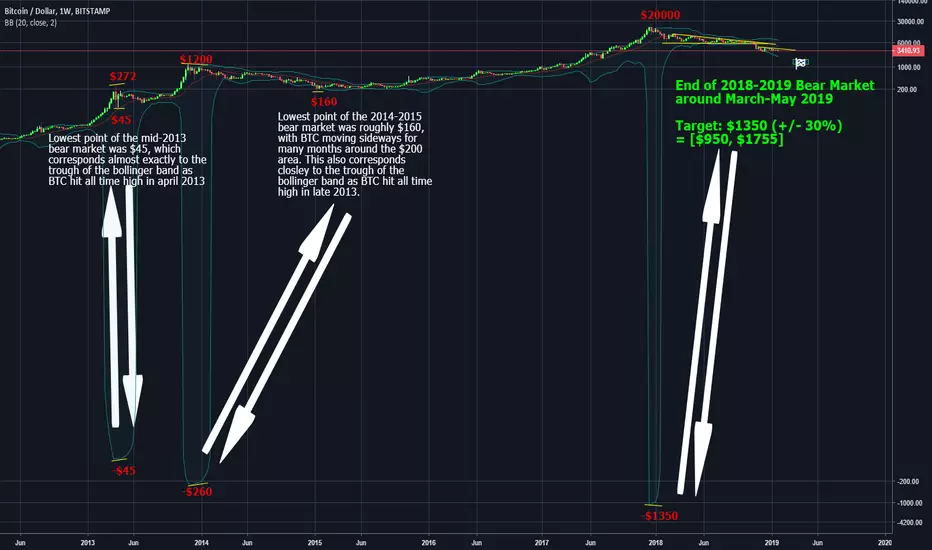
Ultimate '19 Bear Market Target >>$1350 (Bollinger Bands weekly)If you check out the Bollinger bands on the weekly BTC chart, you would see how over extended they become when BTC hits its all-time highs.
Using a basic analysis on the Bollinger Bands bottom (lows) at each all time high, gives a very good projection/indication of the lowest price range of BTC in each following bear market.
Projecting the above theory to the December 2017 bubble, we can project that the BTC bottom will be around the $1350 price (ranging between $950 and $1755) within the March-May 2019 window .
My best guess is a quick shot down to the $1350 target from the $3k levels sometime in late Feb/early March, followed by a swift U-shaped recovery back to the $3k levels in April to begin the new consolidation phase & Bull market...
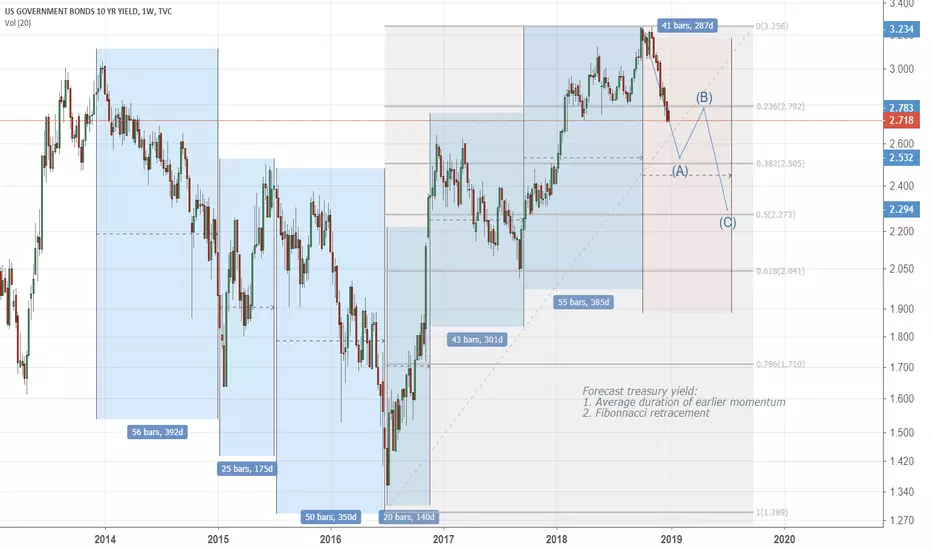
Forecast US 10 year treasury yieldThis is an attempt to forecast the yield on treasury notes based on technical analysis. Clearly this is an incomplete analysis as fundamentals will also impact heavily. So let us consider the following a base case. First, there are trends in the yield. I would not call it cycles because they have different duration. Those thends tend to last a longer time, more than six months. I use the average trend duration to make a forecast of the bottom. Second, Fibonacci is used to make a price projection. 38% retracement would mean going down to 2.5% (from 2.8% today). 62% retracement is 2.0%. The fall in yield will not be smooth and will have ups and downs (indicated by an ABC pattern from Elliott. but it could equally well be an 12345).
Forecast: In July 2019 the yield will have fallen substantially. A good benchmark is 2.3%.
The analysis is incomplete because it does not take explicit Fed action into account. A 10 year yield of 2.5% would invert the yield curve even without any further increase in the short term rate by the Fed.
NIKKEI / ELLIOTT WAVE PROJECTIONS / H4Trading Bias: Short
Technical Strategy: Trend continuation + Elliott Wave projections
*Will look to capture wave 5 within the anticipated sell zone*

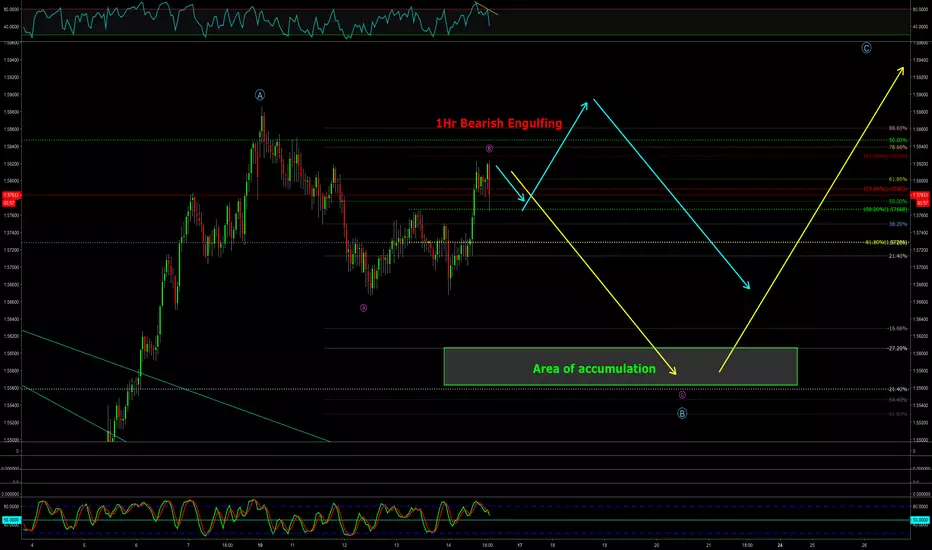
EURAUD Short EURAUD showing slight weakness for a short opportunity.
1Hr Bearish Engulfing and a 4Hr bearish engulfing.
This is also completed a three wave structure to commence the C wave.
Yellow Projection: Our preferred scenario to fall to the area of accumulation. Look for any sells through to this point.
Divergence between two peaks of RSI and we have the stochastic approaching the 50 line.
Teal Projection: Second scenario could break the prior A top then head south.
The risk: Keep your stops above blue A if you have the capacity otherwise $1.5830 for a nice tight stop on this short play.
USDCHF#USDCHF #Trading
Yellow Projection: Price could strengthen from here and tag through the trend line. Don't be fooled by this imposter bullish sign, as we still could expect one more wave down to 61.8% to compete the 3 wave correction.
Teal Projection: Second scenario would be crossing the trend line with great momentum taking price to $1.04.
Don't be frightened to take short positions down to the extreme level with any bearish continuation pattern. If price falls to the 78.6% - 88.6%, wait for RSI (cross the 20) and STOCH to cross (Cross 20 or 50 minimum) simultaniously and any other indicators to support to buy.
The risk: Price could fall and tag the (X) wave which would be a wash out, then head towards the target area.
Overall I am following yellow arrows and will only trade the yellow signals. I'm 80% bullish if yellow triggers.
