Projection

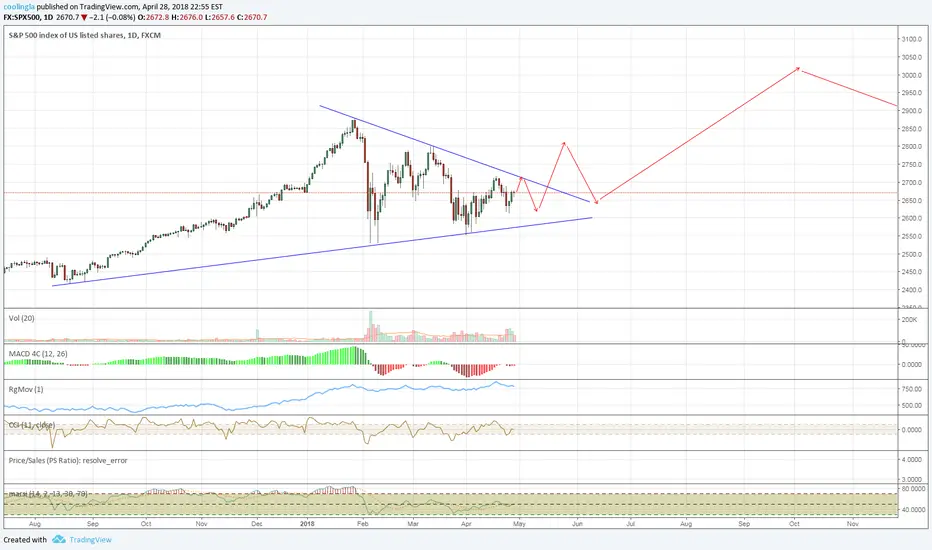
In the eye of the hurricane one must go with the flowWithin the present correction a bear stand is the only logical position. Sure it can turn over, and with the current volatility it may well go up or sideways. I believe there is still margin for the SPX500 drop at the very least to the 2591, as that is the full Fib retracement of the previous up swing. If Europe opens lower and Japan and China bleed all over there is no other path and something really unexpected would take us out of this quagmire. But beware! This may well not rest at the fib prediction. If we go lower up to 2394, this is officially bear market territory and it will take several months to get out of there
Some other reasons that lead me into believing we can continue, is how fast we broke the previous channel, and even it's projection lower served as poor support. It hang in there for 3 days, then it broke that level with one slight visit upwards, which confirmed the down move. Momentum is really low, and even if it may turn upwards, It is in deep bear territory. Bull approach at your own risk
This said, with such volatility, I will enter cautiously looking just to get out as soon as we reach the fib level of 2541. I will use an almost 1:1 risk reward ratio; something lower like 1:2 or thereabouts would stop me before this morning for sure.

NZDCHF Ghost ProjectionMonth = Bullish
Weekly = Bullish
Daily = Bearish
This is my Ghost Projection of what could happen in the future , Loads of bounces and retest , but moving higher and higher.

Projecting From Stability Continued: Desert CrossingBitcoin is 3 weeks into a period of extended price stability that encapsulates the final weeks of the bear market. Sentiment remains low and neutral. Recovery will be apparent over the next 1 - 5 weeks. New platforms, like Bakkt and markets have been announced and are planned to come online but positive news will not seem to substantially change prices.
A gradual parabolic breakout is not likely before June 2019. Significant price discovery has been established in this range and the bottom of a new channel has been established, but we may continue to test it. Continued growth is observed in institutional markets and new international markets.
Crackdowns on ICOs and altcoin speculation have kiboshed unchecked growth in alt markets, which continue to decline. BTC's market domination is over 50% of the total Crypto market cap. That number will grow over the next year.
Large leveraged positions against the altcoin markets still aren't available to most traders who operate in compliance with local laws, but they will be made available over the next 1 - 2 years.
Medium-term consolidation ends
Resistance to growth remained through the summer. Bearish and moderate performance was accompanied by price stability that is still increasing. Heavy resistance remains before bullish sentiment can return. Moderate performance is likely through the remainder of 2018, but I don't expect the price to exceed 9k any time this year.
New ATH sometime between March 2019 and December 2019
Heavy resistance is broken—drawn from the 2014 ATH and the December 2018 ATH—and moderate sentiment keeps bitcoin in a consolidation phase under the previous ATH for months. A new wave of adoption from new markets increases BTC volume to previously unimaginable levels. Full capitulation from alt market speculation exposes frivolous and or fraudulent crypto-assets and securities. Government crackdowns and arrests begin to pile up in alt market ICOs. Public outcry against abuse and fraud triggers international concern. Capital escapes from small alts to the top 5. There will be less than 15 cryptos with a market cap over 500 million USD. Additional speculation about the halving and institutional adoption lay the groundwork for a new round of irrational exuberance.
The ascending wedge drawn from the 2013 ATH is difficult to break
We bounce off an ascending wedge and establish a new ATH between December 2018 and January 2020. The bottom of the channel is not retested. Capital flight into BTC from alts eventually pushes bitcoin through the ascending wedge from 2013, which altcoin markets will likely never push through.
Bitcoin's adoption rate rapidly grows. It’s fueled by speculation; institutional adoption will try but cannot dominate BTC ownership. Speculation attracts a new wave of users who are disenchanted with traditional investments. Bitcoin's young male demographic starts to diversify and enter new markets internationally.
Lightning wallets become the standard BTC UX. LocalBitcoin processes 15 to 30 million USD in transactions daily. Press praises BTC as a tool ready for “Main Street.” A practical use case for lightning in retail businesses is implemented in some markets.
Bounce off the new long-term channel in early 2020
Speculative fever ignites and BTC markets observe substantial resistance for the first time since Dec 2017. The new ATH is somewhere between 100k and 220k USD/BTC and the correction triggers fierce new BTC obituaries from major institutions.
Hitting the top of the channel signals a medium-term bear market and moves prices into a comparatively moderate range, under 100K USD/BTC. Bouncing off the top of the channel completes before speculation about the halving takes hold of sentiment in early 2020.
1m USD price targets are commonly issued from established financial institutions by the end of 2021.
BTC: 3CX34Yg6o9GPNimDTF3e8UvYhm6QAmFX6N

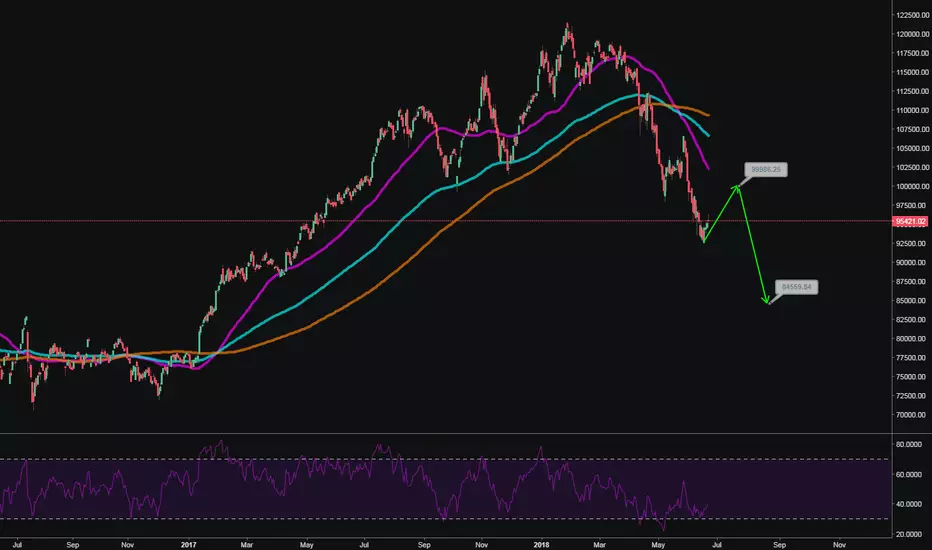
MUCH accumulation in BTC (WOW, CRITICAL TIEMS)Scaled and adjusted a bit around, seems to fit my correction curve that I placed months ago.
Lets get together and feel alright (R.I.P. BobMarley)

Projecting From Stability ContinuedCurrently
Bitcoin is 3 weeks into a period of extended price stability that encapsulates the last 25% of the bear market. Sentiment remains low and neutral. However, recovery will be apparent over the next 7 - 20 weeks. New platforms and markets will be announced or come online but positive news will not seem substantially change prices.
A gradual parabolic breakout from stability is likely after the next 7 weeks. Significant price discovery has been established in this range and the bottom of a new channel has been established, but could be tested. Continued growth is observed in institutional markets and new international markets. Major financial tools for institutions have been announced.
Crackdowns on ICOs and altcoin speculation have kiboshed unchecked growth in alt markets, which continue to decline. BTC's market domination is confirmed and will push over 50% of the total Crypto market cap soon.
Large leveraged positions against the altcoin markets still aren't available to most traders who operate in compliance with local laws, but they will be made available over the next 1 - 2 years.
Medium-term consolidation ends
Resistance to growth remained through June, July, and August. Bearish and moderate performance was accompanied by price stability that is still increasing. Heavy resistance remains before bullish sentiment can return. Sideways and comparatively moderate performance is likely through August and possibly through September.
New ATH sometime between November 2018 and June 2019
Heavy resistance is broken—drawn from the 2014 ATH and the December 2018 ATH—and moderate sentiment keeps bitcoin in a consolidation phase under the previous ATH for months. A new wave of adoption from new markets increases BTC volume to previously unimaginable levels. Full capitulation from alt market speculation exposes frivolous and or fraudulent Crypto assets and securities. Government crackdowns and arrests begin to pile up in alt market ICOs. Public outcry against abuse and fraud triggers international concern. Capital escapes from small alts to the top 5 - 10. There are less than 20 Cryptos with a market cap over 500 million USD. Speculation about the halving and institutional adoption lay the groundwork for a new round of irrational exuberance.
The red ascending wedge drawn from the 2013 ATH is difficult to break
We bounce off an ascending wedge and establish a new ATH between December 2018 and January 2020. The bottom of the channel is not retested. Capital flight into BTC from alts eventually pushes bitcoin through the ascending wedge from 2013, which altcoin markets will likely never push through.
Bitcoin's adoption rate rapidly grows. It’s fueled by speculation; institutional adoption will try but cannot dominate BTC ownership. Speculation attracts a new wave of users who are disenchanted with traditional investments. Bitcoin's young male demographic starts to diversify and enter new markets internationally.
Lightning wallets become the standard BTC UX. LocalBitcoin processes 15 to 30 million USD in transactions daily. Press praises BTC as a tool ready for “Main Street.” A practical use case for lightning in retail businesses is implemented in some markets.
Bounce off the new long-term channel in early 2020
Speculative fever ignites and BTC markets observe substantial resistance for the first time since Dec 2017. The new ATH is somewhere between 100k and 220k USD/BTC and the correction triggers a new BTC obituaries.
Hitting the top of the channel signals a medium-term bear market and moves prices into a comparatively moderate range, under 100K USD/BTC. Bouncing off the top of the channel completes before speculation about the halving takes hold of sentiment in early 2020.
1m USD price targets are commonly issued from established financial institutions by the end of 2020.
BTC: 3CX34Yg6o9GPNimDTF3e8UvYhm6QAmFX6N
moonmath.win

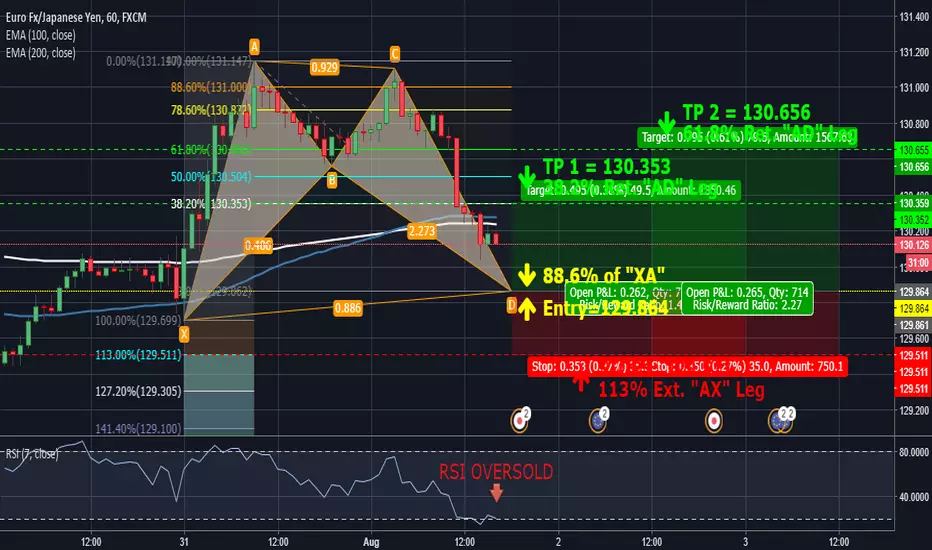
POTENTIAL BULLISH BAT - EURJYP H1Here is a PROJECTION of a Bullish Bat Pattern that I think is forming. All trade info on chart and also below.
* Please Note: I am new to sharing these ideas and charts, so if this is helpful, please Like & Comment and I'll continue to share the ones I find.
Trade Entry, Targets, & Stop:
Entry: 129.864 (88.6% Retracement of "XA" Leg)
Stop Loss = 129.511 (113% Extension of "AX" Leg)
Target 1 = 130.353 (38.2% Retracement of "AD" Leg)
Target 2 = 130.656 (61.8% Retracement of "AD" Leg)
Manage Trade = Take out half of position when Target 1 is achieved, move Stop Loss to Break Even, and let remainder run to next target.
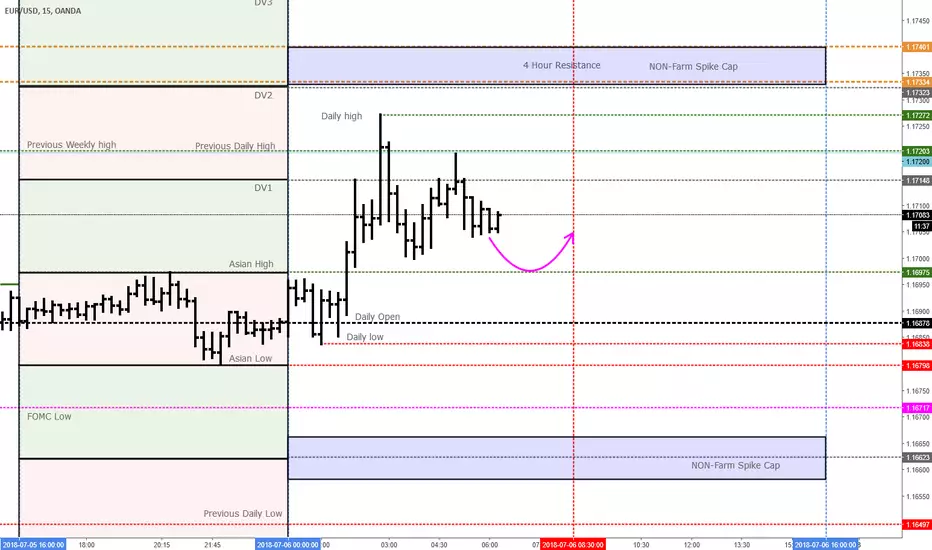
NON-FARM Spike Cap projectionsRange into 830 eastern time . Spike area caps up near 1740 topside and 1660 on the bottom.
ranges and projectionI refined the same two (2) graphs and imposed parallel ranges on key levels with arrows indicating rhythmic breakout patterns.

BTC The newbie study of it's patterns. Will it honor the past?Another newbie's attempt to see patterns on BTC charts.
See, all the yellow lines are the same size - of course the drops are a little different from each other, but ok. Nice uh?
The blue lines also, keeps a kind of same size too.
Then, I traced a projection line (also notice how the "after drop" moves up right to the old supports (now resistences) zones.
Again, it's just to study purposes, only to see if it will do it again, nothing more.

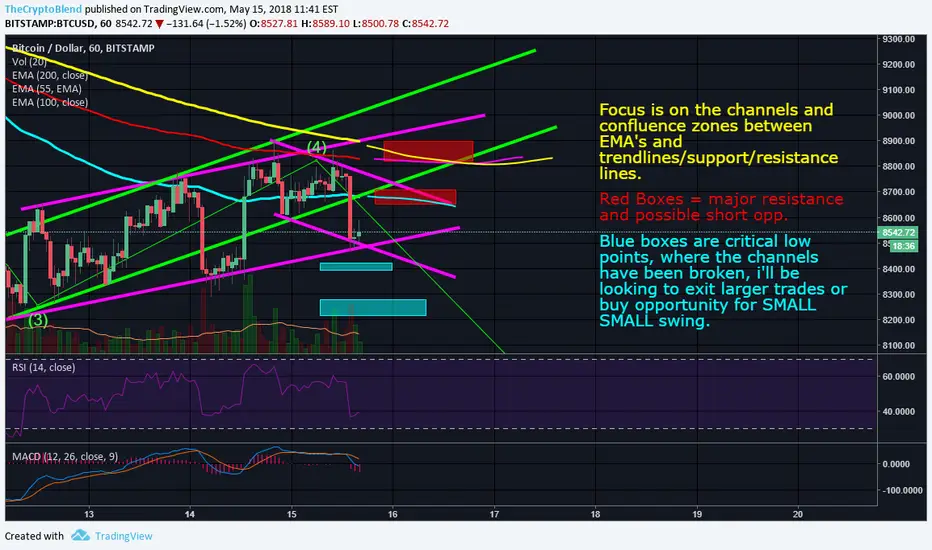
Bitcoin Projections: Things Are Looking Bearish!!!Hello Everyone,
With Consensus 2018 in the works we would have thought to see more bullish momentum in the market but that just doesnt seem to be the case. Yes, we are getting higher highs and lower lows but the sell volume is still very strong and we havent been able to get up and over 9k and establish support, I fear this next attempt will be our last if we cannot make it. Bitcoin is def. taking the stairs on this uptrend. :)
In my chart I've boxed the critical points I'm looking for to either short or go long. Because of the indecision and market sentiment I'm focusing on small swings in this channel as longer trades can easily result in being caught in a red waterfall from bitcoin.
If you have any questions please feel free to leave them in the comments below. You can search me in youtube under crypto hippo or join my discord channel for free daily updates on bitcoin as well as signals, news, education. --- literally everything crypto in one central location. Absolutely Free - bring a friend to gain access to premium channels for free to (147 dollar value)
Happy trading everyone, best of luck!
Bitcoin Projections: How I'm playing this CorrectionHey Traders,
I'm optimistically bullish until we drop under the .618 retracement line. With that being said this chart shows my expected entry and targets for how I plan on playing this bitcoin recovery.
This is a temporary play which is why i have exit targets and I'm not holding til a new high, As more data comes in i'll look at taking a re-entry position and aiming for new highs if that is what the market leads me to believe. stay tuned for that.
You can follow me on several social platforms under crypto hippo or the crypto blend. I create a daily video of bitcoin for those of you who would prefer videos instead of the charts I put on tradingview here.
Thank you all for your support and comments and please follow if you enjoy the simple, yet effective charts I put up.
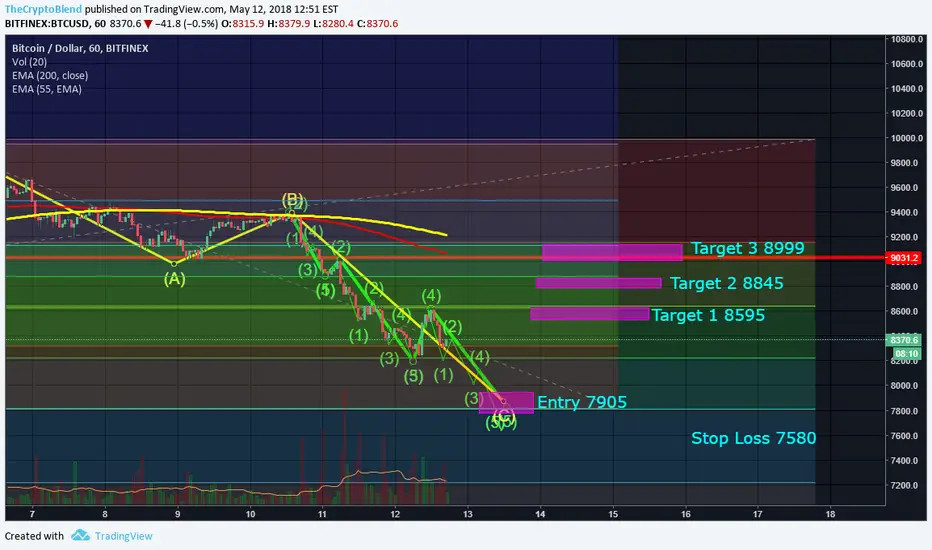
Bitcoin Projections: The END is NEAR!!!Hey Everyone.
looking at our expected daily update of bitcoin today and we can see the correction is playing out in tune to our previous charts. I highlighted critical points that would determine if the correction would play out deeper or if we were looking at a potential larger elliot wave playing out in the bulls favors.
We saw divergence in the volume vs the climb on the chart that confirmed we'd see an expected drop lower. Sign #1.
We are seeing that same divergence with the attempted retrace right now at 8600 which supports my belief we will drop further shortly out of this bear flag thats forming on the 1 hr chart.
Lastly, our end of Wave C projection is most likely 8100 to be a safe bet, and even 8300 is a safe entry i'll start stacking my longs at. A drop below 7900 should be worrisome and is worth looking at bitcoin agian to check indicators on whether we may be downtrending at that time rather than just experiencing a correction.
Hope this helps> As always, this is not financial advice. :) Take care and best of luck traders.
Look me up on Youtube

Possible count for BTC/USD (Bullish)One of my possible counts for BTC
This is my bullish count where BTC has 3 potential plays:
- If $8818 holds we will see W2 (pink) completed as a deep retracement
- If $8818 doesnt hold we may see a 1:1 Extension from A-B (green) which would turn out to be a double bottom
- If $8818 doesnt hold we may see the price bounce between the $8500 - $8760 region (orange)
Projection roughly: $8500-$8760
Let me know what you think!

Possible count for BTC/USD (Bearish)One of my possible counts for BTC
This is my bearish count where BTC is forming an expanded flat
Projection roughly: $8300-$8550
Let me know what you think!

It looks like bitcoin bear market hasn't endedIf BTC doesn't break above the 200 day SMA it is goin to go much lower in my opinion.

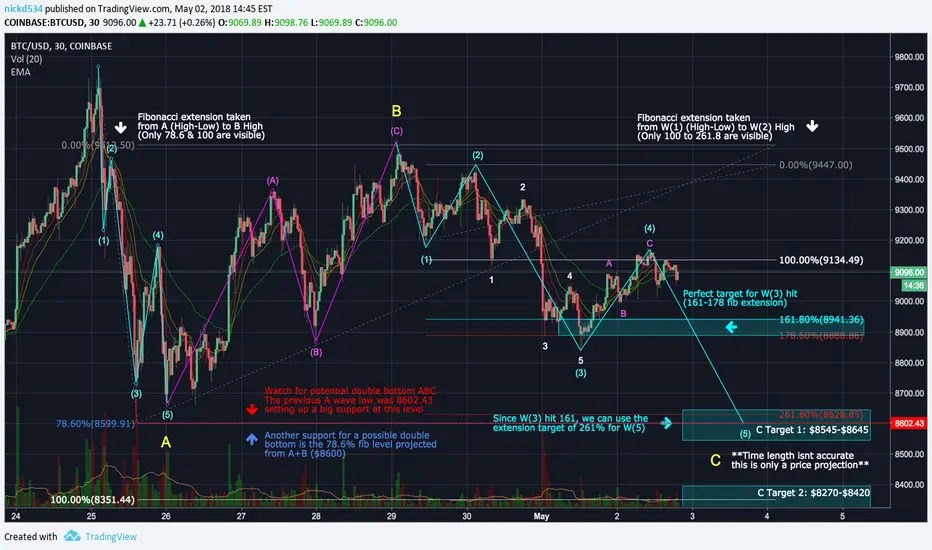
BTC/USD ABC Correction Bottom?There have been many different counts for BTC within the past week or so.
I believe it to be an ABC correction still. Noting back to my previous chart i posted, the length of that ABC after the 5th wave was just too short to be a full correction in my opinion.
Here we are with my full count and final wave of the ABC! I believe that we are on the C wave and the final subwave within it.
Using fibonacci extensions and elliott wave to project my targets i managed to come up with 2 very possible targets.
1st Target: The Double Bottom ($8550-$8650)
- Using fibonacci extensions from A & B to establish certain points of support/resistance i found the 78.6% level to be almost exactly the low of the A wave
- This will provide more support at the $8600 level
- Then taking into account the fibonacci extension from subwaves (1) & (2) in the larger C wave i found that subwave (3) hit a perfect extension into the 161.8% - 178.6% pocket
- Usually in Elliott Wave theory when wave 3 hits 161%, we can use the 261% extension as a valid target for wave 5
- If we target the 261% fibonacci level, that brings us to $8628 ($30 off the previous low)
- This creates more confluence and adds support to this area
- For my 1st target i gave it a $100 range between $8550-$8650
2nd Target: The 1:1 Extension ($8270-$8420)
- In Elliott Wave theory, ABC corrections a general guideline for C wave is a 1:1 extension of A
- Using fibonacci extensions from A & B to establish an area for C wave to hit a 1:1 extension of A is around $8351
- In order to hit this area, $BTC will need to break through the previous supports at the $8600 level
- If we see a break past my target 1 projection range, then we will look for the next valid support level which is the 100% fib level at $8351
- Using fibonacci extension from subwaves (1) & (2) in the larger C wave, i found that the 361% extension level was at $8316 ($35 off the A-B 1:1 extension level)
- This provides more confluence to this area
- If wave 5 goes past the 261% extension, our next valid target would be the 361% area
- With these values and confluence found, my 2nd target has a $150 range between $8270-$8420
Please let me know what your opinion is.
If you have any suggestions or feedback, please leave it down below.
*This isn't financial advise, do your own research*
**Once again this is just a price projection so the targeted dates are not accurate**
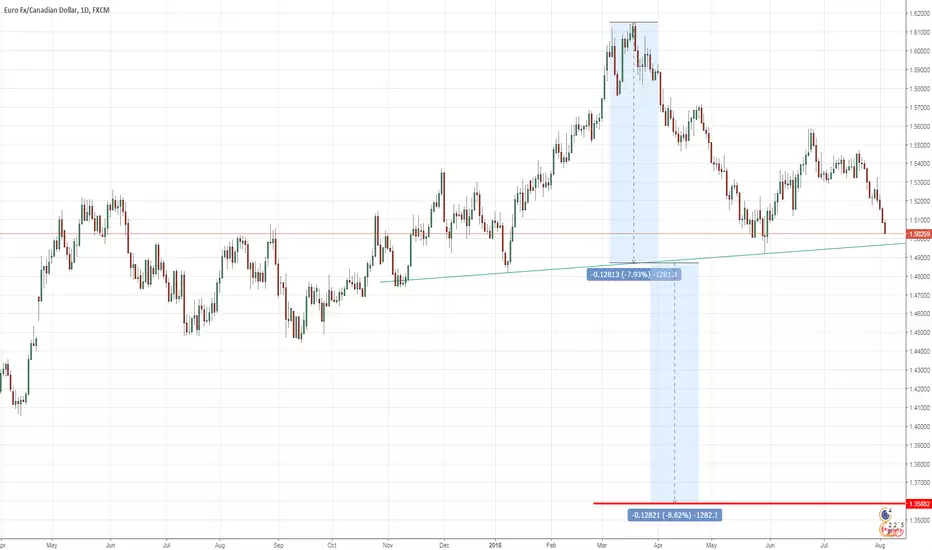
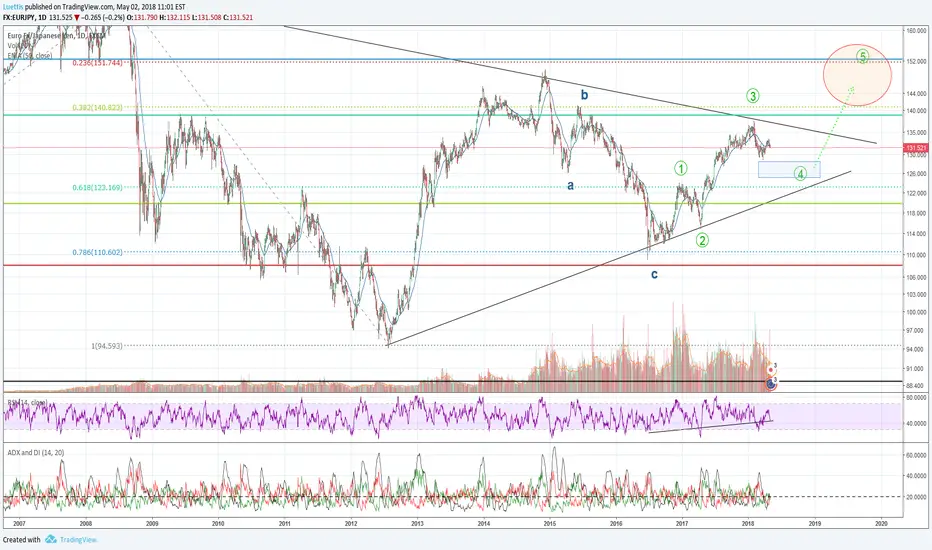
Euro - Yen forecastAn interesting chart for the EURO - YEN pair.
The pair is within a symmetrical triangle - the upper side the beginning in 2009, the lower side the beginning in 2012.
In 2014 the price touched the upper side - this was the beginning of the ABC-correction.
In 2016 it tested several times the lower side before climbing up to the peak of wave 1 of the motive waves.
Wave 2 tested the lower side another time in 2017 before climbing to the upper side of the triangle - forming the turning point of wave 3.
Actually we´re in wave 4 - perhaps it´ll continues to lower prices before turning and rising again (area marked with a rectangle).
The next rise will be wave 5 and this wave will lead the price out of the triangle, breaking also resistance at 61.8% (139 Yen to Euro) and leading to a new hight. I´ve marked the target area with a circle.
Indicators:
RSI: in bearish zone and perhaps shortly before crossing the trend to bottom
ADX: neutral
Projection for currencies are more risky than for equities - statisticly 80% are wrong!
Stop :
If the pair is leaving the triangle to the bottom and / or is breaking the support of upgoing fib retracement 38.2% (120JPY).
OMGUSD (OmiseGo) 1hr tf chart patternThe meandering price action of OMGUSD (OmiseGo) based on its 1hr tf is captured in this analysis using an ascending triangle chart pattern. The width of the triangle (vertical black arrow) is ~$9.82 - $7.92 = $1.90.
Possible target area for price after a breakout above the horizontal line of the chart pattern involves vertical projection of width of the triangle (calculated above) onto a breakout above the horizontal line. Doing this, a breakout above the apex of the triangle could see OMGUSD hit $11.72 (Target area).
The alternative chart pattern that is also described by the same price action for OMGUSD would be a complex, inverted Head and shoulder pattern (not shown in this post). For this pattern to be confirmed, price action would have to close above the neckline of the pattern. The neckline in this case is also the same as the horizontal line of the ascending triangle chart pattern.

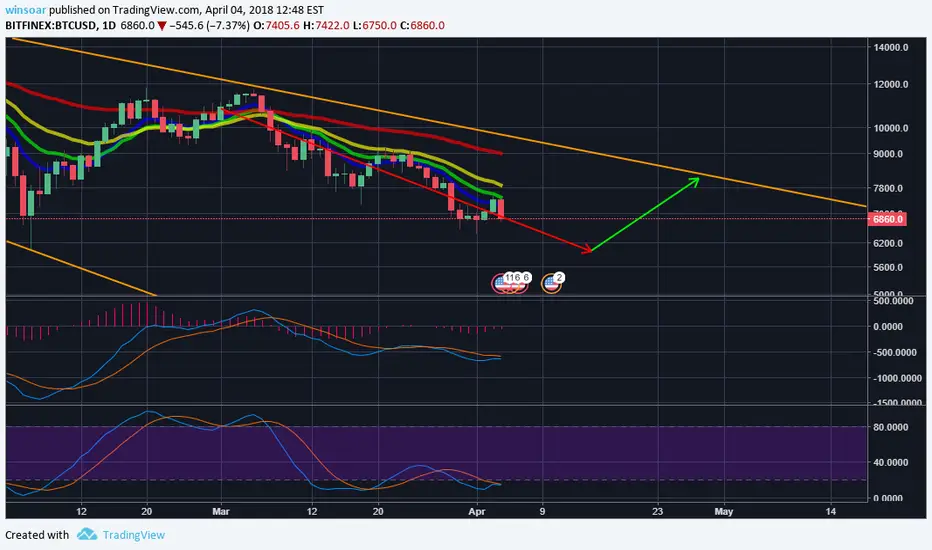
Bitcoin to drop to $5,980 before rebounding to $8,073I forecast that the price of bitcoin will drop to the previous support level of around $5980 USD, before gradually making its way back up to the resistance line of around $8,073 where the price will then change direction again unless the bulls can break through this line of resistance, in which we could see a return to a bull market.
Like this post if you agree, and follow for more tips like this.
NOT FINANCIAL ADVICE!