EURUSD - SOME MORE DOWNHi traders, my EW analysis for EURUSD is pointing one more leg down on the 60m/240m structure.
Please note, this information doesn't constitute investment advice, and isn't created solely for qualified investors.
Projection

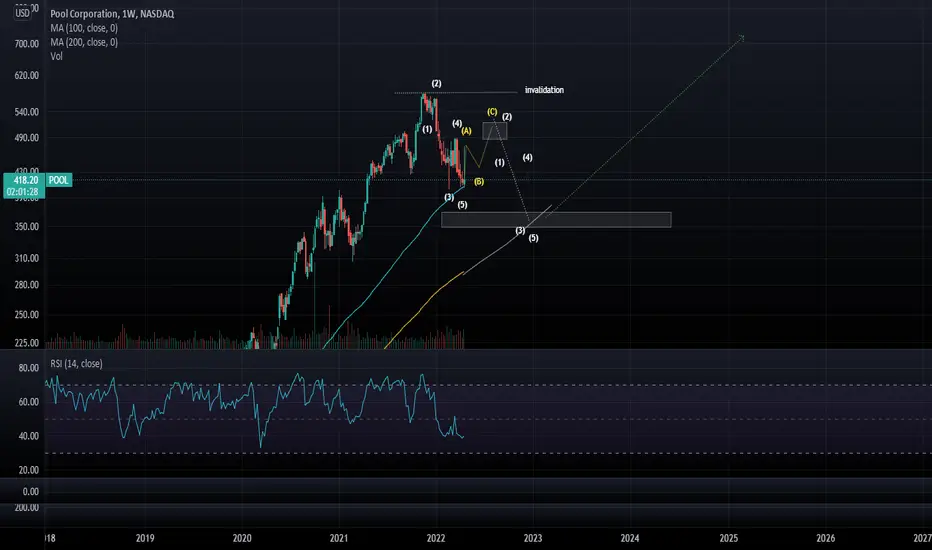
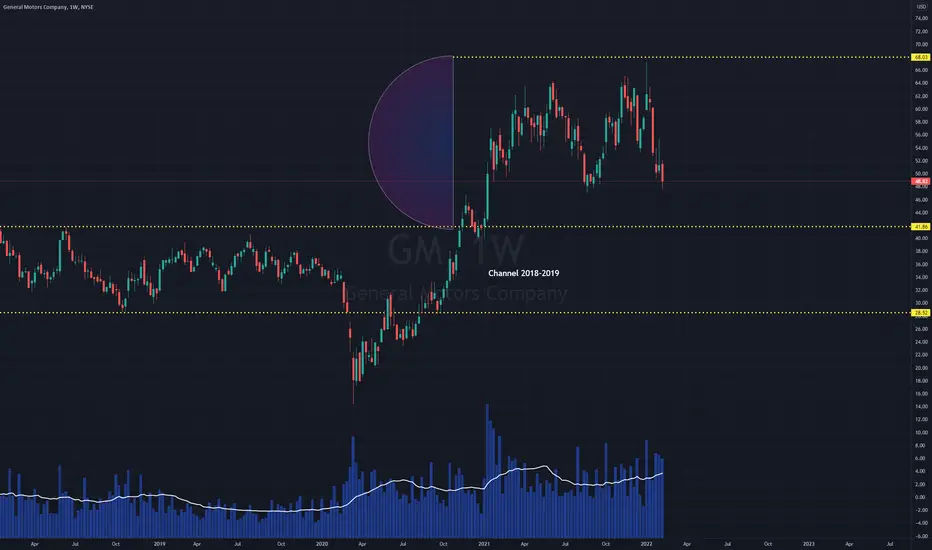
POOL (Elliot Wave Analysis) Shows a clear impulse down, similar to many other stocks like netflix. I think it will be do for a rally up in 3 waves and I will expect it to fail and start another leg of 5 wave move down.
It just so happens to match the 200MA on the Weekly chart at close to $330-$350 range. Time frame would be during this year and as long as beginning of 2023 for completion of the correction.
not a financial advice
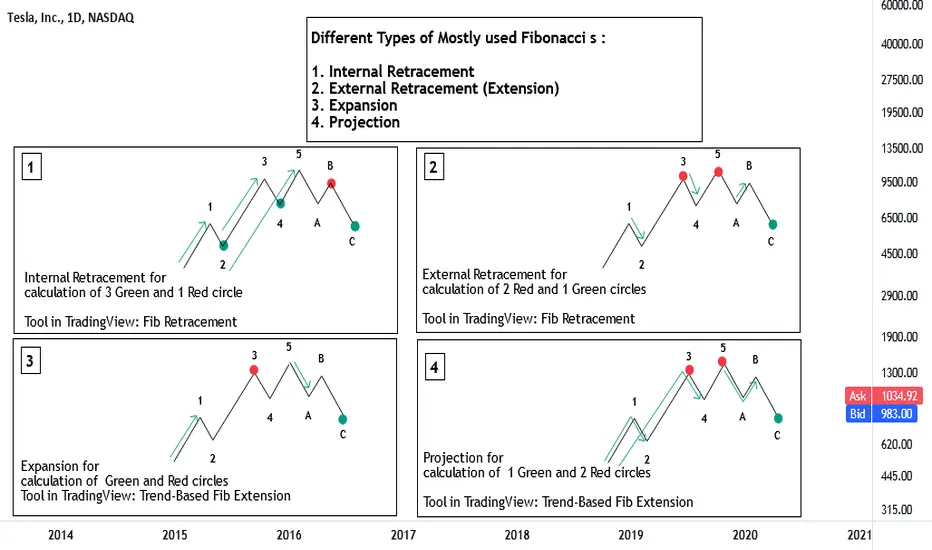
How to use different types of Fibonacci in TradingViewWave Relationships and their relation by Fibonacci Ratios are among the most helpful tools for target prediction.
There are different types of Fibonacci and different tools with different names in different software packages. This may make users somehow confused . Here, we try to shed some light on various mostly used Fibonacci types and explain their usage for target prediction. Also we explain their related tool in TradingView and their way of implementations.
As shown on the chart, there are four main types of Fibonacci :
1- Internal Retracement
2. External Retracement (Extension)
3. Expansion
4. Projection
Before going through details, it is worth to mention that knowing wave relationships is a key to implement Fibonacci tools accurately. Different types of wave relationships is beyond the scope of this publication. Here, for simplification, we show most simple type of wave cycle which is ascending complete cycle with one 5 leg up impulse and one abc form of correction . Also, we try to explain more typical Fibonacci Ratios for target prediction and skip less often ones.
1. Internal Retracement:
This is simply for calculation of the amount of correction in the main trend. It means we can predict where a counter trend correction may end.
As shown on the chart, it can be used for target prediction of wave 2 and 4 in an up trend and also wave B in a down trend. It can also be used for calculation of end of wave C which is the end of correction of whole up going wave. Green arrows on the picture show the direction of using this tool which is "Fib Reracement" in TradinView. For example, we put first point at the start of wave 1 and second point at the end of this wave for obtaining possible targets for wave 2 and so on.
Wave 2 can end at 0.382, 0.5, 0.618 and 0.786 Fibonacci Retracement levels of wave 1. Fibonacci levels at which wave 2 ends can send us a signal about the amount of next waves. This is again beyond the scope of this publication.
Wave 4 can typically end at 0.382 or 0.5 Retracement of wave 3. Less and more amount of Retracements are also possible, but those make wave relations more complicated and does not match with our simple shown example.
Wave B typically corrects 0.382 , 0.5 and 0.618 of wave A in a simple zigzag correction. More Retracements signals for more complicated corrections e.g a flat correction.
Wave C Retracement levels are similar to wave 2 in shown wave cycle since it is end of a larger degree wave 2.
2. External Retracement:
This Fibonacci which is also called " Extension" can be used for calculation of end of wave 3 or 5 in an up trend and end of wave C ( which is end of whole correction) in a down trend.
We have same tool as internal retracement in TradingView however ,unlike internal Retracement, an extension should be drawn from a high to a low in an up trend and vice versa as shown by green arrows on the related figure.
Wave 3 Fibonacci Ratios by extension depends on the amount of wave 2 correction. For example, 1.618 or 2.618 extension of wave 2 can be the target for wave 3. Robert. C. Miner has proposed a very useful table for targets using external retracement.
Wave 5 typical targets are 1.272, 1.414 and 1.618 extensions of wave 4. This ratios are also the same for calculation of end of wave C.
3. Expansion:
Based on my experience, Fibo expansion is most useful when we have over extended waves for example over extended wave 3. In this case , 1.618 or even 2.618 Fibo levels can be the typical targets.
Related tool in TradingView is Trend-Based Fib Extension. Please note that this tool in TradingView is a three point Fibonacci while expansion is two point Fibonacci tool. Therefore, Implementing this tool for obtaining Expansion levels is a little tricky. For example, for calculation of wave 3 we should put first point at the start of wave 1 and double click on end of wave 1.
There are also more details in implementing Fibo expansion for example we have different types of Fibo expansion. We can skip details here to keep this publication as simple as possible.
4. Projection:
This is the only 3 points Fibonacci that we have. Some software packages call this Fibonacci as Expansion !!. Its related tool in TradingView is Trend-Based Fibo Extension. It is a very useful tool for calculation of end of wave 3, 5 and C.
Again green arrows show how to use this tool . For example, For wave 3 target calculation we set first point at the start of wave 1, second point at end of wave 1 and third point at the end of wave 2 or start of wave 3.
1.618 and 2.618 Fibo levels are typical for end of an extended wave 3 when using Fibo projection.
100 % Projection of wave 1 from low of wave 4 is a typical one for end of wave 5 target. Also 0.382 or 0.618 projection of wave 1-3 from low of wave 4 is a helpful ratio for wave 5 target calculation.
For a wave C, most common projection is 100 % of wave A from top of wave B.
How to make a Potential Reversal Zone ( PRZ) :
We can make our potential reversal zone stronger by combining all proposed tools . Take another look at the figures. What can we see? yes. We know four tools now for calculation of end of wave C. Suppose how strong a possible buy zone can be when 4 different tools suggest it as potential reversal target !
Hope this to be helpful. Please do not hesitate to ask questions if you feel need to ask.
Good luck every one.
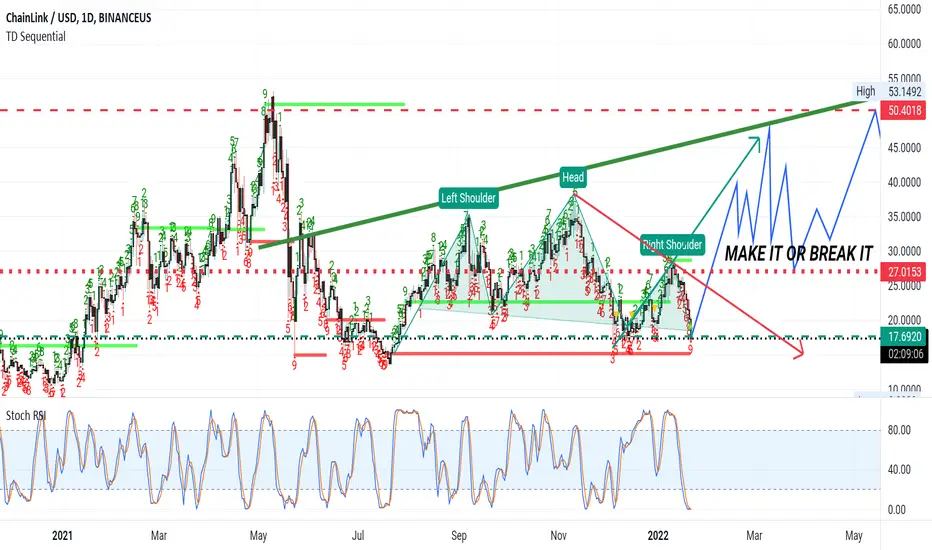
MASSIVE SHOULDERS ON CHAINLINKAre we ready to pump it up? Chainlink is now retesting lowest support $18-$17. Is this the beginning of a new chapter for chainlink? Let's hope so. I feel we have a Ton! of support in this area to not go any lower. $50+ for Chainlink coming to us this summer??
BTC CRASH Around March 11th-12th, Market Maker Btc ProjectionThis is my projections of the roller coaster ride the Market Maker will put us on in the coming future. many restests and going back to swallow up liquidity.
BTC For anyone who is interested... most probable, NO FUD Its a pattern that we have seen before...enjoy and happy trading

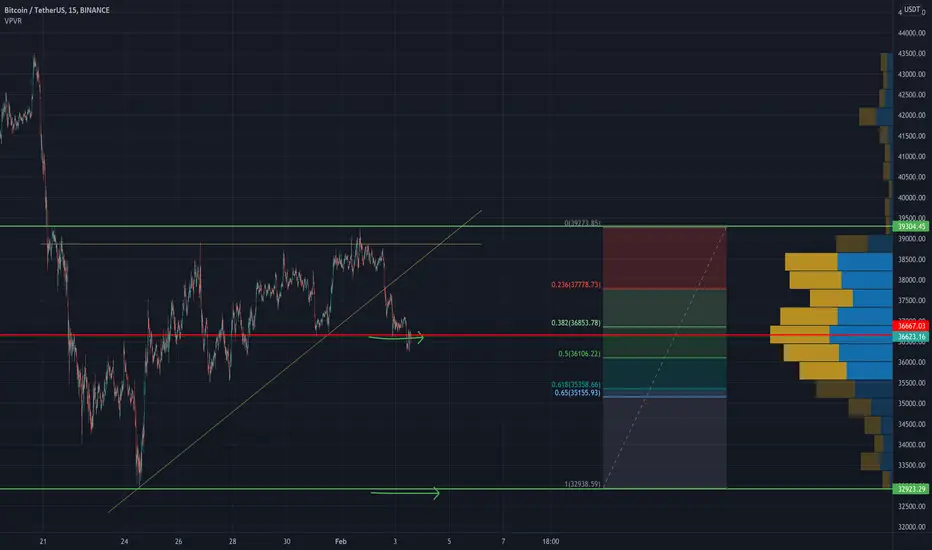
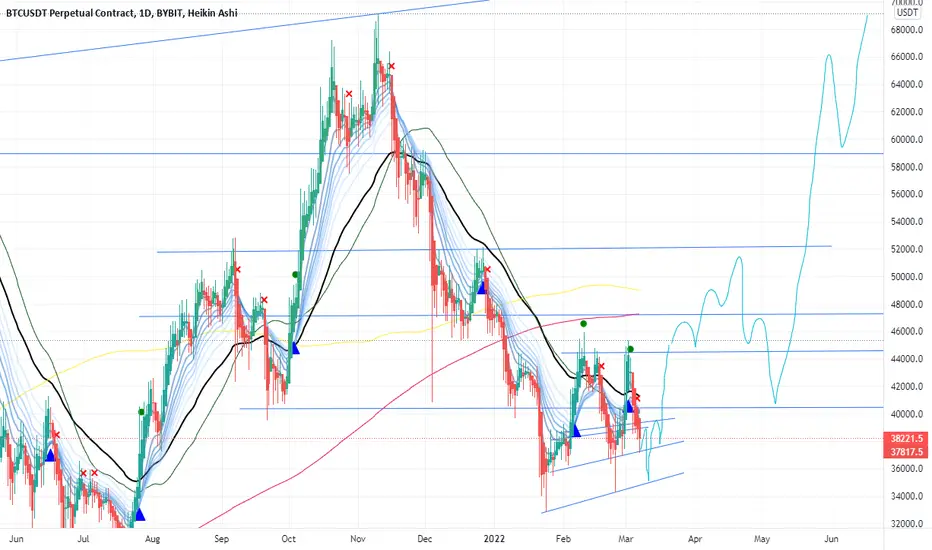
BTC TA for the coming daysHey guys and girls, what's up
my TA for BTC for the coming days.
The thick grey lines surround value areas.
The "zones of interest" are areas where concentrated volume has taken place, which attracts price.
The green zones are FVG zones which attract price.
Since it is weekend, trading is extra uncertain, but I am thinking there is a good chance we go up to that FVG zone after just hitting an NPOC and flipping it to a POC. Not too sure if we break the psychological barrier of 40k, but if we do then I think we will be touching the FVG line.
We just flipped an NPOC to a POC which triggered my TP for my short and I'm long right now. We'll see how this idea turns out.
NFA! ;) just an idea :)
I'm off to bed. bye all!
oops. as im typing this, the candle turned bullish hahah. We were at 39k when I started typing, 39.4 now. Upside potential increased significantly for now but of course its all about the close and we know how those last ten minutes can be ;)

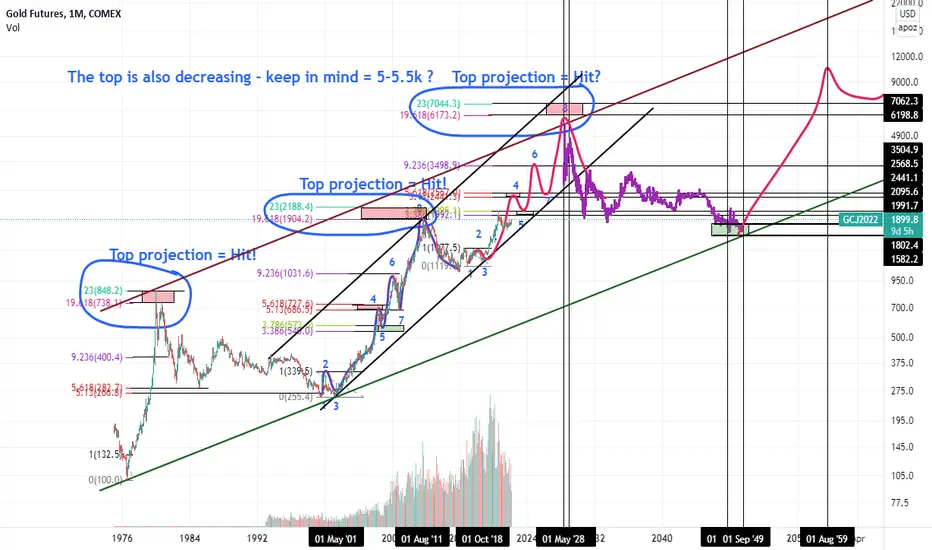
Gold - Super long term projectionThe super long term projection is just having fun with charting. But the projection for the next top could play out because it has done so the last two time. It is decreasing so may almost make it the target box but be short by a little. The current runs projected moves are base on the last bulls fib levels. The levels are going to be off but am more confident on the 5-6k as the top for this bull cycle. Lots of other charting long term gold pricing are getting to about 6k with different studies = confluence is good sign. Good luck, have been on board from 2019. Just my thoughts.
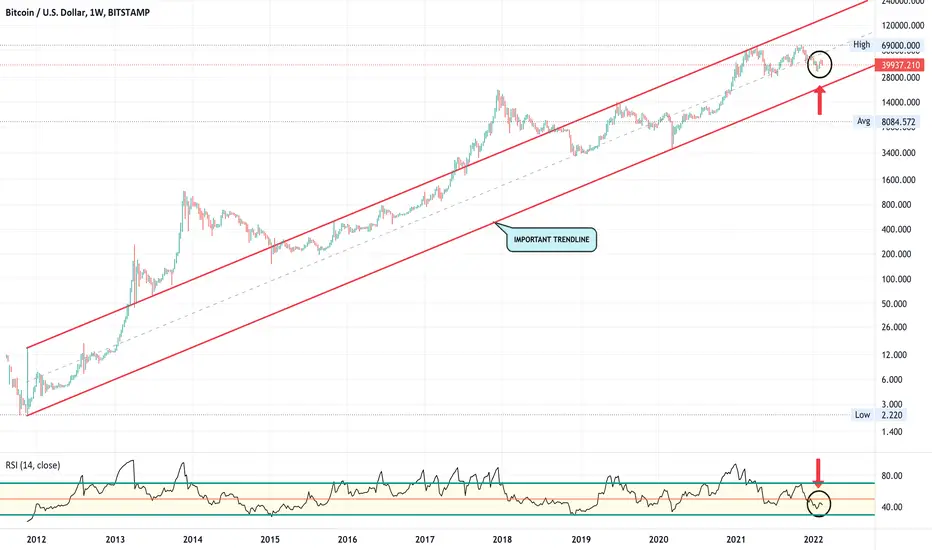
UP or DOWN, what do you think?On weekly chart,
- Negative signal RSI, BTC need a positive divergence signal.
RSI < 50, BITSTAMP:BTCUSD down in range 70-80% from ATHs.
Right now, BTC just downed more 50%. So it's done? Maybe not yet.
But when zoom in
BTC has been downing more 35K equivalent to previous times. If the decreasing has done, BTC comes back to the race go up to 79K.
Unless, we have a support at 20K.
Time will tell!
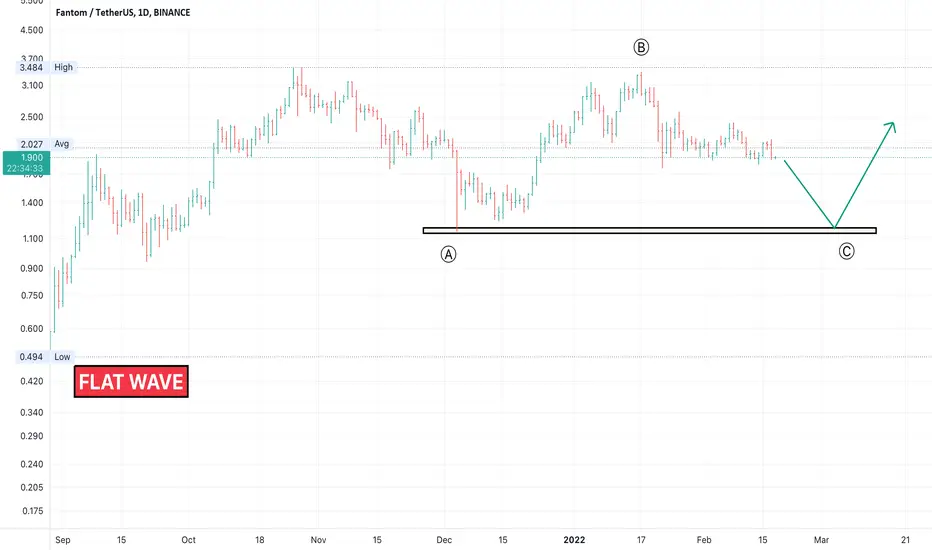
[UPDATE] Flat Wave Fantom - $1.7On daily chart, BINANCE:FTMUSDT has been creating the flat wave ABC with target of wave C around 1.7 dollars.
4H TF:
FTM is in descending channel
Seem fourth wave has been done at 2.41 after that, fifth wave is happening to back to 1.7.
Wait and see.
If my idea is helpful, hit the like button. Appreciate 🙏!
Projection BTC-USDTPure speculation about BTC-USDT.
I have noticed that each of the first two "consolidation blocks" took 14 days. So this leads me to wonder: will the current consolidation block also last 14 days?
If so, we can expect price to move out of that consolidation block on the 19th, either to the upside or downside.
Not a prediction, just an idea. I know these patterns don't necessarily repeat, however I thought the similarity between the first and the second block was striking enough to highlight it as an idea.
If you like the idea, give me a like :)
Enjoy your evening!

SLP TO THE MOON WAVE 5 EXTENDEDthere u go slp to the moon
this is the part 2 of our previous chart
my first chart is invalid
heres the updated count


SLP TO THE MOON WAVE 5 EXTENDEDlets see if wave 5 is extended
this is not financial advice trade at your own risk

Breakout + or - for Chainlink Here's a simple idea on chainlinks Breakout ( red circle ) keep an eye on support and resistance marked in this graph. If it drops it could go to $10.

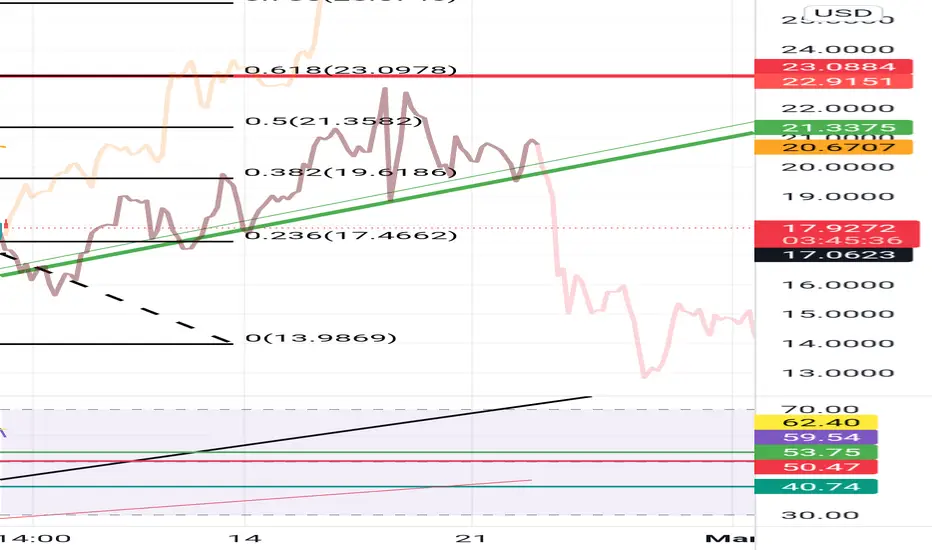
AN IMPORTANT GOAL OF $23 INCOMING FOR CHAINLINK Currently sitting at the very bottom of an under-sold status on the,monthly RSI chart. Chainlink is getting ready to peak out above the negative trendline. Looking back at the daily chart, we may have found our support for further momentum upward at or near $17. This is showing our next hurdle on the 4 hr chart is going to be $22-$23 for link to assume new support at this level. I honestly see Chainlink moving further upward and this may be the last time we will see its $14-$16 price tag. Good luck and happy trading

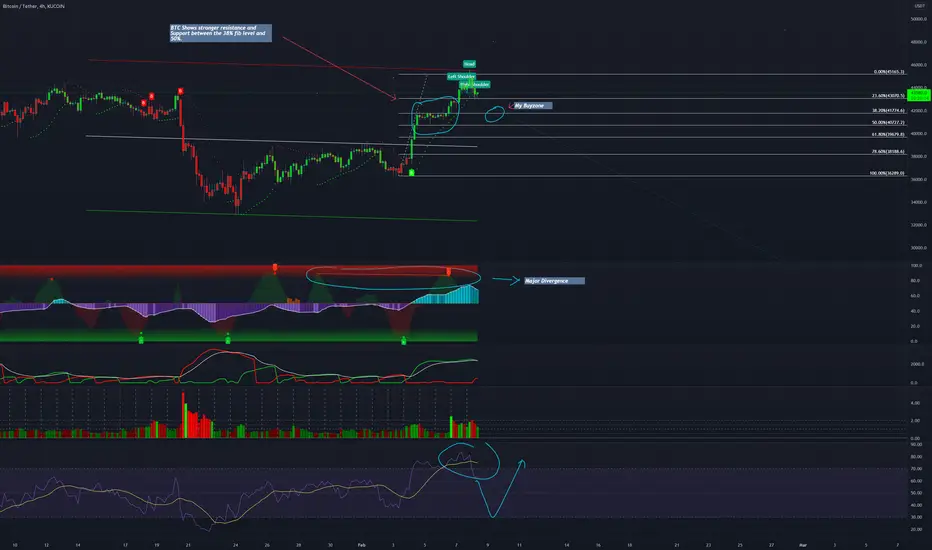
IT's Time To Bounce ( With Actual Technical Analysis Content)NOTE: ZOOM OUT TO SEE ALL THE WAY BACK TO AUGUST 2021 to make sense of this
Here we are... in the mixt of the most infamous parts of the crypto market cycle: The Start of a massive Bull Run. As we finally hit the first major retracement level. The question stands? Where do I buy? Where (too late now) would I short to? Where do I put my stop loss?
Here is what I see:
1) Slight Head and Shoulders pattern forms in area around reversal, indicating bearish impulse.
2) BTC ranges between the 50% fib and 38.2% fib for a few days of time. This tells me, that 50% line will most likely serve as the pivot point back upward. I would put my stop loss probably somewhere in the middle of the 50% and 38.2% zone but beware of stop loss hunting that will likely occur before the up-swing. If you are margin trading, I would recommend setting a buy zone in that zone as well to counter the effect of a potential hunt.
3) Historical situations show that most of these retracements tend to occur with similar fashion. I have zoomed out (zoom in on specific current zone and August 21st, 2021 zone for comparison.)
In comparing the zones: Notice the similar structure of the initial breakout/retracement pattern occurring in bot areas.
**This does bring me to the point of addressing how this comparison does not line up with my last point. This is because this time period showed more resistance between the 23.60% zone and the 38.20% zone while the current shows what I mentioned before. Things may be similar, but rarely identical in this time and age.
4) The aforementioned zone in August 2021 shows a similar behavior as we analyze wave trends. We see a two pretty large impulses followed by the retracement period and as seen in August, that leads to an even larger breakout.
5) RSI typically dives down to get close to or touch off the 30% line leading into a bullish swing upward.
I'm pretty certain that we are approaching a very clearly bullish segment after a cold crypto winter.
Make a move, make some money.
Chainlinks future performance This will chart chainlinks performance on a 4 hour chart
The orange line represents the highs 200 days ago today and the black line represents the highs 100 days ago today.
I placed them along the current highs as of 1500 hours today. This is just done out of morbid curiosity.
this ev and self driving giant stands to appreciate (TSLA)the rest of the ev and self driving market should bounce, and this should cause the individual stock to bounce.
if we break this tightening bottom bull it should spring up to upper 990s

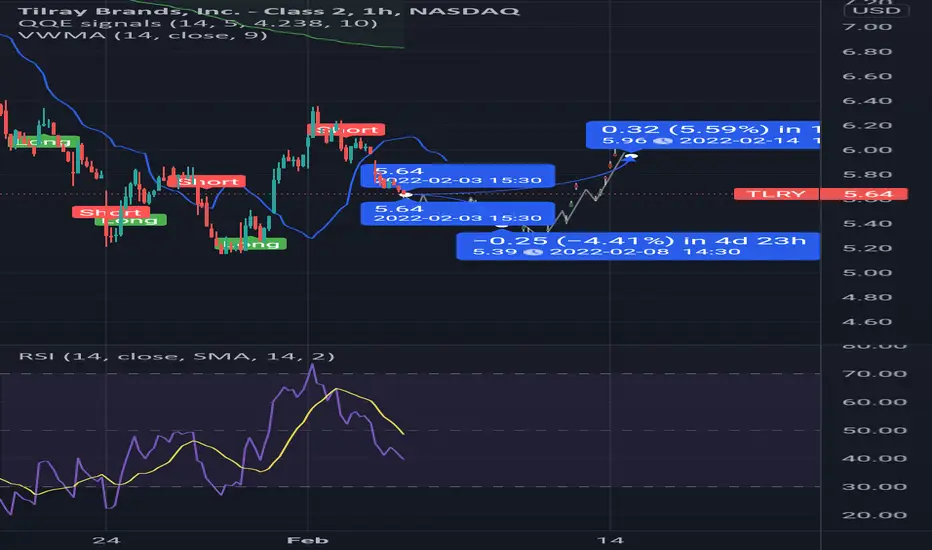
marijuana could be exhausted to the downside soon (TLRY)tilray brands is another one of those stocks that has seen booms, and since declined to an extreme. we are far from changing the daily trend, but the hourly turn around looks like longs could take a whack at the lower 5s and upper 5s trading in the range that they are with a potential sell climax.
Hold 35.2K at all costsTarget 1 was reached accurately: 36.5K
Now if we managed to hold the 35.2K level which is exactly the golden pocket fibonacci retracement then a bullish move to above 40K becomes more likelihood.
Breaking the support box of 36.5 to 35.2K would take us to the next target which was below 33K.