HBAR / USDTBYBIT:HBARUSDT
### 📉 **HBAR/USDT 4H Chart Analysis**
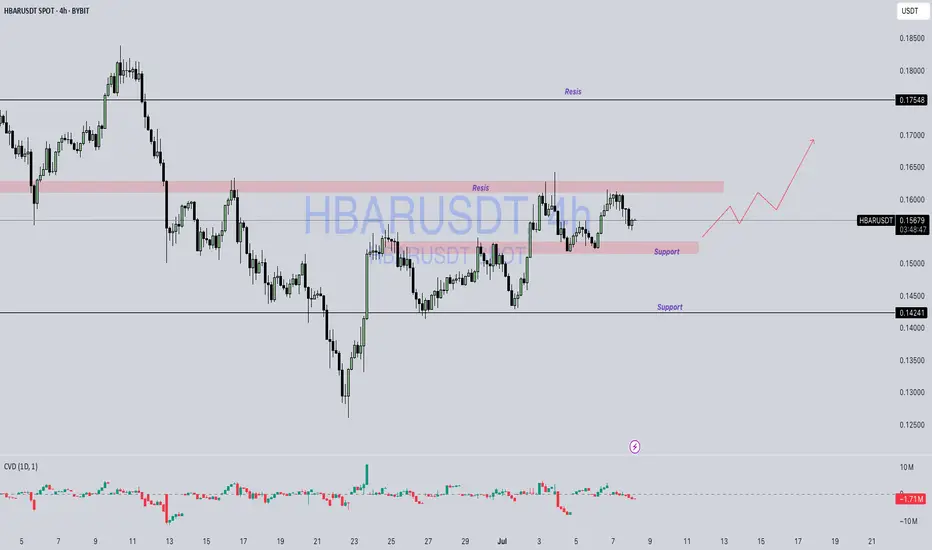
*(As of 0.15684 USDT)*
---
### 🔼 **Resistance Zones:**
1. **0.158–0.160 (Local Resistance):**
* Multiple rejections in this zone.
* Price currently struggling to break through.
2. **0.17548 (Major Resistance):**
* Strong historical level.
* Acted as a turning point previously.
---
### 🔽 **Support Zones:**
1. **\~0.150 (Local Support):**
* Recent reaction area.
* Price found temporary stability here.
2. **0.14241 (Major Support):**
* Strong reversal zone in previous sessions.
* Significant demand was seen historically.
---
### ⚙️ **Price Behavior:**
* Market is in a **sideways consolidation** phase.
* No breakout or breakdown confirmed.
* Structure is developing between support and resistance boundaries.
---
### 📌 **Key Observations:**
* Lower highs forming near resistance may suggest hesitation.
* Consolidation can often lead to stronger moves once direction is confirmed.
* Watching volume and reaction near key levels is critical.
---
> **Disclaimer:**
> This analysis is for educational and informational purposes only. It is **not financial advice**. Always do your own research (DYOR) and consult a professional before making any trading decisions.