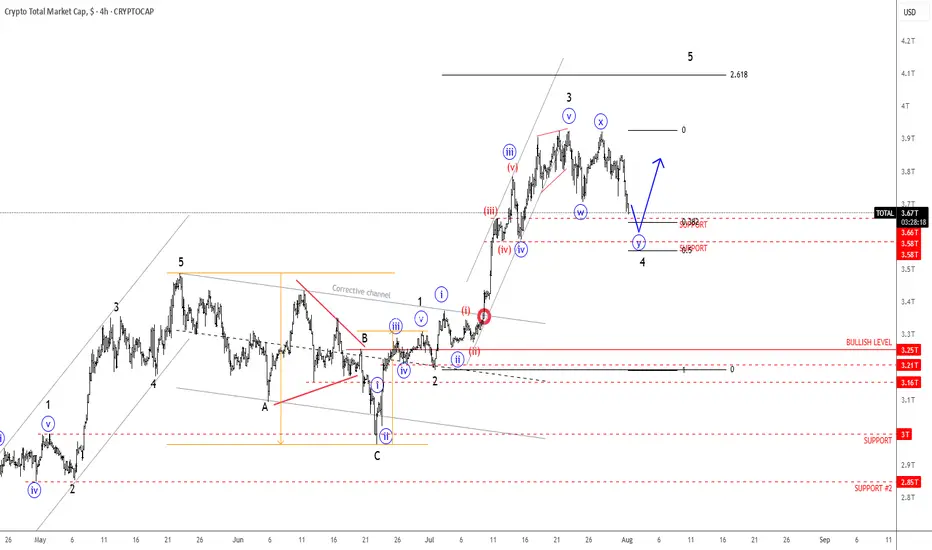
Crypto Market Slows Down For A Pullback Within A Bullish TrendGood morning Crypto traders! Cryptocurrencies are coming slightly lower on the intraday basis due to stock market decline yesterday, but we still see them approaching support, so still be aware of a bounce and recovery at the end of the week or maybe next week because of an upcoming weekend. Crypto TOTAL market cap chart can be trading in wave »y« of a complex w-x-y correction in wave 4, unless it's a flat correction, but support is the same at 3.6T – 3.5T area, from where we may see a bullish continuation within wave 5.
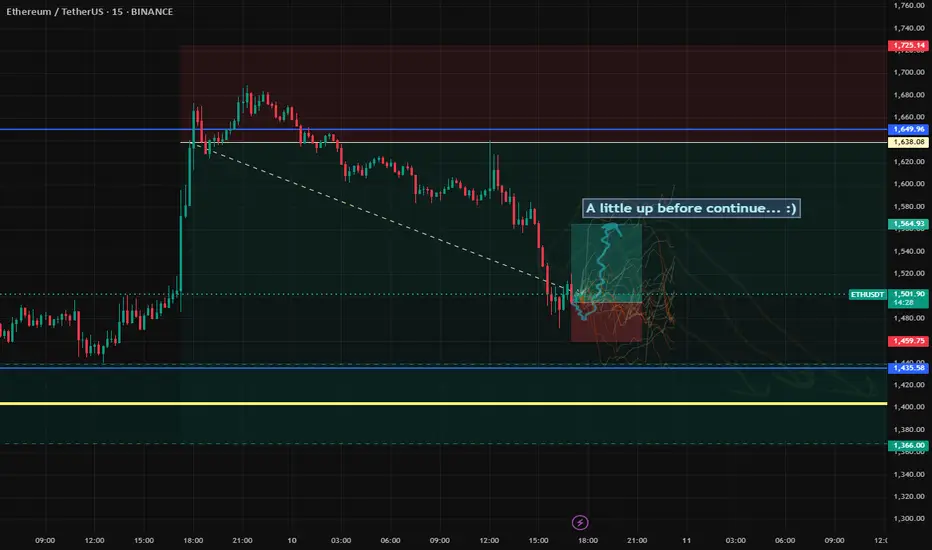
Pullback
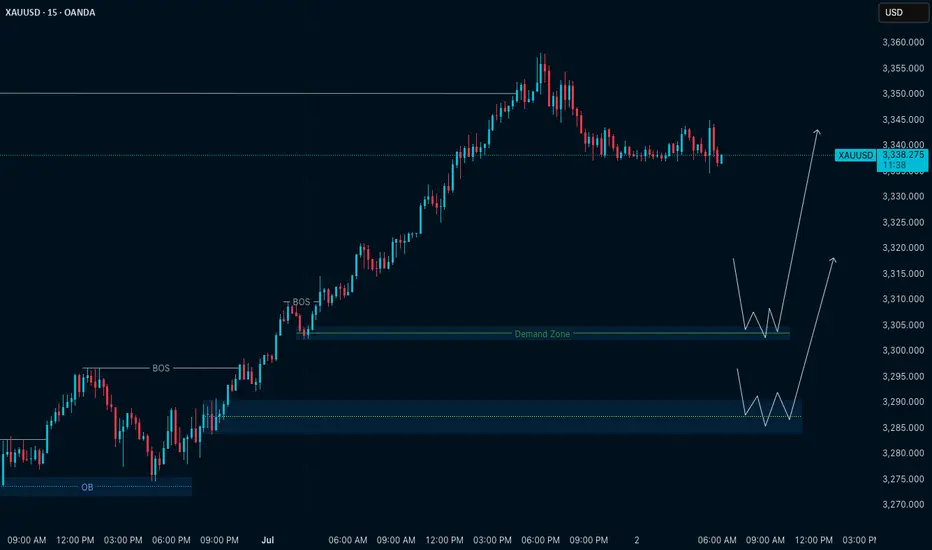
The Gold Retrace for Ultimate Entry!looking for price to continue with its pullback to find where exactly support is. Once we see price establish support we should get some type of signal for entry and price can continue with this bullish price action to make new highs. If we get a full 71.8% pullback that should make for a nice bull run. Just need to wait for the confirmations first before reacting cause we might get a lot of chop until then.

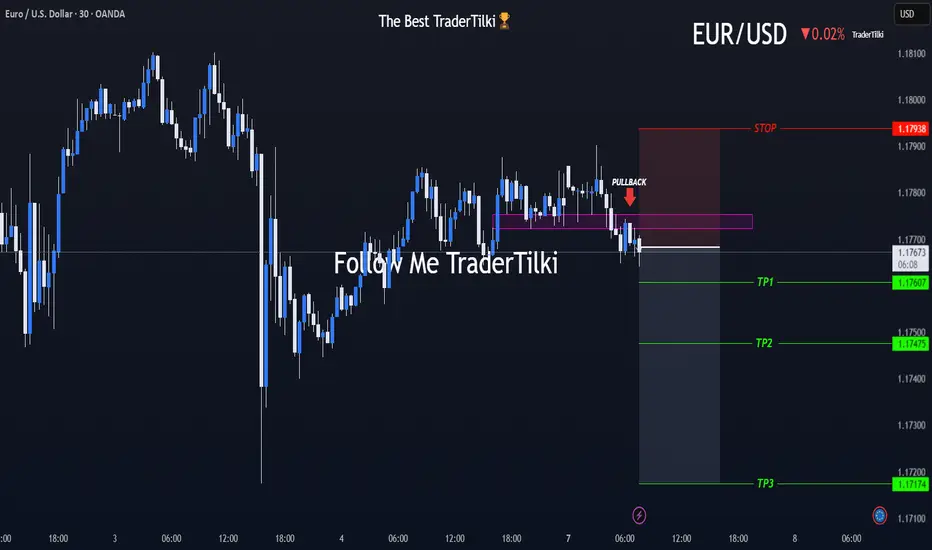
What’s EURUSD Telling Us on the 30-Minute Chart?🌅 Good morning, my friends,
EURUSD just made a pullback within the last 30 minutes, so I entered a sell position based on that move.
🎯 Targets:
- TP1: 1.17607
- TP2: 1.17475
- TP3: 1.17174
🛑 Stop Loss: 1.17938
📊 Risk/Reward Ratio: 2.00
Your likes and support are what keep me motivated to share these analyses consistently.
Huge thanks to everyone who shows love and appreciation! 🙏
Gold (XAUUSD) – Bias for July 2Yesterday, price broke above the key H4 Lower High zone (3348–3350) with strong bullish momentum.
This breakout suggests a possible shift in the higher timeframe structure — indicating that the market may now be building toward a larger uptrend.
But we don’t chase breakouts — we prepare for the pullback phase .
🔍 What to Watch:
At present, M15 remains in a clean uptrend , fully in sync with the new H4 structure.
This multi-timeframe alignment gives us a clear bullish bias — but not an entry by itself.
We now need to see how price develops the pullback.
The best trades come when structure retraces with clarity — and confirms before continuation.
📍 Key M15 Level to Track:
• 3302 – Current M15 Higher Low
→ If this level holds, we may see a continuation of the uptrend from here.
→ If it breaks, the next potential reversal zone is around 3290 , where demand may reappear.
🎯 Execution Plan:
The trend is now clearly bullish across HTF and LTF.
We will only look for long setups , and only where structure confirms — either at the current HL or at deeper demand zones.
No confirmation = No trade.
No alignment = No edge.
Let price come to you. Our job is not to anticipate, but to align.
📖 From the Mirror Philosophy:
“In trend-following, the edge lies in waiting — not in chasing.
The market will reflect your patience back at you.”
📘 Shared by @ChartIsMirror
Author of The Chart Is The Mirror — a structure-first, mindset-grounded book for traders
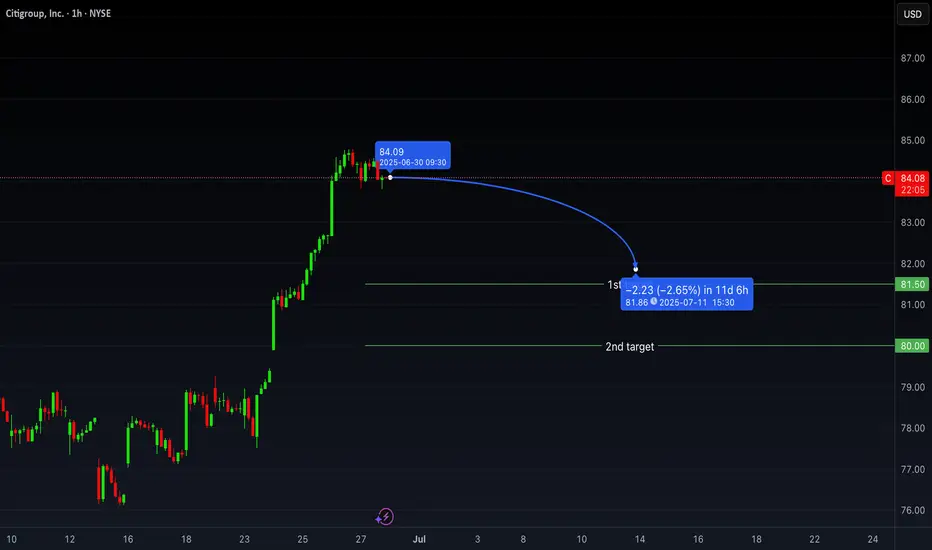
Watching for Pullback Below $84 in Citigroup (C)Over the past month, Citigroup shares have appreciated 8.58%, outperforming both the Finance sector's 1.91% gain and the S&P 500's 3.92% increase. This relative outperformance may signal strength, but short-term positioning and market structure suggest a potential shift.
Expecting a Sharp Move Below $84 – Option Flow Insight
Despite the recent strength, I anticipate a significant downward move below the $84 level in the upcoming week. This expectation is based on notable option activity detected in the Times & Sales feed, specifically large put orders suggesting bearish positioning.
In response to this setup, I plan to execute a bearish vertical spread, specifically:
Buying the $84 puts
Selling the $80 puts
This strategy limits downside risk while still profiting from a potential retracement.
Fundamental Picture Ahead of Earnings
Citigroup's next earnings release is scheduled for July 15, 2025. The company is expected to report:
EPS of $1.70 (+11.84% YoY)
Revenue of $20.85B (+3.51% YoY)
For the full year, the Zacks Consensus Estimate forecasts:
EPS of $7.38 (+24.03%)
Revenue of $83.84B (+3.33%)
While these figures suggest healthy growth, it's important to note that recent analyst estimate revisions have been modestly negative, with the EPS estimate decreasing 0.27% over the last 30 days. Citigroup currently holds a Zacks Rank #3 (Hold), reflecting a neutral sentiment from analysts.
Valuation Metrics
From a valuation standpoint:
Forward P/E: 10.75, notably below the industry average of 15.02
PEG ratio: 0.61, versus the industry average of 1.26
This indicates that Citigroup is undervalued relative to its peers, especially when considering growth prospects, which could provide some support. However, short-term bearish flows may dominate price action heading into earnings.
Industry Outlook
The Financial - Investment Bank industry, which includes Citigroup, currently has a Zacks Industry Rank of 96, placing it in the top 40% of over 250 industry groups. Historically, industries in the top half outperform those in the bottom half by a factor of 2 to 1.
#Btc Faces Crucial Decision Near Resistance — Bearish DivergeBitcoin is showing repeated rejections from the $110K and $108K zones. Currently, it's moving upward from the $98K area toward resistance, but price action remains compressed between the major trendline support and resistance.
This range-bound structure suggests that a pullback may be imminent, especially as RSI is forming consistent bearish divergence and the MACD is signaling weakness. A liquidity sweep to the downside could occur before a decisive move.
However, if BTC manages to break above the converging trendlines with strong volume, we may see a move toward $110K again for a retest. Watch $106K as an intermediate support. If that fails, further downside may follow.

XAUUSD SNIPER PLAN – TUESDAY, JUNE 10, 2025👋 Good evening traders!
After a choppy NY that faked both directions, Monday closed with gold stuck around 3325. But don’t be fooled — the real plays are coming Tuesday as we align with clean structure, trap logic, and real macro catalysts. Focus only on what matters.
Let’s prep with clarity and intent. 🎯
🌍 TUESDAY MACRO PREVIEW (JUNE 10)
📊 12:00pm – NFIB Small Business Index
🗣️ 10:00pm – President Trump speaks (market-moving risk)
🛢️ 10:30pm – API Weekly Oil Data (impacts USD sentiment)
No CPI or FOMC yet — but volatility is brewing. Trump + late-day oil stats = prime conditions for NY tricks or late-session moves.
🧠 TECHNICAL STRUCTURE
🔹 Last impulse: 3292 → 3338
🔹 Price now: 3325
🔹 Asia swept 3293 — partial gap fill
🔹 NY faked above 3338 → rejected → no follow-through
🔹 HTF still bullish but in pullback mode
📏 Fibonacci (3292–3338)
– 50% = 3315
– 61.8% = 3310
– 78.6% = 3303
📊 EMAs: 5/21 kissing → possible expansion
📉 RSI: Mid-range → clear room to move
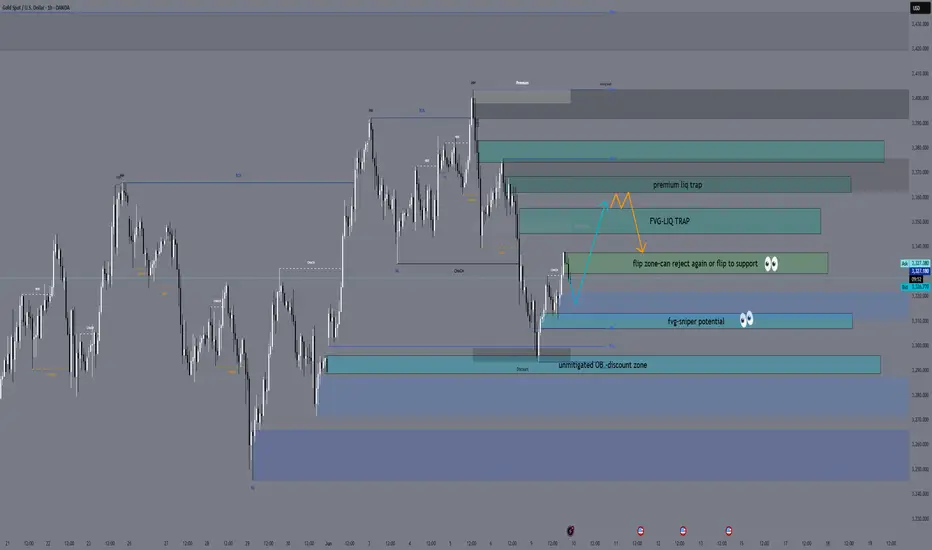
🔐 STRUCTURE ZONES – CLEAN & ACTIVE
Price Zone Type Logic
3345–3354 SELL ZONE 1 HTF FVG + inducement trap
3362–3368 SELL ZONE 2 OB + liquidity clear above final highs
3329–3332 FLIP ZONE NY trap → could flip support or reject
3307–3310 BUY ZONE 1 61.8% + CHoCH potential + OB
3292–3296 BUY ZONE 2 Asia low + FVG + discount sweep
🎯 PLAN OF ATTACK
✅ Bullish Plan
– Hold above 3315–3320
– Break 3338 → retrace into 3310/3307 = sniper long
🎯 TP: 3354 → 3368
❌ Bearish Plan
– Fail under 3332 → tap 3345–3354 for reaction
– Rejection = sell into 3310–3296
🎯 TP: 3310 → 3292
⚠️ 3329–3332 = reaction zone only
Do not sell blindly — wait for confirmation.
👀 EYES ON:
– 3338 = intraday BOS point
– 3307 = sniper trigger if CHoCH
– Trump speech = high spike risk
– NY tends to reverse early Asia setups
🚀 FINAL WORD
We’re not here to chase noise — we’re here to execute with structure.
You’ve got two clean sells, two sniper buys, and real macro risk on the table.
No guesswork. Just precision.
💬 What’s your plan for Tuesday?
Do you see the 3362 trap playing out?
Are you waiting for the 3307 sniper?
👇 Drop your scenario in the comments — let’s compare setups and grow together.
📲 Follow @GoldFxMinds for daily sniper clarity
🎯 Let’s dominate CPI week. Together.
💬 Drop a 🚀 if you’re locked in for NY
🔥 Let’s make Tuesday count — clean, confident, and calculated.
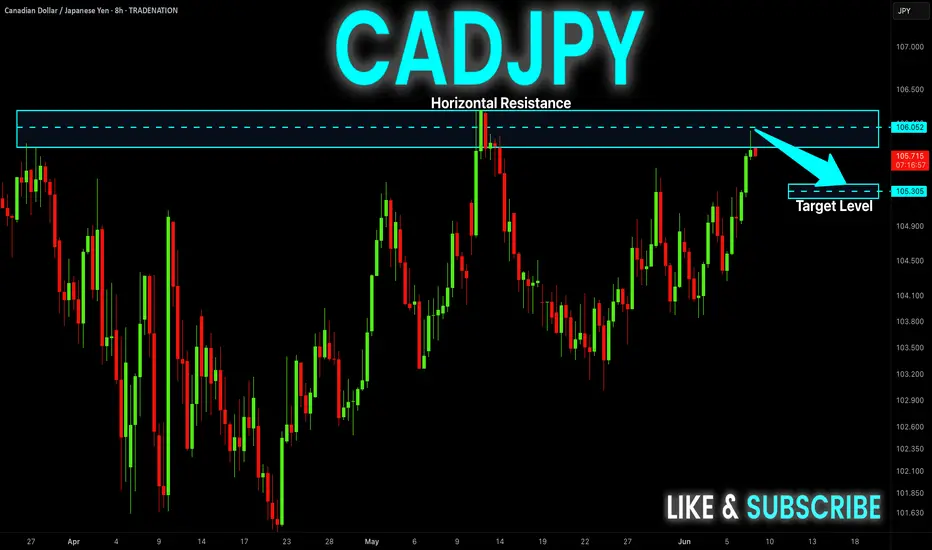
CAD-JPY Pullback Expected! Sell!
Hello,Traders!
CAD-JPY made a retest of
The strong horizontal resistance
Level of 106.083 and as you
Can see the pair is already
Making a local pullback from
The level which sends a clear
Bearish signal to us therefore
We will be expecting a
Further bearish correction
Sell!
Comment and subscribe to help us grow!
Check out other forecasts below too!
Disclosure: I am part of Trade Nation's Influencer program and receive a monthly fee for using their TradingView charts in my analysis.
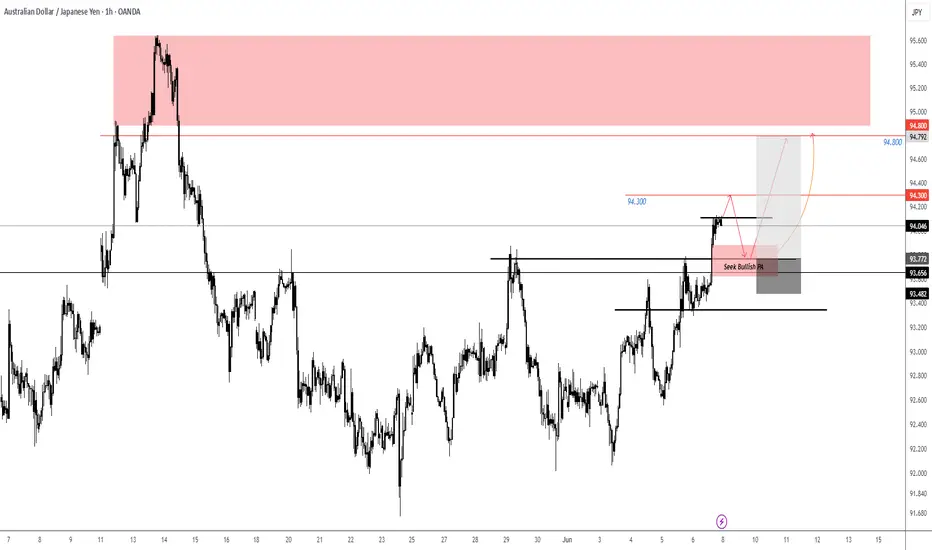
AUDJPY pull back to FVG then LongAUDJPY Long Setup (Preliminary Plan)
Target Levels:
First Target: 94.300
Second Target: 94.800
Strategy:
Looking for bullish price action (PA) confirmation around the highlighted Fair Value Gap (FVG).
Expecting a possible breach of minor resistance on open, which may lead to a push toward the first target at 94.300.
A pullback may follow after the first target is hit.
Notes:
This setup is preliminary and subject to adjustment.
Live price action will be monitored before executing the trade.
Adjustments for Better ReadingsMany traders rely on technical indicators to identify opportunities for profit—that's the whole point of this game. Whether it’s scalping, day trading, swing trading, or shorting the market, most trading decisions are based on indicator readings—be it a single indicator or a combination of several.
But here’s the truth: not all traders truly understand what an indicator is. They don’t grasp its nature—let alone the fact that this nature can be adjusted.
Those who don’t understand how or why an indicator works often find themselves in stressful and uncomfortable situations. It’s no coincidence that we often hear the common phrase: “Only 1% of all traders succeed, while 80% blow their accounts, and the remaining 19% barely break even.”
Why? Because the elite traders understand something most don’t:
Whether an indicator is leading or lagging, it can be customized to behave differently across different timeframes.
These adjustments can be found in the settings section of every indicator.
Let’s take the Relative Strength Index (RSI), which I’ve mentioned in previous ideas. Some of you may have noticed that my RSI plot looks different from yours. That’s because I don’t use the default 14-period RSI, which averages out the last 14 candles.
RSI is naturally lagging by default—but that doesn’t mean it can’t be trusted. In fact, with the right adjustments, that lagging nature can become leading. Learn how to do this. Push yourself. Educate your mind. Master this, and you might just find yourself among the top 1%.
Markets react to signals—signals that are often hidden in plain sight, created by the big players who always leave behind footprints. This is the trader’s true skill: seeing the whole picture.
A good friend once told me: Be a detective.
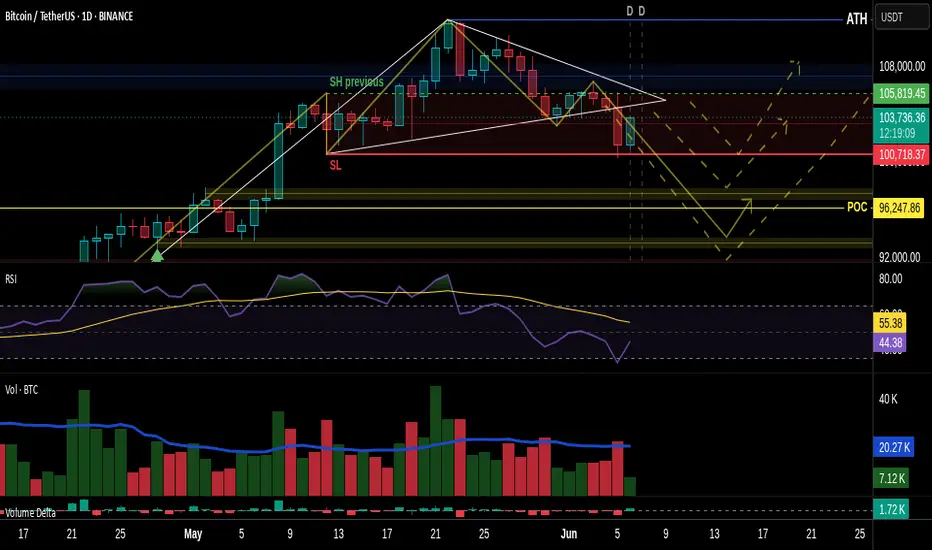
Now let’s go to the chart.
We clearly see a bearish strength unfolding.
Not only is the 9-period RSI plot trending below the yellow 28-period Weighted Moving Average (WMA), but we also observe a healthy continuation of the downtrend, confirmed by the WMA itself.
Using a 9-period RSI gives faster signals, while the 28 WMA offers smoother confirmations. This combo is applied on the daily timeframe—but every timeframe has its own ideal settings.
Now, when the RSI plot trends above the WMA, this can act as a potential reversal signal or even a confirmation of a trend change, depending on the broader market structure and volume context. It's not just about the crossover—it’s about what follows next. That’s where the detective work begins.
What do we see today?
Looking solely at the daily timeframe, the downtrend seems far from over. But to analyze it professionally, we must wait for the candle of Friday, June 6th, 2025 to close.
Switching to the lower timeframes, we see something interesting—a sort of bullish dominance unfolding during this incomplete trading day. But the real question is: Is it actual dominance?
Let’s break it down:
We have a clearly formed Head & Shoulders pattern.
The bearish Marubozu candle from June 5th made a new lower low (LL).
But—it did not close below the key swing low at 100.718.
Therefore, the Head & Shoulders pattern is not confirmed—it hasn’t broken and closed below that swing level.
So what’s happening in the lower timeframes?
In the 4-hour timeframe, we’re seeing a real-time crossover above the WMA (though the session isn’t closed yet).
In the 1-hour timeframe, the crossover has already occurred.
Now, such a crossover—where the RSI plot moves above the WMA—can often act as an early signal for a reversal, or at the very least, indicate a strong pullback. But don’t take it at face value—context is king. This is why we pair it with other signals like divergence, price action, and volume behavior for confirmation.
Across the 4H, 3H, and 1H timeframes, we’re observing this bullish pullback, yet it’s accompanied by an RSI Hidden Bearish Divergence (see: Macro Noise vs Micro Truth: The Art of Hidden Divergences).
Is this pullback a true reversal?
According to Volume Spread Analysis (VSA) (read: VSA vs BTC: Into a Bearish Scenario or Not?), a new narrative is emerging—but not without contradiction.
Price is climbing, yes.
But bullish volume spikes are declining, supporting our RSI hidden divergence. This volume-price disagreement is a clue.
What will reveal the truth?
Today's closing candle.
If price action (PA) creates a higher high (HH) but RSI creates a lower high (LH) → Bearish Divergence
If RSI makes a HH but PA creates a LH → Hidden Bearish Divergence
And for those of you who truly understand market structure:
The 100.718 level was a buy opportunity to secure profits.
If you caught that—congratulations. You’ve done your homework.
Now, you can sit back, relaxed, and wait for the next signal.
The market is a breathing organism. If you’re in sync with it—you’ll feel it.
And for those who believe there’s more to learn—but are struggling to find answers—there’s no shame in asking questions.
Till next time, take care—and trade wisely.
P.S. RSI plot, WMA, candlestick patterns, and Volume Spread Analysis (VSA)—when combined and used properly—can become a powerful toolset. For those willing to go deeper, they’re more than enough.
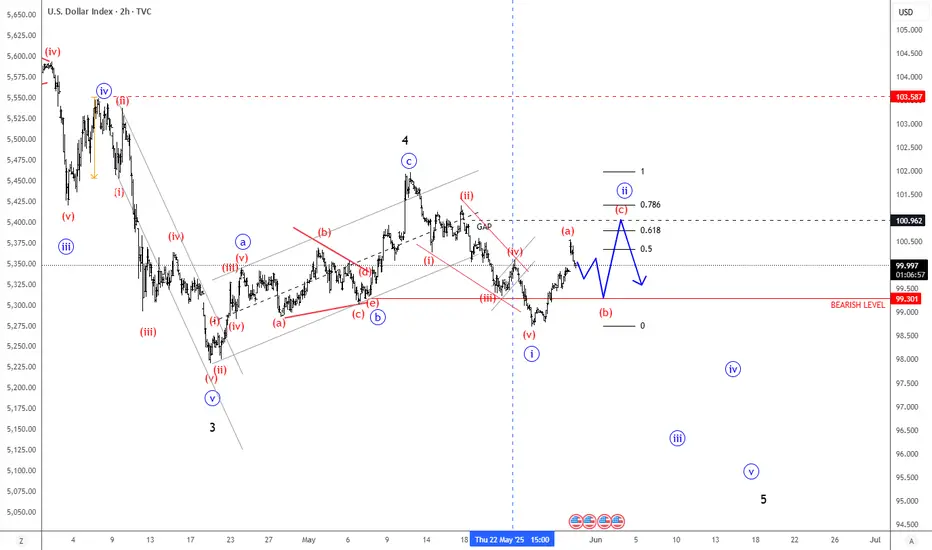
USDollar Is Making An Intraday Pullback Within DowntrendGood morning traders! Stocks keep pushing higher along with yields, so it looks like 10Y US Notes could still see lower support levels, and that’s why USdollar is in a bigger intraday correction. What we want to say is that while the 10Y US Notes are still searching for support, the DXY can stay in recovery mode or at least sideways. In the meantime, stocks can easily see even higher levels after NVIDIA surpassed earnings.
Looking at the intraday USDollar Index – DXY chart, we see a leading diagonal formation, so we are tracking now an intraday abc correction before a bearish continuation, thus keep an eye on GAP from May 18 around 101 level that can be filled and may act as a resistance before a bearish continuation.
BTCUSDT 4H – Key Support Test | Bounce or Breakdown?
Bitcoin has been in a clean uptrend for the past few weeks, making consistent higher highs and higher lows. Recently, we’ve seen a pullback that’s now testing a major confluence zone, which makes me lean bullish in the short term.
Here’s what I’m looking at:
1. 200 EMA (4H)
Price is currently testing the 200 EMA, which has acted as dynamic support throughout this uptrend. This is often a key level where bulls step back in after a healthy correction.
2. High Volume Node (102.5K–103.5K)
This area lines up with a visible HVN on the volume profile, suggesting strong previous acceptance and institutional interest. Holding this area implies a potential base for the next leg higher.
3. Retest of Ascending Trendline (Broken)
We’ve broken the minor ascending trendline, but price is now testing horizontal demand + EMA, which could act as the real support. This isn’t invalidating the uptrend structure yet — just a deeper pullback.
4. Demand Zone + Volume Spike (Recent)
The previous demand zone is still valid, and we saw a decent spike in sell volume into support — which could indicate a liquidity sweep or stop hunt, setting up for a reversal.
Trade Setup
📈 Long Setup: Bounce from Confluence Zone
Entry Zone: $102,300 – $103,300
Stop Loss: $101,400 (below HVN + 200 EMA)
Target 1: $106,000
Risk/Reward: ~1:2.5
This setup banks on BTC holding the 200 EMA and key HVN, continuing its overall bullish structure. A clean 4H bullish engulfing or a strong close above $104K would add even more confirmation.
Invalidation Criteria
If BTC closes a full 4H candle below $101,500 with no immediate buyback, I’ll consider the setup invalid and step aside — the next major HVN is around $96K, and I’ll look to long there instead.
BTC is pulling into a beautiful confluence of structure, volume, and dynamic support.
Short-term bearish pressure looks more like a corrective move within a bullish trend.
I’m looking to scale into longs if this zone holds. Tight invalidation and clean structure — great R/R.
Bullish Argument
First real test of 200 EMA since early April — trending markets often bounce here
Consolidation on top of prior demand — this could be a liquidity sweep / fakeout
High-volume support just below price = buyers likely interested here
We still haven't broken any key swing lows, so higher timeframe structure is intact
Bearish Risks to Watch
Trendline break and sustained lower highs = momentum shift
Lack of immediate bounce = could mean support is weakening
Break and close below $101.5K likely opens the door to $96K–$97K next HVN

BTC Potential Short-Term PullbackBINANCE:BTCUSDT could be setting itself up for a short-term pullback.
It might be forming a Daily RSI Bear Divergence, with the latest retest of the the main supply zone, and RSI Divs/Breakouts have been reliable leading signals for recent CRYPTOCAP:BTC PA.
Key Levels to Watch
• $119k - Measured wedge target, confirmed with last month's breakout.
• $106.2k-$109.5k - Main supply and ATH, a sustained break above it would invalidate any bearish PA.
• $89.6k-$91.9k - Lots of confluence here:
- Unmitigated daily FVG
- The 200-day EMA is sitting there
- A move here would be between 0.5 and 0.618 Fib retracement of the last leg up, consistent with the typical pullback length of Wave 2 (Elliott Waves theory)
- It has also been an important S/R since November 2024, and a retracement here could form an Inverse Head and Shoulders pattern.
I would be patient with it, as I still see a lot of uncertainty short-term, but I think a pullback to ~$90k could offer a great long entry. Worth keeping a close eye on it.

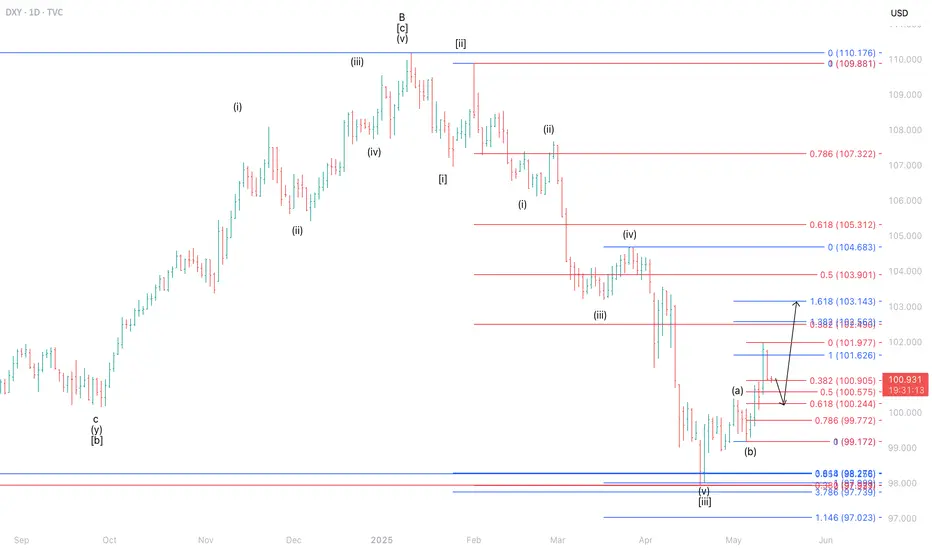
Short-Term Pullback Expected for DXY Before Potential ReboundThe current position of the DXY is estimated to be in wave ii of wave (c) of wave . This implies that the DXY remains vulnerable to a correction toward the 100.244–100.905 area. Subsequently, there is a potential for a rebound, with the index likely to retest the 102.563–103.143 zone.
Bitcoin Chart Pattern Signals Possible Dip Before Pump!🚀 Hey Traders! 👋
If you’re finding value in this analysis, smash that 👍 and hit Follow for high-accuracy trade setups that actually deliver! 💹🔥
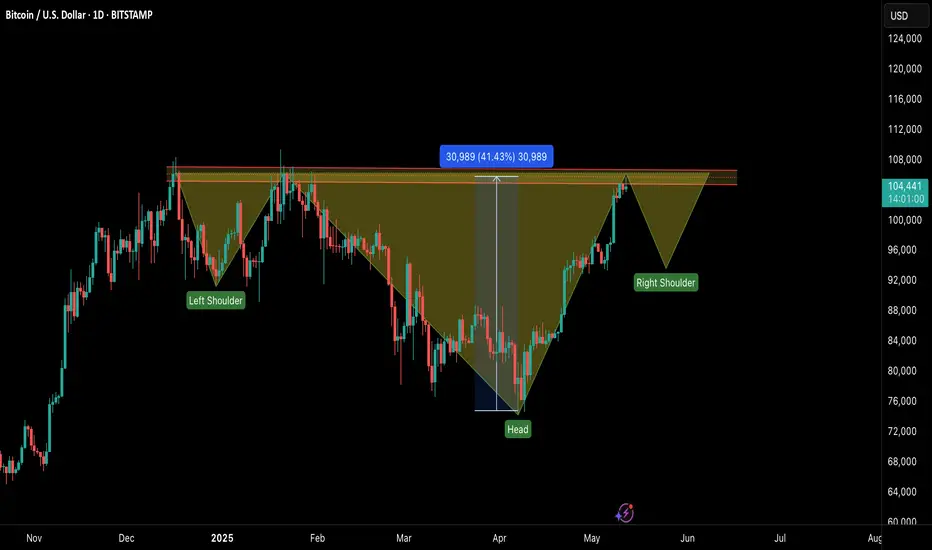
📉 #BTC – Potential Inverse Head & Shoulders in Play
Bitcoin is showing signs of a classic inverse head and shoulders formation on the daily chart. However, it's facing heavy resistance near the neckline around the $106,000 zone.
🧠 Possible Scenario:
A correction toward the GETTEX:92K –$93K range could complete the right shoulder before a potential breakout. If we see a clean bounce from that level, bulls might reclaim momentum.
⚠️ Invalidation:
A daily close above $106,000 would invalidate the structure and signal early continuation.
💬 What do you think of this setup? Drop your views and analysis in the comments below!
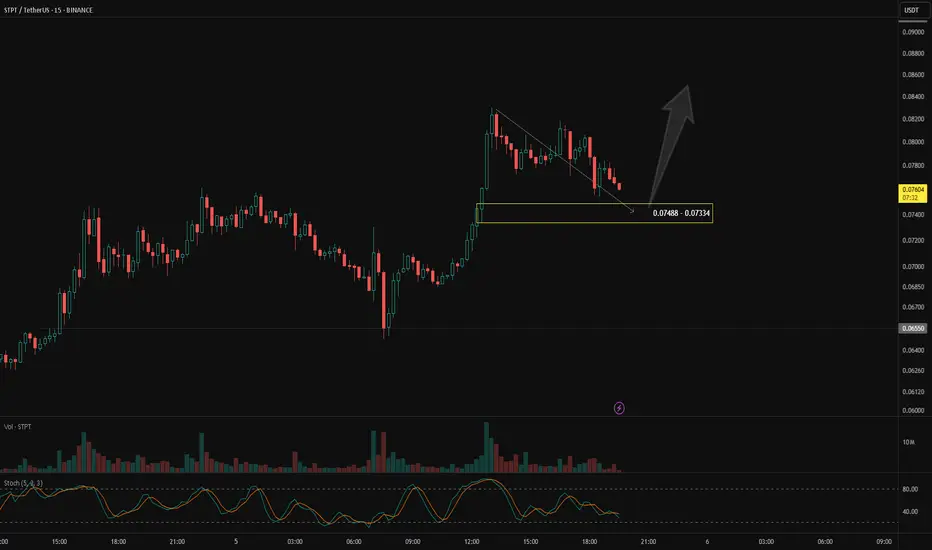
One Last Drop Before Take Off?Price is still in a pullback phase, and the next potential target zone is around 0.07488 – 0.07334.
We might see one last dip before BINANCE:STPTUSDT resumes its uptrend.
If the price reaches this pullback zone with a bullish divergence, that would be a strong confirmation for a possible reversal.
But even without divergence, we can still rely on candlestick patterns to signal a potential reversal at that level.
What do you think — will BINANCE:STPTUSDT bounce from this zone or break lower?
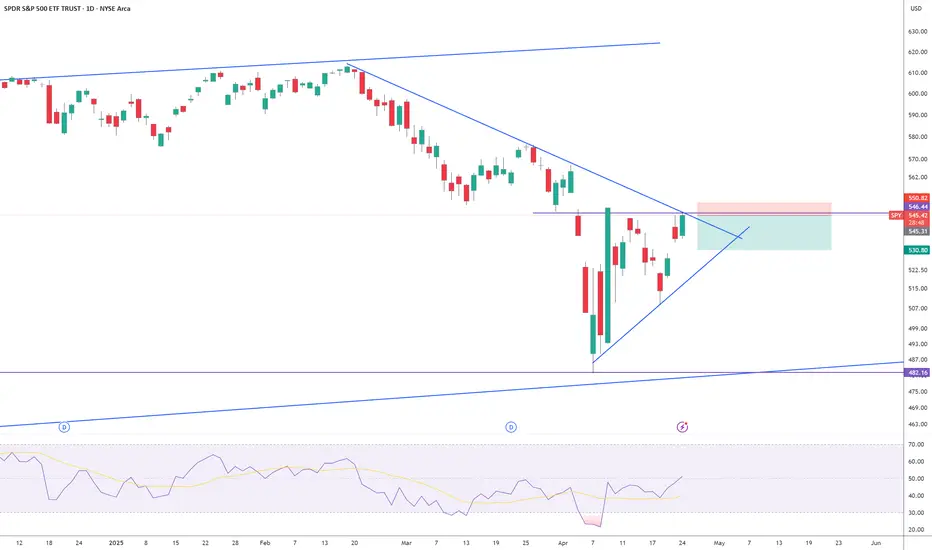
Quick correctionI bough some puts form 05/02 strike 242.5. I think is going to respect that resistance in short term. I'll take the loss if it breaks up that resistance. Also SPY is hitting a resistance zone. We might see a pull back soon.

Pull back SPYBought some puts for 04/29 strike 439. Too much resistance above, looks like is going to be a rejection. Tight SL at 550.
Crypto Bulls Awaken – Is This Just the Beginning?In the past 48 hours, the crypto market has brought joy to traders and investors who managed to buy near the bottom.
(Sorry to the cryptobros still holding floating losses—your time will come too! 😊)
Some of you might be thinking it's too late to ride this bull run. But if you zoom out and look at the bigger picture, there's still plenty of room for the bull to run.
Just switch to a higher timeframe like the weekly or monthly chart, and you'll see the potential upside.
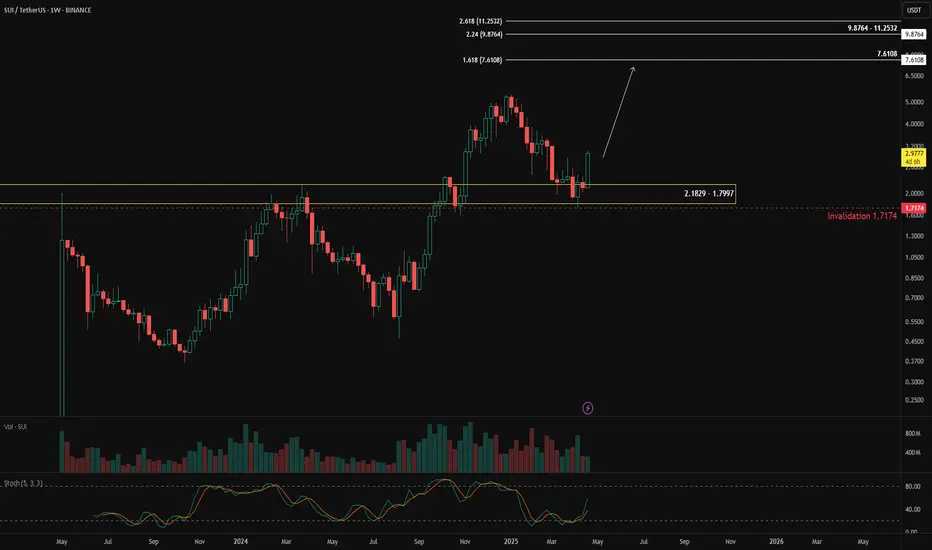
One coin that looks particularly interesting is BINANCE:SUIUSDT .
There's been a pullback from 2.1829 - 1.7997, and it's supported by bullish divergence, suggesting a continuation of the impulsive move with 7.6108 as the first major target.
This bullish scenario remains valid as long as the price holds above 1.7174.
You might be wondering,
" So can I just buy/long BINANCE:SUIUSDT now? "
Not yet.
For a better entry and a more favorable risk-reward ratio, I suggest using the daily chart.
Wait for a pullback, then look for confirmation using candlestick patterns.
(I'll cover those patterns in my next post—stay tuned!)
Why This Bearish Trend Is Actually a Bullish Opportunity?Understanding the Multi Timeframe Analysis – Part 2 of 2
Alright from the prior post we talked about how the corrective move on the 4H timeframe turns out to be a bearish trend on the 1H chart. Now, let’s dive deeper into that 1-hour chart.
In this 1H chart, we can observe a trend shift from bullish to bearish.
Before the red arrow, we can clearly see a bullish structure:
Blue arrows continue to form higher lows, and
Orange arrows form higher highs (except one minor failure, which still maintains the bullish structure because price doesn’t break the previous low).
But everything changes after the red arrow:
Orange arrows fail to create new highs,
Blue arrows start forming lower lows,
→ confirming a bearish reversal on the 1H timeframe.
So… How Can We Use This Bearish Trend as a Bullish Opportunity?
Here's where it gets interesting — instead of seeing the bearish trend as a threat, we use it for better entry with an improved risk-reward ratio.
But here’s the catch – some conditions must be met:
Make sure the bigger timeframe (4H) still supports a bullish trend.
Wait for price to drop lower than the last blue arrow (prior low).
Look for bullish divergence + candlestick confirmation before entering.
Once you get the signal, you can place your stop loss below the confirmation candle to limit your risk.
What If Price Breaks the Orange Arrow (Prior High)?
If price invalidates the bearish structure by breaking the previous high, that means:
The 1H bearish trend is over.
The pullback on 4H timeframe is done.
And price is likely resuming the main bullish trend.
So, whether price goes lower or higher — you’re ready either way.
Alright, that’s my take on using multiple timeframes—hope it helps clear up any confusion you had! Let me know your thoughts in the comments. See you in the next post!

Sell BTC if below 83000We're still in a downtrend, and the prior low has been cleared, and in the pullback back we have a strong supply zone which has been tested 3 times! The 3rd time we have this little pattern, which will probably see a bearish breakout. If this happens, we can enter with the breakout and sell for 73000, which makes an R/R of 2. So if the support zone of 83000 is lost, it is a good time to sell.

FCPO 16 April 2025 - Palm Oil Daily Chart Analysis
Yesterday's candlestick closed as a bear bar in its lower half with a prominent tail below.
Currently, the market is a small bull inside bar trading near its high.
The bulls want a reversal from a wedge pattern (Mar 25, Apr 9, and Apr 15) and a small double bottom (Apr 9 and Apr 15)
They see yesterday's move simply as a retest of the April 9 low and want a reversal from a lower low major trend reversal.
They must create strong bull bars with follow-through buying to increase the odds of a TBTL (Ten Bars, Two Legs) pullback.
They want a retest of the 20-day EMA.
The bears want a retest of the January low.
They want a large second leg sideways to down with the first leg being the April 2 to April 9 low.
If the market trades higher, they want the April 10 high or the 20-day EMA to act as resistance, followed by a reversal from a double-top bear flag.
Exports for the first 15 days are up ITS: 16.95%, AmSpec: 13.55%.
Production is slowly picking up, but not in a big way yet.
Refineries' appetite to buy physical looks lukewarm with the recent sharp falling market.
The market remains Always In Short.
The recent selling has been climactic and slightly oversold.
Perhaps we may see a minor pullback towards the 20-day EMA or April 10 high area?
Let's monitor the buying/selling pressure and if the bulls can create strong follow-through buying tomorrow.

LONG inside a GIANT SHORT...Mostly I believe the Main trend is Bearish and the Main IDEA represents the same...
small bullish movement is happening... (hope to be true...)