BTC/USDT long position the price is going down and we have a static support and a broken trend line that price is going to complete its pullback so we can set a long position there
Pullback
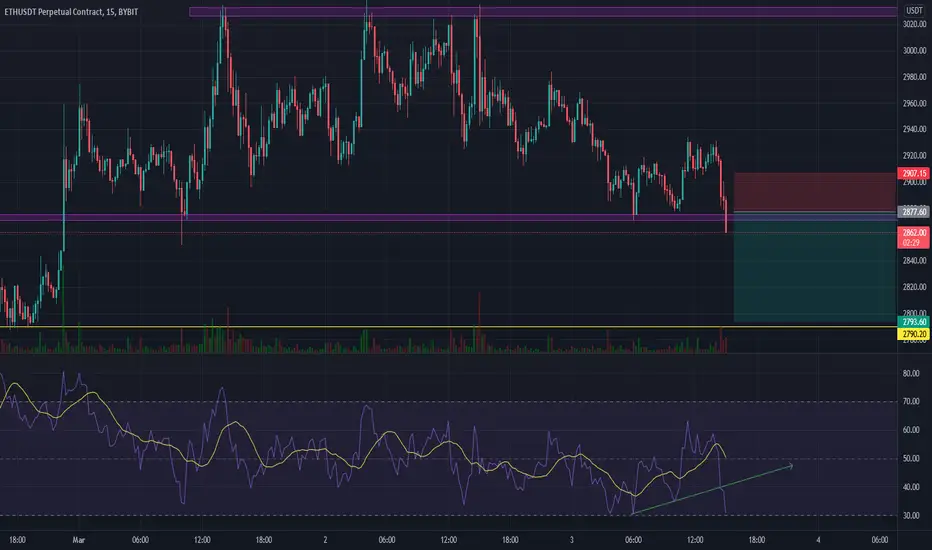
#ETH is #PULLBACK to bearish #trendlineETH /USDT is GET the good setup for SHORT POSITION by PULL BACK to bearish trend line in 15M Time F
You Can get This Position With 7X LEV
GOOD LUCK & Don't Forget to set the SL & TP
#UNI is #PULLBACK to bullish #trendlineUNI /USDT is GET the good setup for SHORT POSITION by PULL BACK to bearish trend line in 15M Time F
You Can get This Position With 7X LEV
GOOD LUCK & Don't Forget to set the SL & TP

#SNX is #PULLBACK to #bearish #trendline
ENJ/USDT is GET the good setup for SHORT POSITION by PULL BACK to bearish trend line in 15M Time F
You Can get This Position With 5X LEV
GOOD LUCK & Don't Forget to set the SL & TP

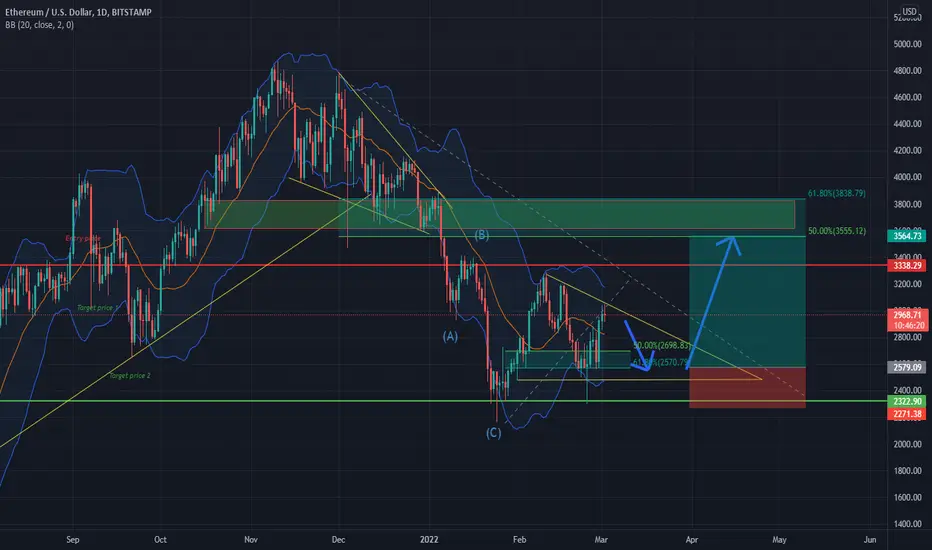
ETHUSD LONG POSITION CLOSE TO BREAKOUT!ETHUSD broke downtrend and started forming triangle pattern, already bounced once, now we are waiting for retracement to the bottom of triangle, and break out at the top and rise till 50% fib zone at 3564 zone, my entry point would be 2579 since there is a 50% fib zone and also it should hit Bollinger band at that point since it did it before (Also if you want even bigger risk to reward ratio you can enter at 2560, but there is more chance to get a breakout down and hit stop loss) and stop loss at 2271, it is more risky entry, since it could be a fake out and it could go back into down trend if you want a safer entry you can wait until it breaks out at the top of the triangle at (2848) and even wait for a retrace back after breakout, to make it as safe as possible but the reward will be significantly lower.
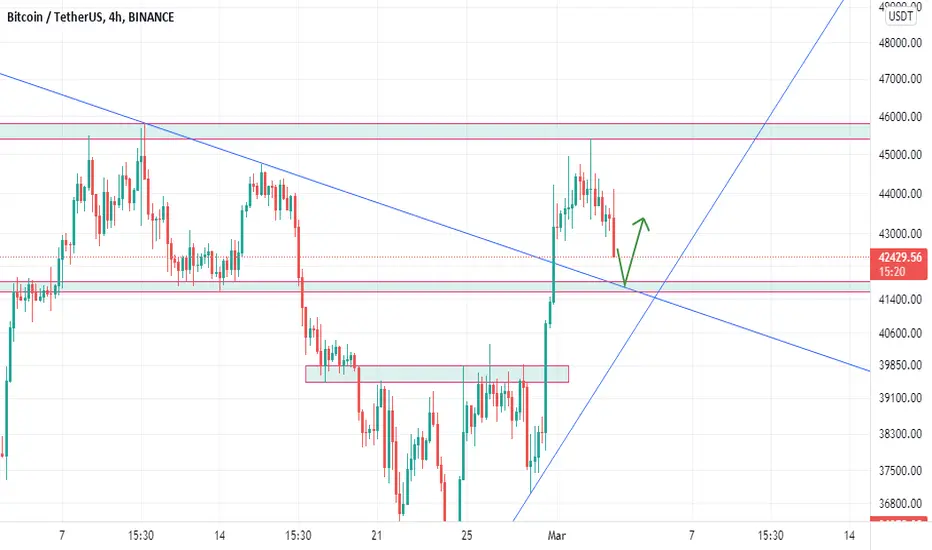
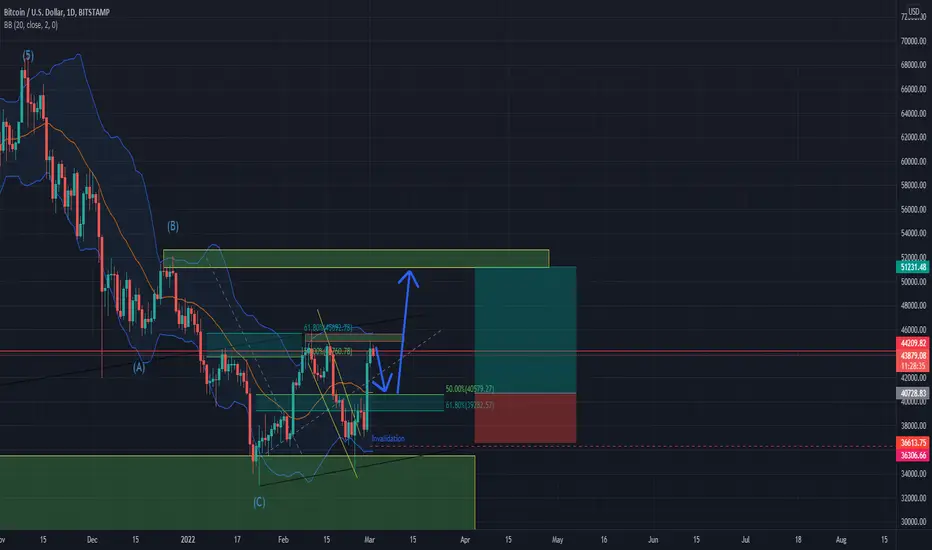
BTCUSD LONGBTCUSD completed full Elliot wave (1 to 5), and ABC correction downwards, bounced of a strong weekly support, and a bollinger band, which shows it should rise in price, it went up, bounce off of 61.8 percent fib zone and formed a 4h resistance, and went back to a weekly support, and bounced again, now it bounced again from a 4h resistance, and we should see a retrace to a 50 percent fib zone, where we should put our entry point, where the BTC should bounce up break the 4h resistance (it bounced off 3 times already so it is weaker). and rise up to a daily resistance and reach 51231 zone, our stop loss should be right below recent low (36613).
#ADA is pullback to #bearish #trendlineADA/USDT is GET the good setup for LONG POSITION by pullback to bearish trendline in 15M TF
You Can get This Position With 7X LEV
GOOD LUCK & Don't Forget to set the SL & TP

AUDUSD GOING DOWN FROM HERE - GREAT SWING TRADEI take short trade here from the following reasons:
1.Bear flag (the last wave before breakout)
2.Resistance
3.Supply candle (marked with yellow TL)
4.Bear Shooting star candle
5.200ema
6.Entry the Fib golden zone
7.50,100,200 EMA Weekly just above the price.
Just look nice for me

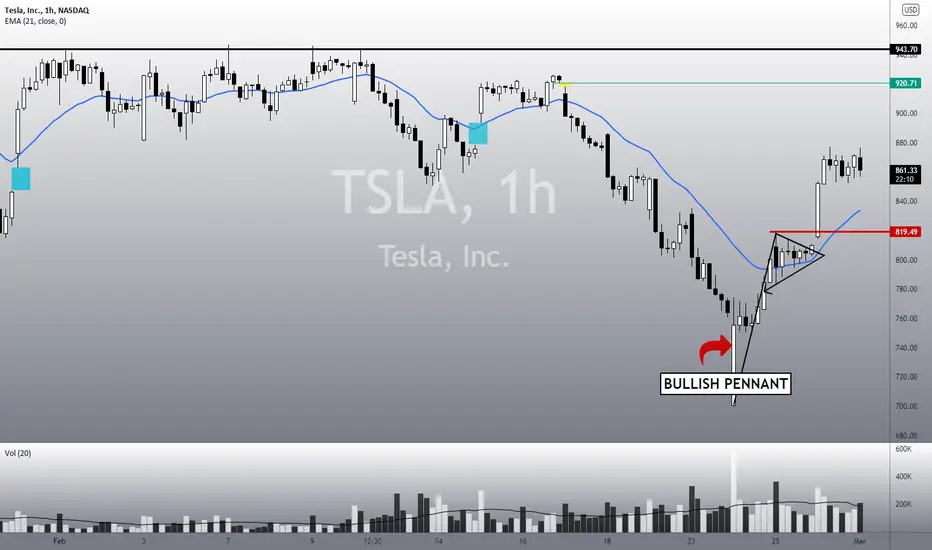
TSLA: How far a correction would be acceptable?Hello traders and investors! Let’s see how TSLA is doing today!
It is correcting a little bit today, as we already expected, since we have an important resistance at this price level. Is this reason to panic? Not at all.
TSLA triggered a bullish pennant, and the trend is bullish in the short-term, meaning, pullbacks are opportunities to buy/add positions. A pullback to the 21 ema or to the red line at $ 819 is acceptable, and this wouldn’t ruin the bullish bias. It could drop beyond this point, but this would ruin the bias and TSLA would need to do another bullish structure to reverse again.
Yesterday, in my previous analysis, I warned you guys about the 21 ema in the daily chart (just check the link below in the "related ideas", if you are curious). This is the important resistance I mentioned in the first paragraph of this analysis. Only by breaking this resistance TSLA might become bullish again in the mid-term. Remember: Unlike the 1h chart, in the daily chart, the trend is still bearish.
However, despite the 21 ema giving us a hard time, the volume is increasing again, and this is good news. Still, it is important to wait for a better bullish structure in the daily chart, in order to confirm a better reversal movement.
For now, we might expect some correction in the short/mid-term, and this would be a healthy movement. Let’s wait for more signs.
I’ll keep you guys updated every day on this, so remember to follow me to keep in touch with my studies.
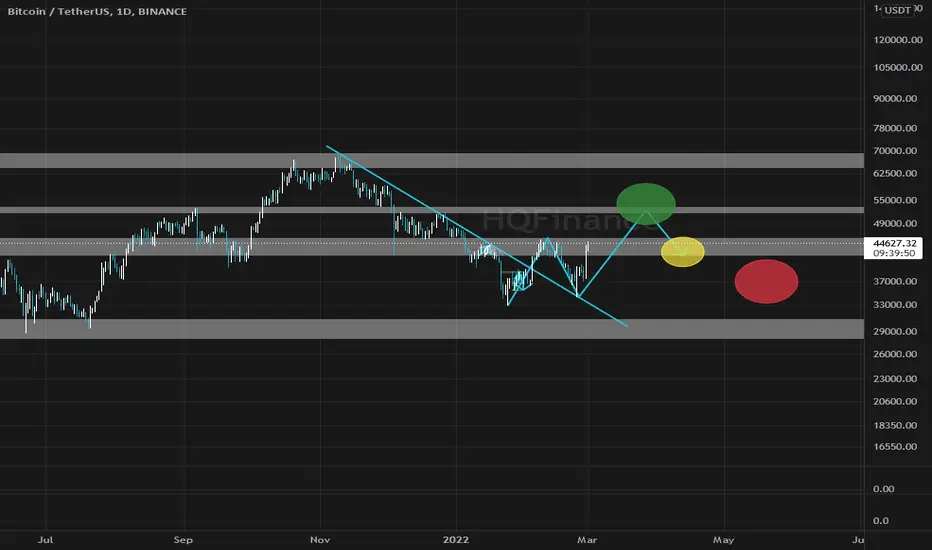
BTC 1D | #WW3 #Bullish #GrowAccording to previous analyzes, we have progressed, but the double bottom pattern is formed, and a downward trend line is broken and the pullback is done properly, and now it is time to touch the price from 48000 to 51000
ada/usdt break outhey
cardano had a break out recently now we are waiting for its pullback to setup a long positin.
take care about stop price


Shiba Inu Analysisafter the war news (too bad news) and increasing of the GOLD and U.S Dollar Value and Cryptocurrencies Falling too, seems like we have a nice pullback on the previous fresh poi demand zone and finally we can expect growth again ... (let's see) They probably always play us in the direction of the market

#ENJ is #PULLBACK to #bearish #trendline
ENJ/USDT is GET the good setup for SHORT POSITION by PULL BACK to bearish trend line in 15M Time F
You Can get This Position With 6X LEV
GOOD LUCK & Don't Forget to set the SL & TP

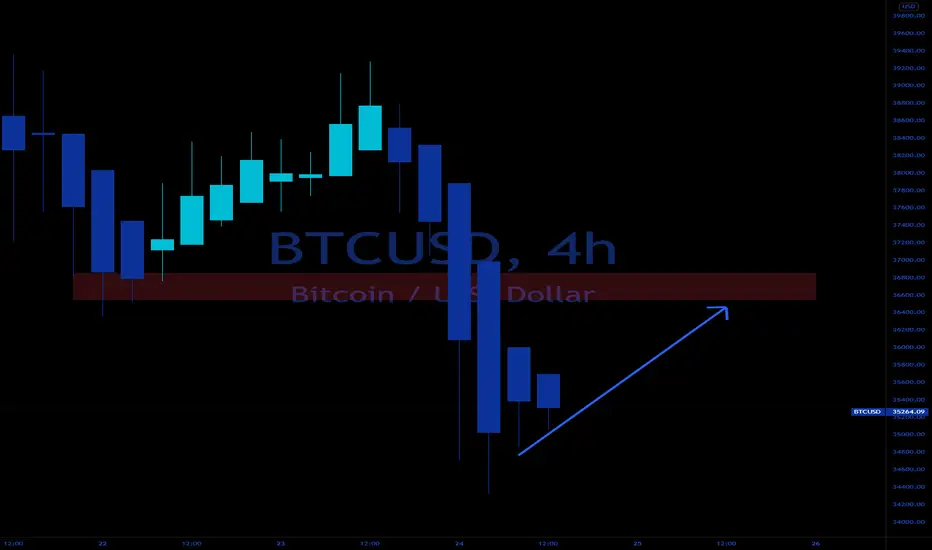
Buy the dipLooks as though we're going for a small corrective in BTC at the moment with my expectation for price to rise back to around the 36500.00 area.
Once price reaches this intra-day style trade target, I will then be adding some SSL (sell-side liquidity to the longer term bear move so long as the bear AP (anchor point) is broken.
Longer term expectation is short for BTC but short term looks long to 36500.
Best of luck.
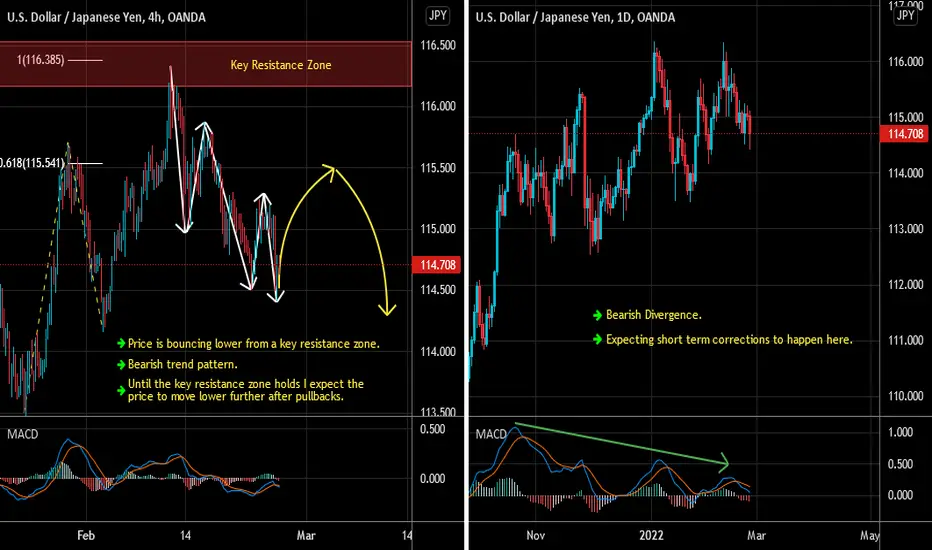
USDJPY Short Term Sell ideaD1 - Bearish Divergence.
Expecting short term corrections to happen here.
H4 - Price is bouncing lower from a key resistance zone.
Bearish trend pattern.
Until the key resistance zone holds I expect the price to move lower further after pullbacks.