PUMPUSDT at a Decisive Turning Point – Breakout or Breakdown?
🧠 Technical Overview:
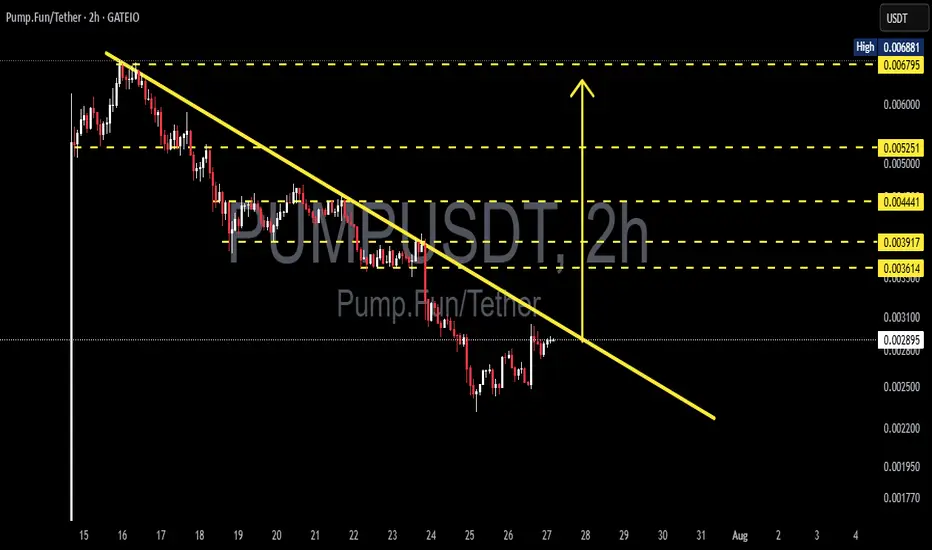
PUMPUSDT has been in a sustained downtrend over the past several days, forming a clearly defined descending trendline that has acted as a dynamic resistance since mid-July. Now, the price is approaching this key level once again—and this time, momentum seems to be shifting.
Interestingly, the current structure is forming what appears to be a potential Inverse Head and Shoulders (IH&S) pattern, a well-known bullish reversal formation. If confirmed with a breakout above the neckline/trendline, this could spark a strong upward reversal.
---
📌 Key Technical Highlights:
Descending Resistance Line: Holding since July 15, acting as the primary ceiling on price action.
Inverse Head and Shoulders Pattern: Potential bullish reversal setup forming on the 2H chart.
Volume: Currently low but showing signs of increase near the potential breakout zone—a bullish early signal.
---
📈 Bullish Scenario (Breakout Confirmation):
If the price successfully breaks and closes above the yellow trendline, especially with a strong candle and volume confirmation, we could see a momentum-driven rally toward the following targets:
1. ✅ $0.003614 – Minor resistance zone
2. ✅ $0.003917 – Retest of previous consolidation structure
3. ✅ $0.004441 – Measured move target from IH&S pattern
4. ✅ $0.005251 – 0.618 Fibonacci retracement area
5. ✅ $0.006795 – Major swing high and liquidity zone
> Potential upside of 100%+ from current levels if momentum continues.
---
📉 Bearish Scenario (Trendline Rejection):
If the price fails to break above the trendline and faces another strong rejection, then sellers could regain control, leading to:
⛔ $0.002500 – Psychological support and consolidation base
⛔ $0.001950 – Local bottom and potential long-term entry zone
> A failed breakout could trigger a quick sell-off or stop-loss cascade below the IH&S setup.
---
🔍 Technical Summary:
Indicator Status
Descending Trendline Actively being tested
Volume Increasing near breakout zone
RSI Rising from oversold territory
Price Pattern Inverse Head & Shoulders (Potential Reversal)
Risk/Reward High, favoring breakout strategy
---
🧭 Strategy Suggestions:
Aggressive Entry: Enter on breakout candle close above trendline with volume confirmation.
Conservative Entry: Wait for breakout + successful retest of the trendline before entering.
Stop Loss: Below neckline or recent swing low (~$0.0025).
Take-Profit Zones: $0.0039, $0.0044, $0.0052 and beyond.
---
🧠 Final Thoughts:
> “Charts never lie—PUMPUSDT is building pressure beneath a key resistance. If it breaks, the move could be explosive. Are you ready to ride the wave?”
Microcap altcoins often fly under the radar—until they don’t. This setup is showing the classic signs of a potential breakout. Use sound risk management and watch the next candle closely.
#PUMPUSDT #CryptoBreakout #InverseHeadAndShoulders #TechnicalAnalysis #AltcoinSetup #PumpFun #BreakoutAlert #MicrocapGems #CryptoReversal #ChartPatterns #CryptoSignal #CryptoStrategy
Pumps
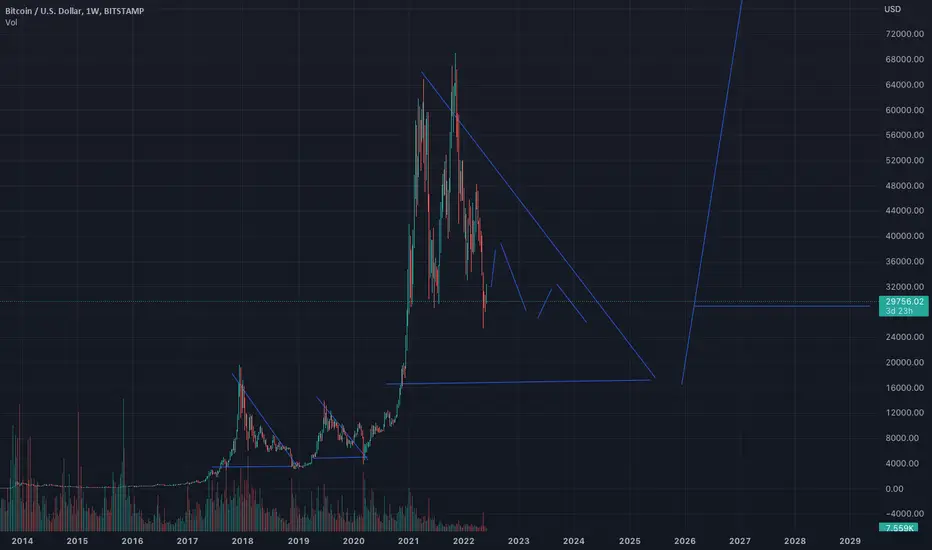
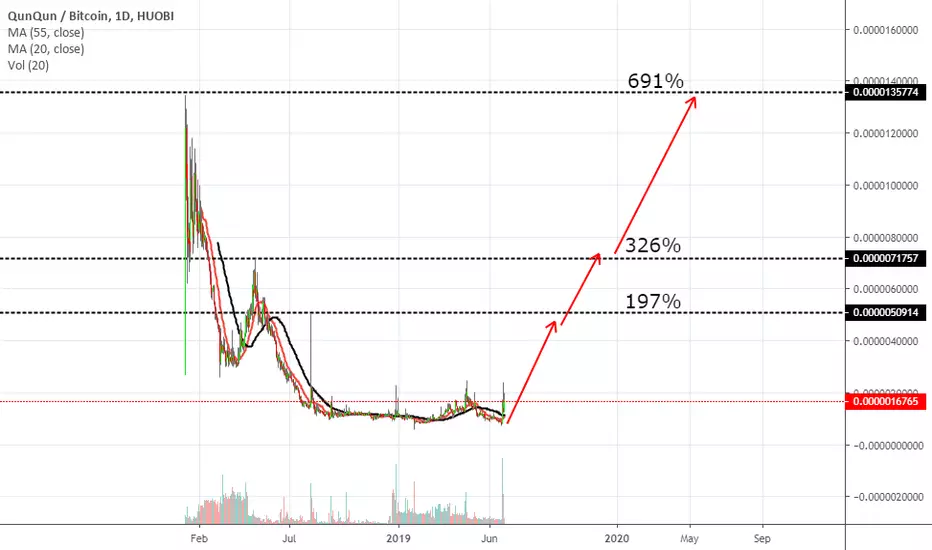
frac 1 2 3 4 DUKE 2022
Chart to show basic fractal breakouts over 1.5 years and 3x 4.5 years .
Hunch
Bitcoin 3day 100% RSI Pump ZoneHello Traders,
While analyzing Bitcoin's running history I came across this Relative Strength Index zone that clearly shows a pump or reversal in price action every time the 3 Day RSI Indicator Line enters this zone. Even in a down trend in price action the pump turned a 65.41% gain. As of right now we are just entering the top of this zone. It should be interesting to see how price action reacts now that we are within this pump zone.
My Plan is to start dollar cost averaging into the price action and hope that the price gets deep into the bottom buy zone that I have placed on my chart. This would bring the RSI down further into this zone and potentially have the same large pumps as previous time this has happened.
I would like to hear from you on what your prediction is for Bitcoin in 2022, lets discuss and have a great conversation below!
Have a green week,
Savvy

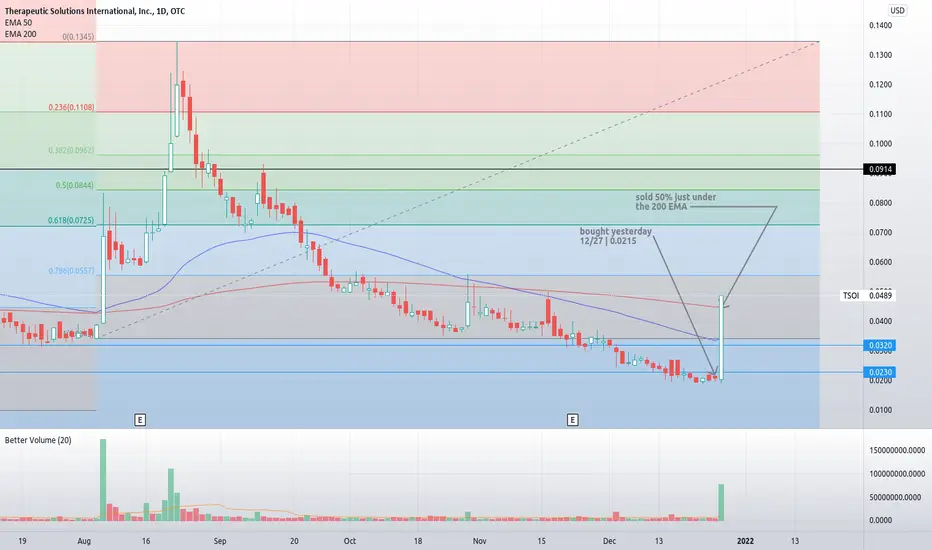
TSOI PUMPIN'!!!I moved another trader profitably out of TSOI on the last run and waited for it to base the Honey Bucket before buying in myself. This stock is a beauty for pump action and I suspect that whoever is moving it, either wanted to take a year end loss and then re-accumulate or bears had it by the short & curlys, dunno. I care less about the fundamentals on stocks like this and tend to trade on pure technicals. Still holding 1/2 my stash after a quick one day 100% and waiting to see if it Fibs out well like last time.
As always, "Not investment advice", DYOR and good luck!
Shibcoin To the moon. lol. Doge too.This is pretty much going to happen to every crypto and growth stock this year


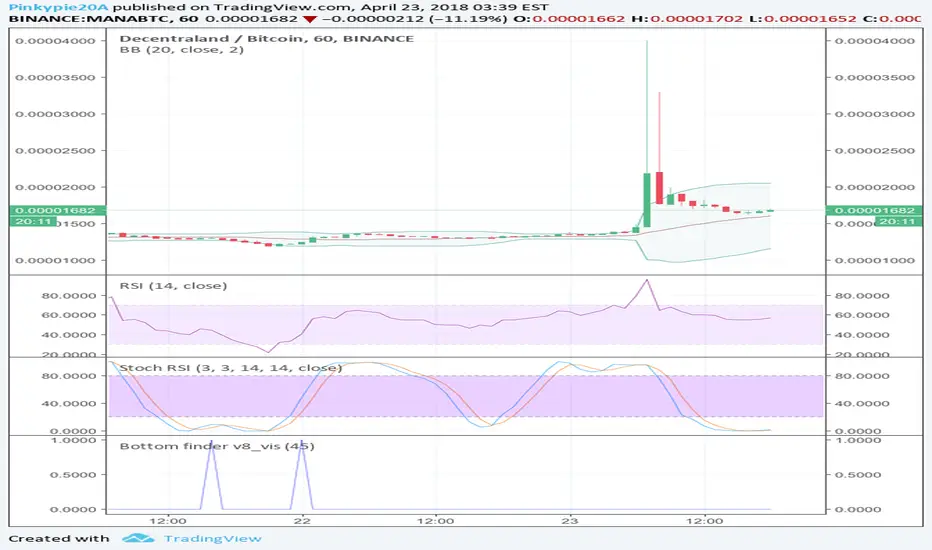
MANA pre-pump signal 320% gainLast buy signal using Bottom Finder script was a pre-pump signal generated yesterday at price 124. Then coin was pumped up to 400 today. Potential gain 320%.
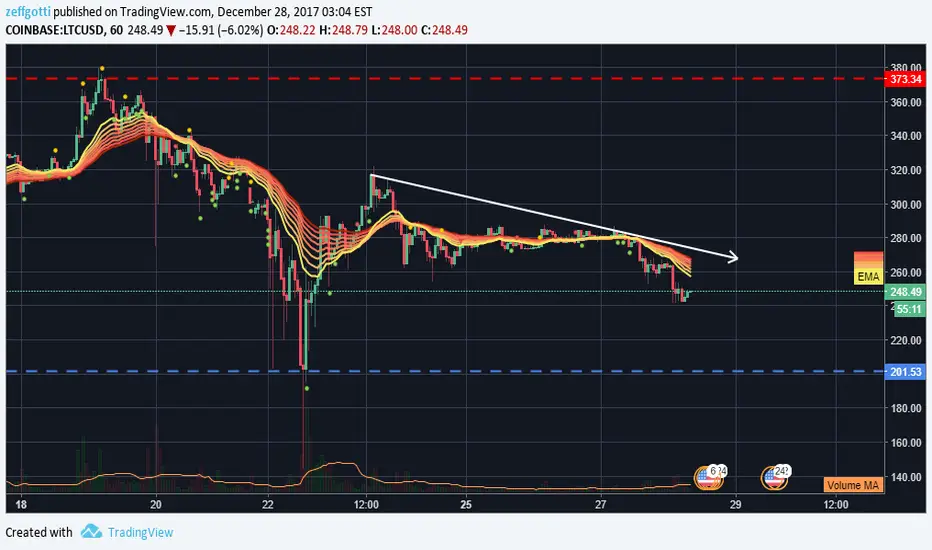
LITECOIN (LTC/ USD) HOW DEEP IS THE DIP? (1H CANDLES)HEY TRADERS, SINCE I PERSONALLY OWN QUITE A BIT OF LITECOIN MYSELF, I FIGURED THERE MUST BE PEOPLE AS CONCERNED AS ME (OR MORE SO) ABOUT THE RECENT DIPS. HERE I SHARE MY THOUGHTS ON JUST HOW DEEP THESE DIPS MAY GO...ENJOY.
**Please note that the information contained in or provided above is not intended to be and does not constitute financial advice, investment advice, trading advice or any other advice.**
HOW TO READ THE YELLOW-ORANGE RAINBOW:
+ IF THE COMPLETELY YELLOW RIBBON IS ABOVE THE COMPLETELY RED RIBBON, THIS SIGNALS AN UPTREND
+ IF THE COMPLETELY RED RIBBON IS ABOVE THE COMPLETELY YELLOW RIBBON, THIS SIGNALS A DOWNTREND
+ MORE SPACING BETWEEN ALL 8 RIBBONS = EITHER A BIG UP SURGE OR DOWN SURGE
+ COMPRESSED RIBBONS = PRESSURE BUILDUP, WHICH WILL RESULT IN POSITIVE SURGE OR NEGATIVE SURGE.
LITECOIN ANALYSIS:
+ TRADE RANGE = $201 - $373
+ BULLISH VIEW: PRICE WILL TEST WHITE SUPPORT AT $273 - $267 RANGE. A BREAK THRU MAY RESULT IN $316 TEST. POSSIBLE PROFITS HERE
+ BEARISH VIEW: RAINBOW LOOKS LIKE IT IS READY TO FAN OUT IN A DOWNTREND. IF SO, IT MAY BE A SMOOTH RIDE DOWN TO TEST $200 LEVEL, DUE TO MOMENTUM BUILDUP FROM LAST 4 DAYS. AT WHICH POINT...IF YOU STILL BELIEVE IN LTC...BUY BUY BUY!
PLEASE LET ME KNOW IF YOU HAVE ANY QUESTIONS, I'M ALWAYS HAPPY TO HELP OUT. HOPE YOU GUYS KILL IT OUT THERE! HAPPY HUNTING MY FRIENDS.