Buying QS 16 APR 21 30 PUTI'd like to see price hold this resistance on the daily time frame.
If price breaks and closes above $65.68, then I'll close the position and salvage what I can.
I expect price to continue to move lower and check $28.
Why did I buy puts with a $30 strike? Because price has already checked the $38 price level annotated by a check mark. I think price could push further down to the base of that price level (annotated by an up arrow) around $30 within the next 30 days.
Put

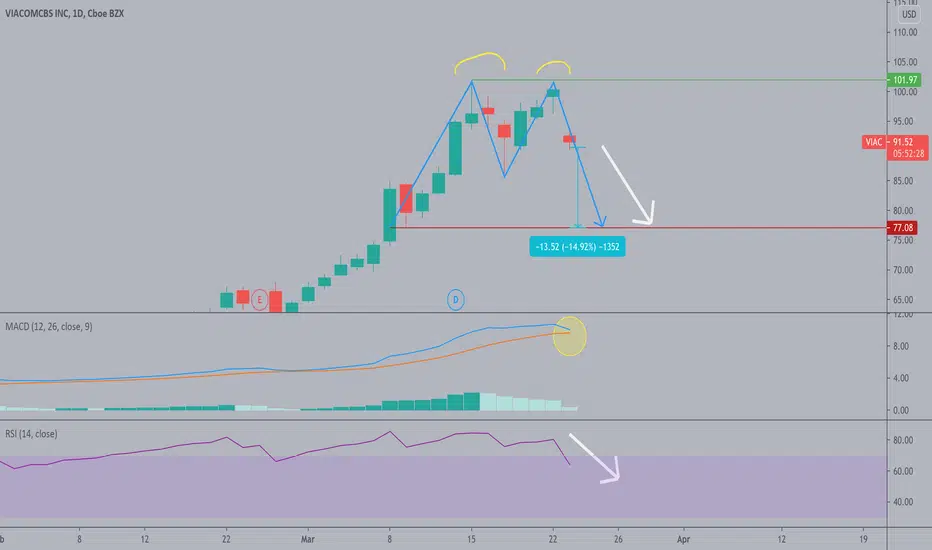
Double top in VIACVIAC announced new shares will be issued diluting the current value of their already overvalued shares. A double top has formed on the chart. Correction ahead as there are multiple options for the underwriters to buy more shares after the initial offering, meaning the dilution could continue.
When a company sells its shares, it's essentially recognizing its share price is higher than it should be and they are taking advantage of it. Take profits and buy puts to take advantage on the investor end.
Bearish MACD cross appearing on the daily chart.
"The company is offering $2 billion of Class B common shares and $1 billion of a preferred stock that is convertible into the Class B common, ViacomCBS said Monday. The shares are the company’s nonvoting equity. The newly issued stock will start trading on March 24, Bloomberg News reported."
"Morgan Stanley and JPMorgan Chase & Co. are managing the offering. ViacomCBS granted them options to purchase up to $450 million in additional shares."
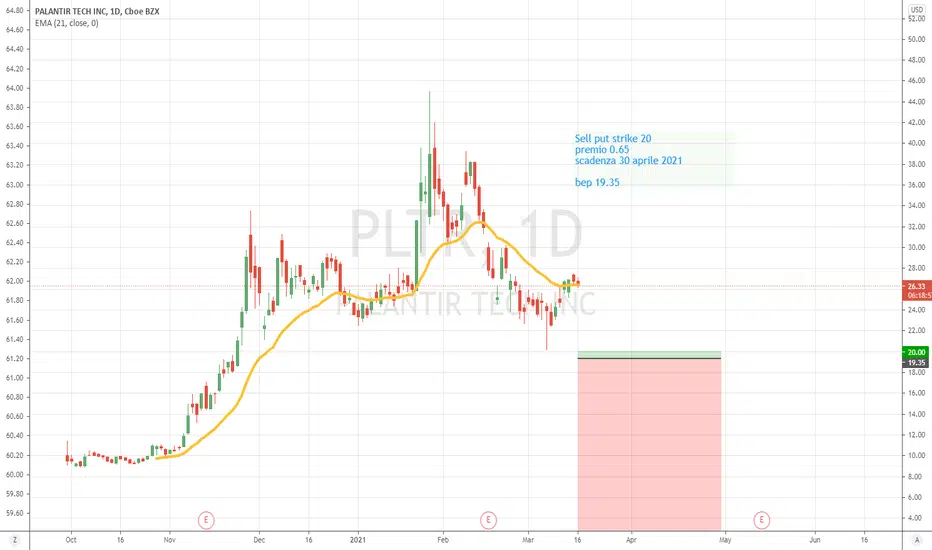
VIAC looking juicy for a short/putI don't own stock anymore, I, unfortunately, sold once it hit its fair value estimate of $57. If I owned stock I would either sell it or use some of it to sell calls against to take advantage of the inflated options premiums by collecting that weekly as it goes down.
As you can see the separation between the moving averages and the stock price has gotten into nose-bleed territories, the RSI looks grossly overbought for an extended period of time. This party has to come to an end. Not saying this will crash like the overcooked QS did but I would say if you don't have any exposure an in-the-money put option would be nice. ITM put options will have strikes above the current stock price and they have the trade-off of being more expensive but having a higher probability of profit without depending on a severe decline.
Looks to be overbought to an alarming level, look out below.


Facebook dropping to 233-240If you look at the day chart there isn't a single high volume gap that isn't filled. Facbook has been consolidating for about a week now between 255-266. more often then not the consolidation follows the trend that lead into it. this would cause it to push down in price to the 244 support levels. if it breaks that then it will continue to fall and fill its gap between 235-243.
Main curve ball being the stimulus check tho

$CRM - Salesforce Earnings PlayI don't have confidence in Salesforce. I haven't taken these options yet, might still update the strategy. It NEEDS to break it's support level before I take the trade.

$WFC - Bearish Signal (Weekly Puts) Same idea as last week, weekly puts. I would choose NYSE:WFC weekly 35.5 P @ 0.17


Purchasing CVS Puts with 12 Mar expPrice appears to have been rejected between $71 and $70. Therefore, I am expecting price to break lower through the most current support and fall to the next support around $68 and $67.

MSFT march/5th 242.50 strike PUT option MSFT looks like its at its high after the breakout it had
i decided to place a put option.
indicaters are facing down and it may be over bought
my view and my opinion do your work

TSLA set to POP
I'm looking at this vertical put spread, Feb21 800/805. Why? I'm bullish and I don't really see TSLA dropping below 805 this week or next with all the BTC hype. Took a 100 pair position for a 10k return in 10 days 🤞 and feeling pretty good about it. NASDAQ:TSLA NASDAQ:TSLA

Microsoft - Strong correction - Going shortI have taken put225 options, I am sure about the correcion


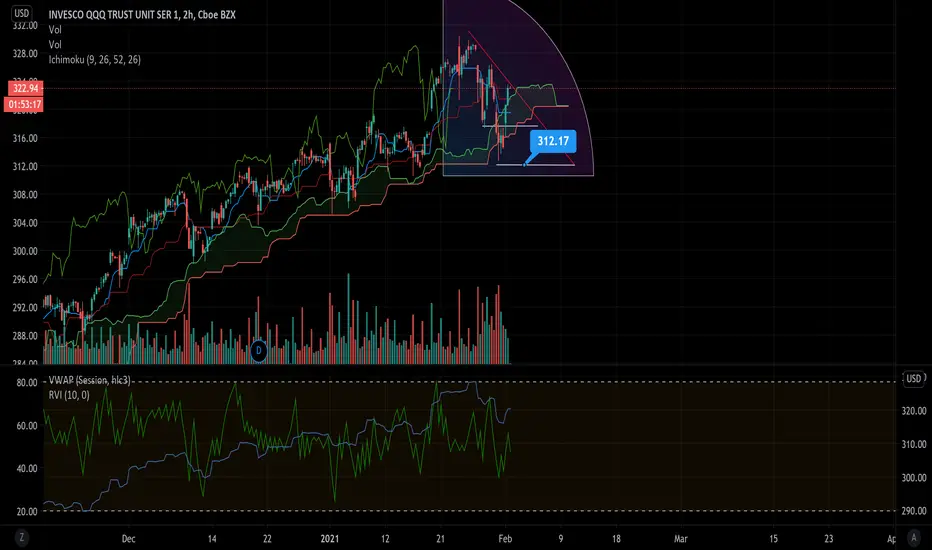
WEAK FOMO RALLY Possible fakeout bull trap incoming
Watch for a breakout with large volume at these levels.
IMO perfect example of premium arbitrage.
Keep put/call ratio under your radar!
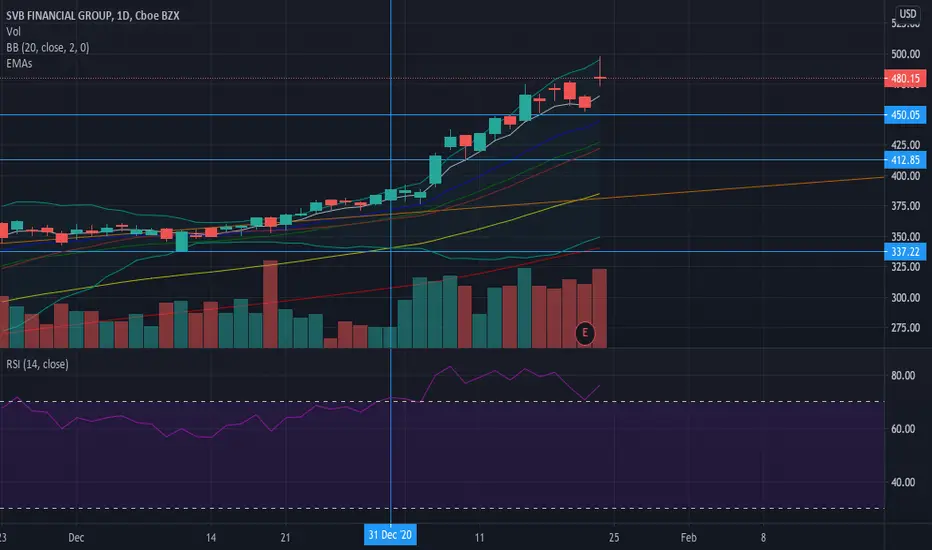
SIVB put spreadDecent earnings, still above 70 RSI, watch for a slight dip on monday but as long as it holds $550 support, I think it should continue to trade in this range and up. 2/19/21, 460/450 put spread @2.70 hoping to swing for a few weeks. Looking for a $1.60 exit.
PUT/CALL SETUP MAJOR DECLINE Chart posted is that of the weekly put/call based on 5 ,10,20 week near and record call buying .I maintain a full short from 3744 and will add today at 3824 I am long US $ NOW BEARISH GOLD AND SHORT ALL BANKS NOW

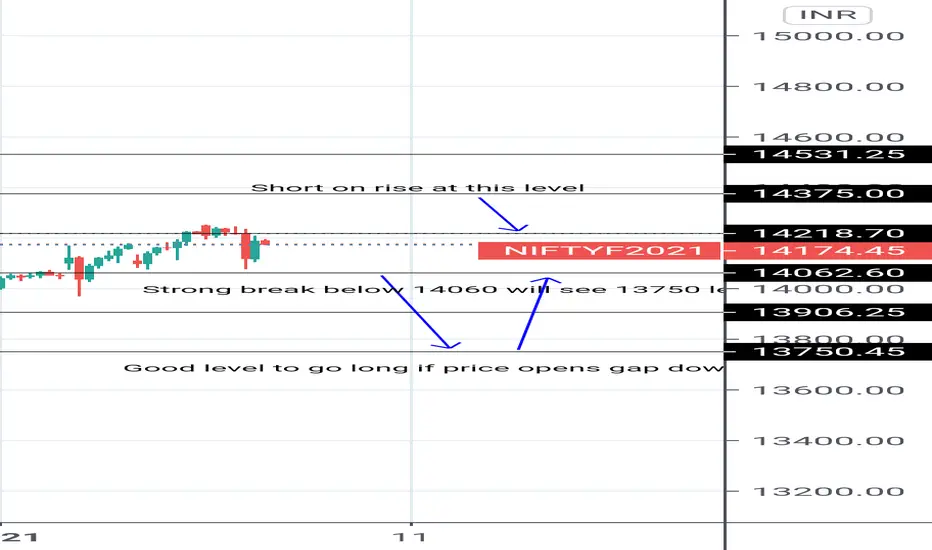
Nifty intraday setup for next 2 daysimportant levels marked with type of entry to take...one can use ce or pe at these levels
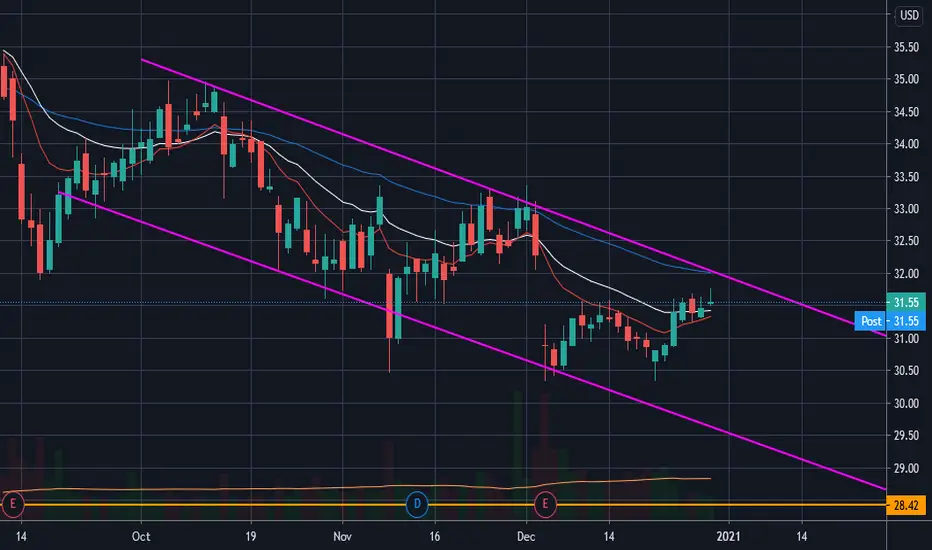
Kroger BearishI am not licensed or certified by any individual or institution to provide financial or investment advice.
I believe Kroger (KR) is in a downtrend. I have marked what I believe to be the support and resistance with purple trend lines. As of this writing (December 30, 2020 4:00pm) I am not in any positions, bearish or bullish, in KR. If KR continues up to the Resistance and then bounces down, or if it fails to reach Resistance and just continues down, I may buy some Puts.
Tutorial: PC-Indicator - Spar_maDeutsche Version Unterhalb.
English version:
This indicator is supposed to be another tool to recognize when a panic movement has begun and also ended. Of course, there are other indicators that work very well, but this can also help to identify the timeframe.
Description of for using the indicator with the example of the panic sell-off in March:
Before the selloff started, two areas can be identified in which the market is being tested. This is when at the same time, the price intersects with the 21 moving average and the put / call indicator. This indicates that something could be wrong (no guarantee, just an indicator). This happened first (marked with 1) when the virus was discovered: Few who had been informed had any idea what might happen. The second "drop" (marked 2) happened when it was publicly announced that such a virus existed. The third time the panic broke out (marked 3) long after the virus was known. The portfolios should have been hedged here at the latest. Shortly before the yellow marking the virus was reported daily and maximum panic were spread. This was the point at which the hedge could theoretically be ended (if you have the courage to do so). However, I myself waited until the 21st and the indicator were clearly broken.
This indicator could have helped to save a loss in value of the portfolio by at least 17%. I hope this indicator can continue to perform as well.
Please leave a like and subscribe if you are interested in further trading ideas from me.
Name of the indicator: “PC-Indicator - Spar_ma”
That’s my opinion and should be treated like it.
No trade advice!
______________________________________________________________________________________________
Deutsche Version:
Dieser Indikator soll ein weiteres Tool sein um erkennen zu können, wann eine panische Bewegung beendet ist. Natürlich gibt es weitere Indikatoren die sehr gut funktionieren, dieser kann jedoch zusätzlich dabei helfen zu erkennen wann es soweit ist.
Beschreibung des Indikators an Beispiel des Panischen sell-offs im März:
Bereits vor beginn sind zwei Bereiche zu erkennen, an denen der Markt getestet wird. Dabei kreuzen sich gleichzeitig der Kurs mit dem 21-gleitendem Durchschnitt und dem Put-/Call- Indikator. Das lässt darauf zurückführen, dass etwas kommen könnte. Dies geschah zuerst (mit 1 gekennzeichnet) bei der Entdeckung des Virus: Wenige die Informiert wahren, jedoch ahnten was passieren könnte. Der zweite „Drop“ (mit 2 gekennzeichnet) geschah als öffentlich bekannt gegeben wurde, dass ein solches Virus existiert. Beim dritten Mal brach die Panic aus (mit 3 gekennzeichnet), lange nachdem dieser Virus bekannt gewesen war. Spätestens hier sollte das Konto gehedged worden sein. Erst kurz vor der gelben Markierung wurde täglich vom Virus berichtet und maximale Panic verbreitet. Dies war der Zeitpunkt an dem theoretisch der Hedge beendet werden konnte (wenn man den Mut dazu hat). Ich selbst habe allerdings noch gewartet bis der 21ger und auch der Indikator klar durchbrochen wurde.
Dieser Indikator hätte dabei helfen können einen Wertverlust des Kontos um mindestens 17% ersparen zu können. Ich hoffe dieser Indikator kann weiterhin so gut performen.
Bitte lasst ein like da und abonniert mich, falls Ihr Interesse an weiteren trading-ideen von mir habt.
Name des Indikators: “PC-Indicator – Spar_ma”
Dies ist nur meine persönliche Meinung und sollte auch so betrachtet werden.
Dies ist keine Handelsempfehlung.
