PYTH/USDT Breakout Watch Is the Accumulation Phase Finally Over?📌 Technical Overview:
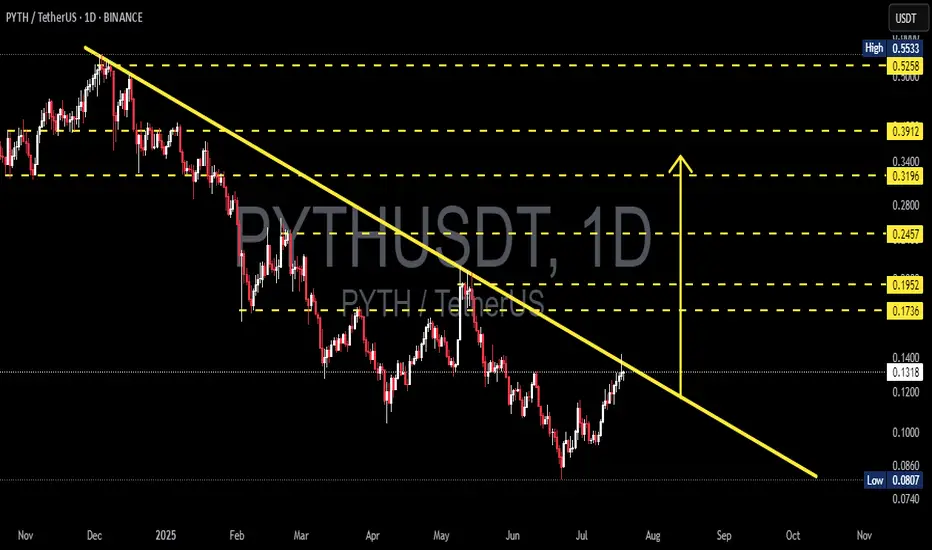
After nearly 8 months in a strong downtrend, PYTH/USDT is now showing signs of a potential trendline breakout. Price action is testing a critical descending resistance that has been respected since late 2024. This could be the turning point for a major trend reversal.
📉 Historical Context:
PYTH reached a high of $0.55, followed by a consistent downtrend with a series of lower highs and lower lows.
Since June 2025, however, the structure has shifted to higher lows, signaling early accumulation and waning bearish momentum.
📐 Technical Pattern: Descending Trendline Breakout
Price is currently challenging a long-term descending trendline, which has held as resistance since November 2024.
The pattern resembles a falling wedge/descending triangle breakout, typically viewed as a bullish reversal pattern.
A recent bullish candle is attempting to break above the $0.13 level, indicating growing momentum.
🟩 Bullish Scenario: The Reversal is On
If price closes above $0.13–$0.14 and confirms the breakout:
1. Short-Term Targets:
🔼 $0.1736 (Minor resistance / previous demand zone)
🔼 $0.1952 (Breakout retest zone)
2. Mid-Term Targets:
🔼 $0.2457 (Strong consolidation area)
🔼 $0.3196 – $0.3912 (Pre-breakdown range highs)
3. Long-Term Target:
🔼 $0.5258 – $0.5533 (Previous market top)
> A successful breakout could trigger a rally of +200–300%, especially if supported by market-wide bullish sentiment.
🟥 Bearish Scenario: Fakeout Risk
If price fails to hold above the trendline and drops below $0.12:
Support zones to watch:
🔽 $0.1000 (psychological level)
🔽 $0.0860
🔽 $0.0807 (major bottom support)
This would indicate a bull trap, and the market could return to a distribution phase.
🔍 Additional Confluences:
RSI is rising toward 60–65, suggesting bullish momentum is building.
Volume is increasing near the breakout — a good sign of trader interest.
A Golden Cross (EMA 50 crossing EMA 100) could occur soon if upside holds.
✅ Conclusion: Critical Pivot Zone
PYTH is testing a major inflection point. If confirmed, this breakout could end the long-term downtrend and launch a new bullish cycle. A rejection here, however, keeps the bear case alive.
#PYTHUSDT #PYTHBreakout #CryptoAnalysis #AltcoinSetup #TechnicalAnalysis #BreakoutCrypto #TradingView #TrendReversal #CryptoSignals #FallingWedge #BullishMomentum
Pythusdtsignal
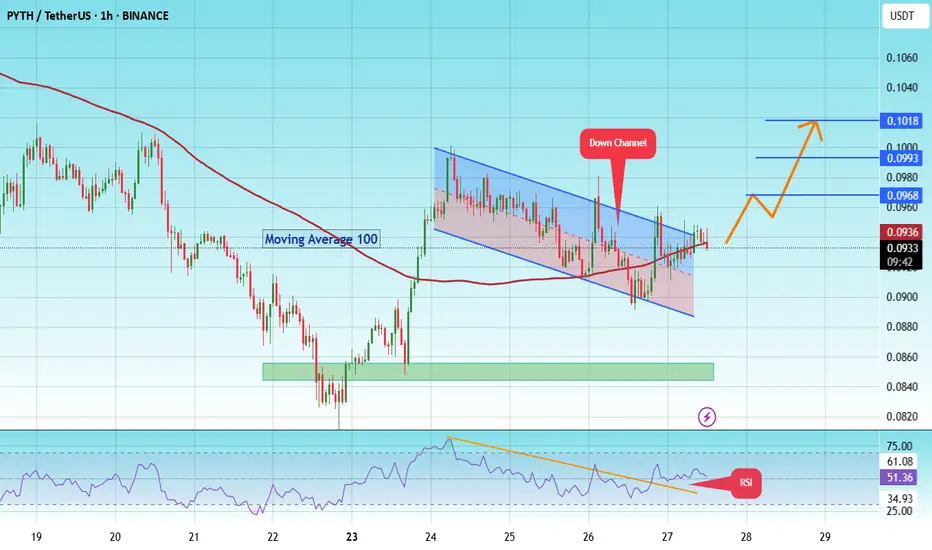
Pyth pump to $0.1018 soon! #PYTH
The price is moving within a descending channel on the 1-hour frame and is expected to break and continue upward.
We have a trend to stabilize above the 100 moving average once again.
We have a downtrend on the RSI indicator that supports the upward break.
We have a support area at the lower boundary of the channel at 0.0895, acting as strong support from which the price can rebound.
We have a major support area in green that pushed the price upward at 0.085.
Entry price: 0.0936
First target: 0.0968
Second target: 0.0993
Third target: 0.1018
To manage risk, don't forget stop loss and capital management.
When you reach the first target, save some profits and then change the stop order to an entry order.
For inquiries, please comment.
Thank you.
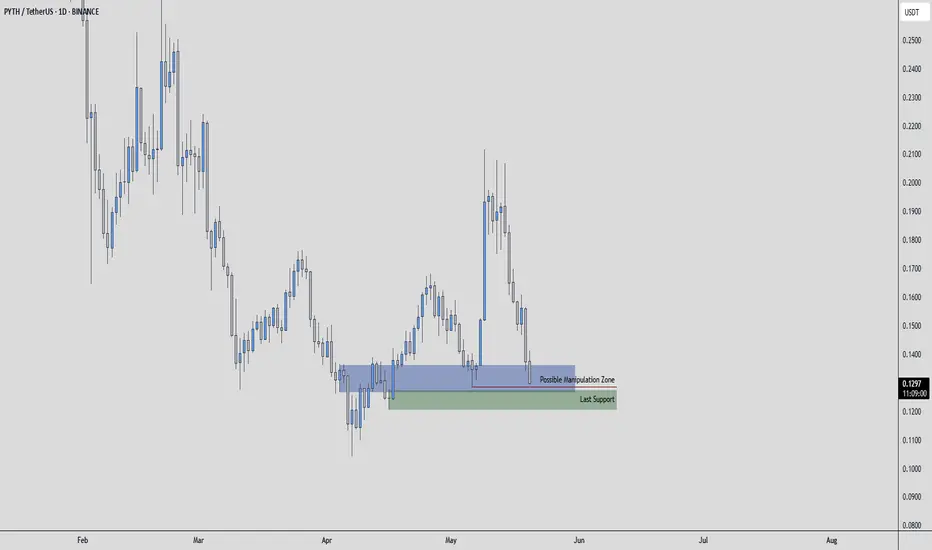
PYTHUSDT | Short Zone at the Blue Box—Proceed with Extra CautionPYTHUSDT is pressing lower with conviction, and the blue box marks our primary area to consider short entries. Although buyers are technically present, their support feels fragile; every test of this zone risks failing unless you have a strong appetite for heightened risk.
Why the Blue Box Matters
• Price has paused here before, making it a logical spot for sellers to reemerge.
• The current decline suggests sellers are in control and likely to defend this zone again.
Conditions for a Short Entry
Lower‑Time‑Frame Breakdown
Observe a clear breakdown pattern on shorter charts—whether a series of lower highs or a decisive support breach.
Volume Confirmation
Seek evidence that selling volume outpaces buying volume as price approaches the blue box.
CDV Divergence
Confirm that cumulative delta volume does not support the rally, indicating genuine exhaustion among buyers.
Entering here demands extra conviction and precise execution. If these confirmations line up, a short trade could offer favorable risk‑reward. Without them, it is wiser to watch from the sidelines until a clearer setup emerges.
📌I keep my charts clean and simple because I believe clarity leads to better decisions.
📌My approach is built on years of experience and a solid track record. I don’t claim to know it all but I’m confident in my ability to spot high-probability setups.
📌If you would like to learn how to use the heatmap, cumulative volume delta and volume footprint techniques that I use below to determine very accurate demand regions, you can send me a private message. I help anyone who wants it completely free of charge.
🔑I have a long list of my proven technique below:
🎯 ZENUSDT.P: Patience & Profitability | %230 Reaction from the Sniper Entry
🐶 DOGEUSDT.P: Next Move
🎨 RENDERUSDT.P: Opportunity of the Month
💎 ETHUSDT.P: Where to Retrace
🟢 BNBUSDT.P: Potential Surge
📊 BTC Dominance: Reaction Zone
🌊 WAVESUSDT.P: Demand Zone Potential
🟣 UNIUSDT.P: Long-Term Trade
🔵 XRPUSDT.P: Entry Zones
🔗 LINKUSDT.P: Follow The River
📈 BTCUSDT.P: Two Key Demand Zones
🟩 POLUSDT: Bullish Momentum
🌟 PENDLEUSDT.P: Where Opportunity Meets Precision
🔥 BTCUSDT.P: Liquidation of Highly Leveraged Longs
🌊 SOLUSDT.P: SOL's Dip - Your Opportunity
🐸 1000PEPEUSDT.P: Prime Bounce Zone Unlocked
🚀 ETHUSDT.P: Set to Explode - Don't Miss This Game Changer
🤖 IQUSDT: Smart Plan
⚡️ PONDUSDT: A Trade Not Taken Is Better Than a Losing One
💼 STMXUSDT: 2 Buying Areas
🐢 TURBOUSDT: Buy Zones and Buyer Presence
🌍 ICPUSDT.P: Massive Upside Potential | Check the Trade Update For Seeing Results
🟠 IDEXUSDT: Spot Buy Area | %26 Profit if You Trade with MSB
📌 USUALUSDT: Buyers Are Active + %70 Profit in Total
🌟 FORTHUSDT: Sniper Entry +%26 Reaction
🐳 QKCUSDT: Sniper Entry +%57 Reaction
📊 BTC.D: Retest of Key Area Highly Likely
📊 XNOUSDT %80 Reaction with a Simple Blue Box!
📊 BELUSDT Amazing %120 Reaction!
📊 Simple Red Box, Extraordinary Results
I stopped adding to the list because it's kinda tiring to add 5-10 charts in every move but you can check my profile and see that it goes on..
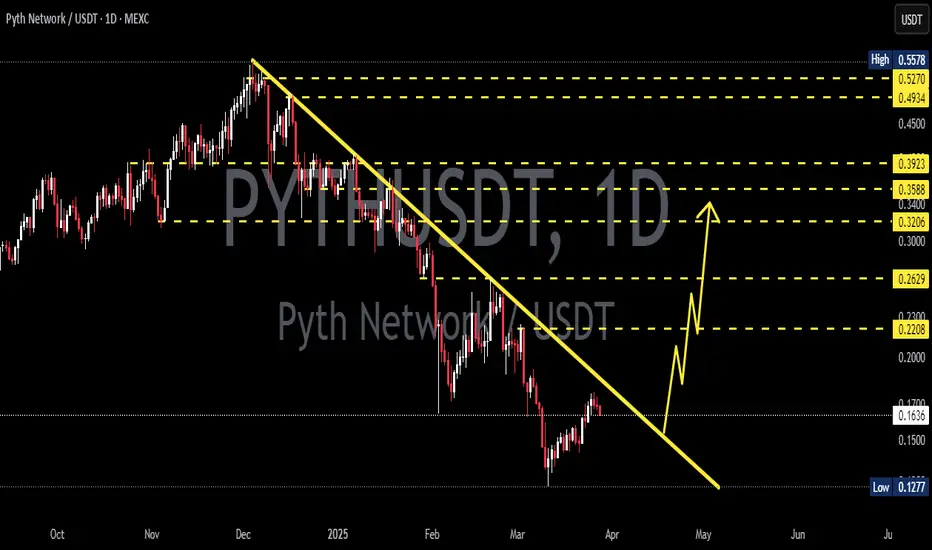
PYTHUSDT 1DPYTH ~ 1D Analysis
#PYTH Buy gradually after successfully penetrating this resistant line with a short -term target of at least 10%+.
PYTHUSDT 12HPYTH ~ 12H Analysis
#PYTH Pay attention to this coin. Buy after successfully penetrating this resistant line with a short -term target of at least 10%+.

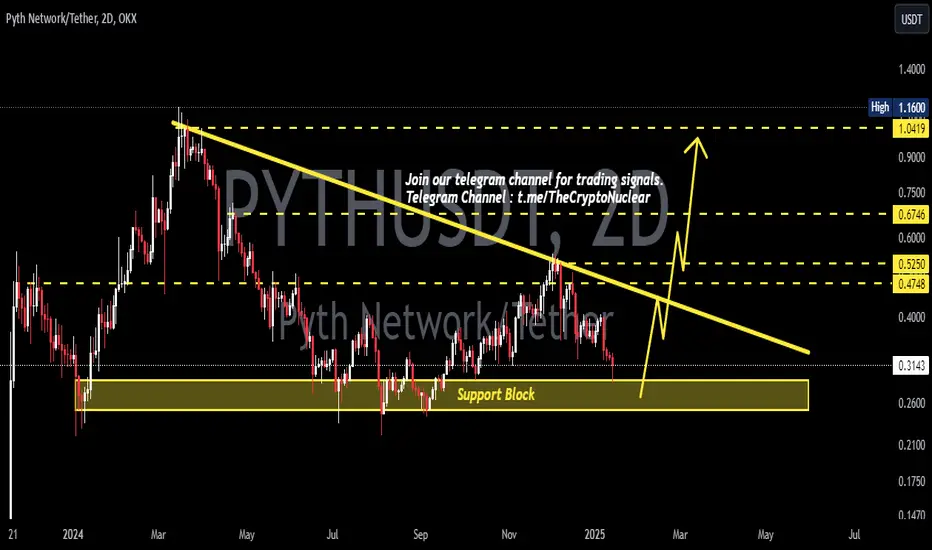
PYTHUSDT 2DPYTH ~ 2D
#PYTH So far this support block continues to keep the price from dropping any lower. If you still have Conviction on this coin, buy it gradually with a target of 20%++
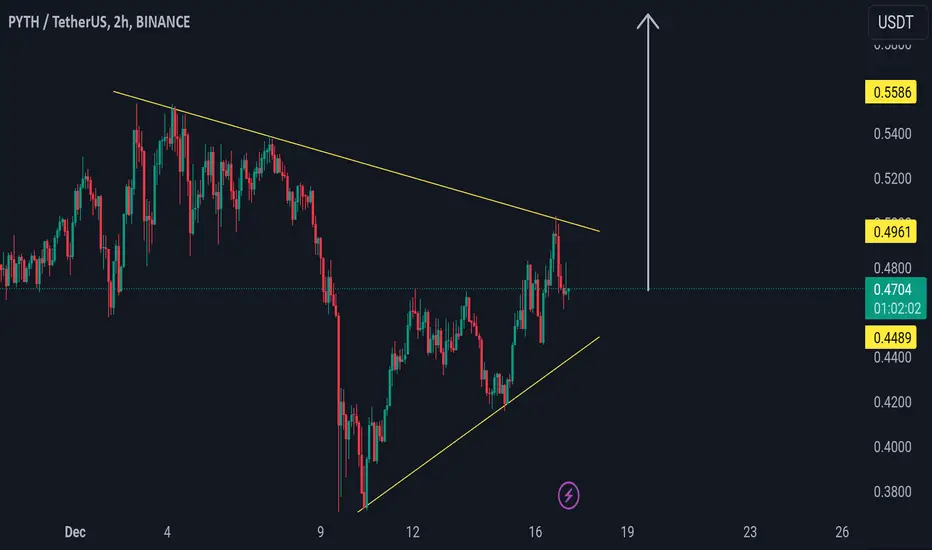
PYTH / USDT : Eyeing a Breakout at Trendline resistance PYTH/USDT: Eyeing a Breakout at Trendline Resistance
PYTH/USDT is gearing up for a significant move 📈 as it nears a critical trendline resistance zone 📊. The pair is moving with momentum, and this time, a breakout looks highly promising 💥. If confirmed, this could pave the way for a strong bullish trend 🚀. Keep it on your radar 👀 and watch for key confirmations before entering.
Key Insights:
1. Trendline Resistance: PYTH/USDT is approaching a key trendline that has been a consistent hurdle. A breakout above this level could trigger substantial upside movement.
2. Volume Watch: A surge in trading volume during the breakout will confirm buyer strength 🔥.
3. Bullish Momentum: Indicators like RSI and MACD are leaning bullish ⚡, hinting at an impending breakout.
Steps to Confirm the Breakout:
Look for a decisive 4H or daily candle close above the trendline 📍.
Check for a volume spike during the breakout to confirm strong buying pressure 📊.
A successful retest of the broken resistance as new support will validate the move ✅.
Stay vigilant for fakeouts, such as sharp pullbacks or wicks above the trendline ⚠️.
Risk Management:
Utilize stop-loss orders to safeguard your position 🔒.
Align position sizes with your overall trading plan 🎯.
This analysis is for educational purposes and not financial advice. Always DYOR before making investment decisions.
PYTHUSDTPYTH ~ 3D
#PYTH So far the price is maintaining this Support Block. if you have Conviction on this coin,. Maybe now is a good time to make purchases in stages.

PYTHUSDT 1DPYTH ~ 1D
#PYTH Very confusing
Whether to buy or worry.
we will give a conclusion.
in a bull market all bearish patterns may be easy to validate or fail structurally.
Losing this Support Block will make this bearish Pattern real, or if SEED_DONKEYDAN_MARKET_CAP:PYTH manages to defend this Support Block, We will say this bearish Pattern will fail.

PYTHUSDT 1DPYTH ~ 1D
#PYTH Looks like a Confirmed Double Bottom pattern.
Make purchases in stages within this support Block. short term target of at least 15%+

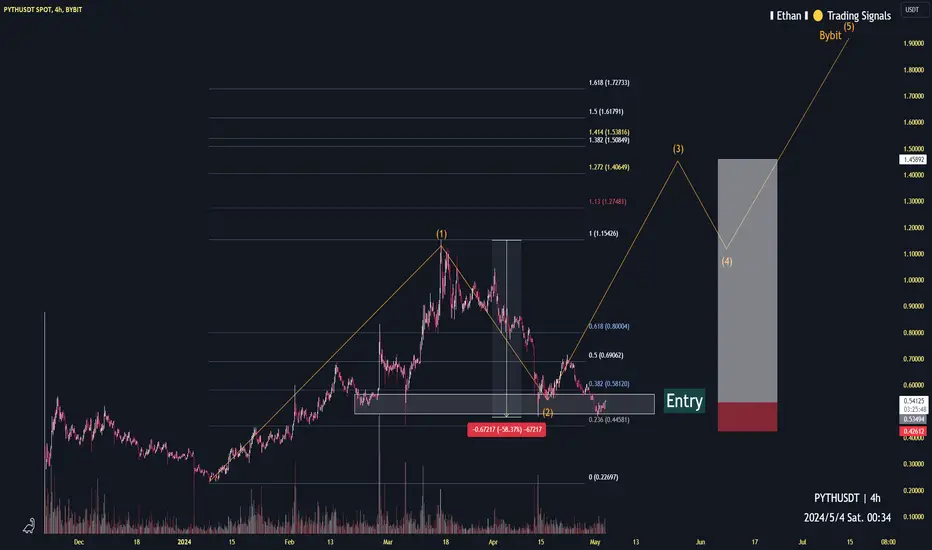
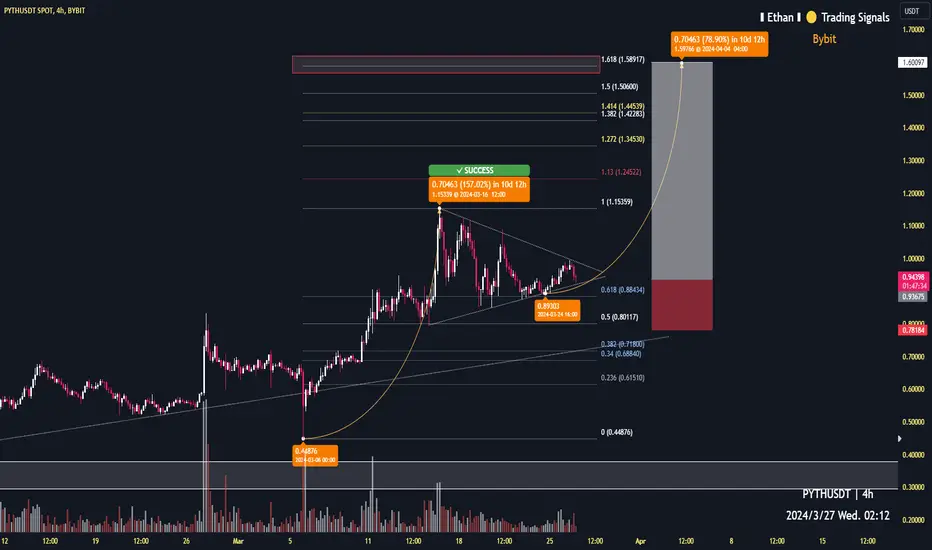
PYTH taget $1.45 (perp)4h time frame
-
TP: $1.4~$1.53
SL: $0.426
-
PYTH follows the Elliott 2nd wave with being sold off since $1.15, but got support from the structural support zone and 0.382 Fibonacci projection, both form a robust bottom at $0.5 so far. If PYTH goes the assumed path, I can say next big pump, made of Elliott 3rd wave, is following and will bring PYTH to make ATH soon. It is hard to estimate critical resistance once PYTH goes over $1.15, so we can use Fibonacci tool to set up the target to profit around $1.4~$1.53, which RRR is over 8.
-
Refer to link below if you're interested in my perspective of Bull High of PYTH.
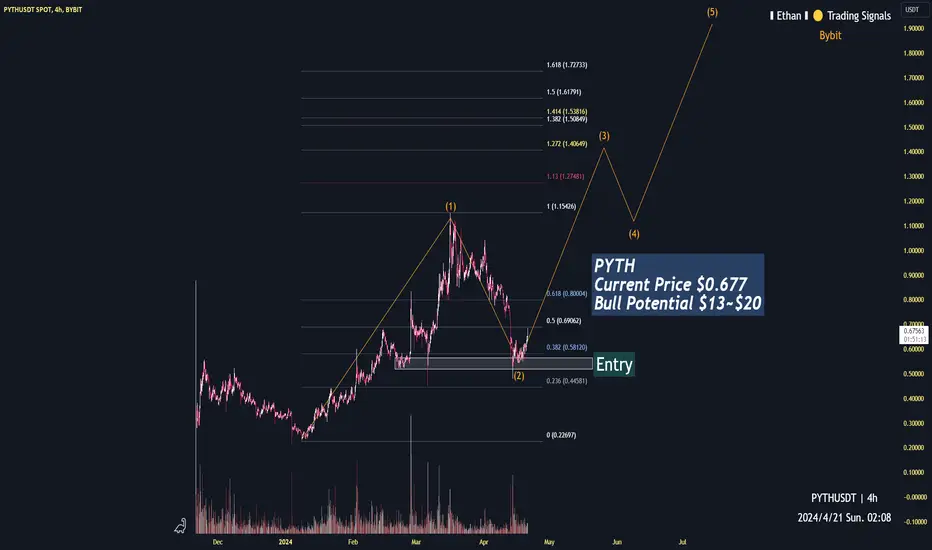
PYTH target $134h time frame
-
PYTH has sold off rapidly in the early of April, and saw lows of $0.48. From perspective of TA, PYTH is correcting with the 2nd wave of Elliott impulse wave that is great for accumulation of momentum to build the 3rd wave. $0.48 aforementioned is also the corresponding support zone to the price zone built in Feb. In conclusion, $0.48~$0.58 are a good zone to enter, and target is put on $13 once the bull starts.
-
Bull target: $18~$20
PYTHUSD 4HPYTH ~ 4H 📈
#PYTH Make purchases gradually from here with a minimum target of 15%+ from here. 📈

PYTH target 1.584h time frame
-
PYTH is consolidating as a triangle pattern, which could be see as a potential continuation. Before completing structure, PYTH just retested 0.618 Fib Projection and got support. Both signal indicate that PYTH is still on an uptrend way.
-
TP: 1.58
SL: 0.781
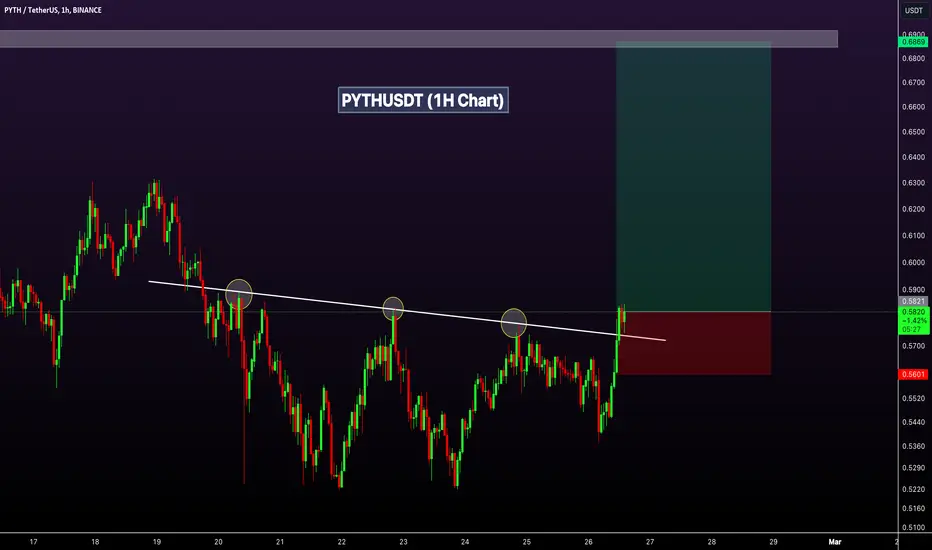
PYTHUSDT Buy Setup!PYTHUSDT Technical analysis update
PYTH price bro out its resistance line after repeatedly testing it.
Buy level: $0.585
Stop Loss:$0.56
Regards
Hexa