$QCOM Long setup opportunity.Bouncing off the .5 Fibonacci retracement level. A good way to play this is to set your stop below that level and to set your profit target to the next resistance level.
Like if you’re bullish!
QCOM
Great Qualcomm play on the retest of the long-term uptrendThe uptrend line from March lows will need to be retested at some point in the medium-term future.

QCOM - Brush it off and get up that hill soldier!We are emerging nicely from the selloff. We have a Positive Squeeze happening with bullish candles. After all the selloff was overdone. With a low PE ratio of 24.93 and and a nice EPS we are at a good spot over the next week or so to move higher. Also the volume increase into the close was very nice. This is why I rarely hold stocks into earnings :) GL!

Qcom dipped 10% down after earnings but beatGreat company and they beat this Quarter and the 3 prior Quarters. Nice Revenues, low PE ration, and a nice EPS. They only dipped because of some further looking difficulties.


Forecasting Plan Qualcomm Wednesday, 23 December 2020
8:32 AM (WIB)
Technology and Artificial Intelligence with 5G will be a more powerful dynamic in every aspect of life with Qualcomm.
investor.qualcomm.com
Best regards,
RyodaBrainless
"Live to Ride and Ride to Live"

QualcommTuesday, 15 December 2020
5:23 AM (WIB)
Billions, maybe trillions of times a day…
That’s how often people around the world touch something made better by Qualcomm. It could be the smartphone in your pocket, the tablet on your coffee table, that wireless modem in your briefcase… it could even be that navigation system in your car or that action camera strapped to your chest. Who is Qualcomm, and what do we do? We are engineers, scientists, and business strategists. We are from many different countries and speak many different languages. We come from diverse cultures and have unique perspectives. Together, we focus on a single goal—we invent breakthrough technologies that transform how the world connects, computes, and communicates.
We often do what many thoughts were impossible.
Related Links:
www.qualcomm.com
www.youtube.com
Best regards,
RyodaBrainless
"Live to Ride and Ride to Live"
LONG QCOM Good R:R = 4.24Expecting continuation of a trend after pullback. Good risk reward 4.24.
This is a pending order, or you can sell $145 PUT options and collect premium regardless of whether it fills or not.


QCOM 1D RANGE LONG TRADERanges are repeatable trading chart patterns.
Ranges are consolidation chart patterns that can breakout either direction.
Each chart pattern will have defining trendlines of the support/resistance levels creating the pattern.
What ever time frame you are trading this chart pattern, wait for a candle close outside of the trendline in the direction of the breakout candle. (Our time frame preference is the Daily chart).
Add volume indicator - Volume is the amount of $ that went into a particular candle or in Forex the # of trades that took place.
Add ATR indicator - Volatility is the amount of price movement that occurred. Use the ATR to measure the price movement.
When you see descending Volume bars and descending ATR line (which indicates volatility) this shows
a dis-interest in traders to invest in this pair creating consolidation which creates the chart pattern.
Trade Management after there is a breakout candle close.
1 - Position size (compare volume bar to volume ma line).
a - Breakout candle must be 100% of volume average for a full position size.
b - If 75% of volume average then ½ position size. (To find 75% of Volume
look at the charts volume settings – divide smaller # into larger # = 75%+)
If not 75% then stand aside from the trade.
2 – If candle breaks out of a trendline, 15m before the close of the day prepare your buy/sell order.
Enter two trades. 1st trade will have a SL & TP. It will close automatically when the 1st TP is hit. 2nd
trade only has a SL and will be allowed to run. When 1st TP is hit move the SL to breakeven. Look
at ATR and prepare SL at 1.5 of ATR. Prepare 1st trade TP at 1 of ATR.
3 - SL for both trades will be 1.5 x ATR.
4 - 1st trade TP will be 1 x ATR.
5 - No TP on 2nd trade – letting profit run and adjusting SL to follow price.
6 - When 1st TP hit – move 2nd trade SL to breakeven.
7 - Adjust the 2nd trade SL to follow price.
*8 – After Breakout candle – if price closes back into chart pattern close trade don't wait for SL to be hit.
*9 - When breakout candle is more than 1 ATR from breakout candle open.
a - Enter 1st trade at candle close with ½ position size.
b - Enter 2nd trade with a pending limit order that is 1 ATR of breakout candle open.
c – Price should pullback to that pending limit order for 2nd trade.
d – If Price returns back into chart pattern close trade before SL is hit.

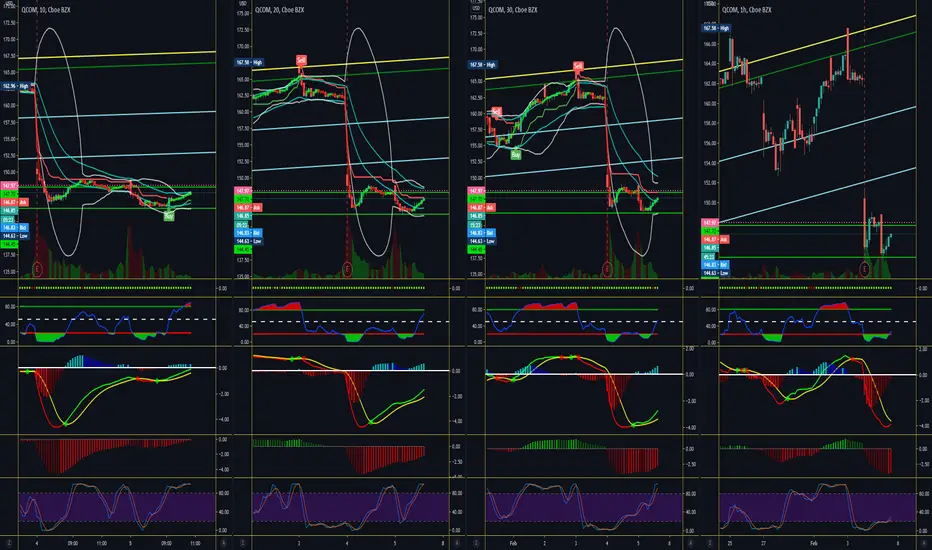
QCOM w48 2020. Ready to short from 145 to 132Daily
I do not see reasons and power to go next.
Price should have a rest = corrected
Better to go out to see clear trend.
Open only from levels of SR
Going short
Open 145
SL 150
TP 132
RR 3.35

Qualcomm (QCOM): A Fundamental and Technical AnalysisIn this post, I’ll be providing my own analysis on Qualcomm (QCOM), shedding light on the fundamental and technical aspect of the stock.
What is Qualcomm?
Qualcomm (QCOM) is short for ‘Quality Communications’.
The American company was established by a communications engineer, Irwin Jacobs.
It’s a company that focuses on semiconductors, software, and wireless technology services.
Business Model
- Qualcomm is divided into two main businesses: QCT, and QTL
QCT
- QCT (Qualcomm CDMA Technologies) develops and supplies integrated circuits and system software
- Specifically, it develops and supplies systems and software used in mobile devices, wireless internet, communications devices, internet of things, and semiconductors used for vehicle infotainments.
- The smartphone AP is a core device that controls the OS, CPU, memory, audio, and the camera
- Qualcomm currently covers 50% of the market share for mobile device APs, and dominates 88% of the 5g Smartphone AP market.
- They are way ahead of their counterparts in both market share and technology.
- Qualcomm also offers a cloud service for vehicles, allowing wireless updates to take place
- They have also developed an autonomous driving solution chip called Snapdragon Driving.
- We will see cars that use this chip in 2023
- The RF Solution, a wireless network that allows signals to be identified without confusion, is also increasing in demand
- QCT covers 75% of the company’s revenue.
QTL
- QTL (Qualcomm Technology Licensing) grants licenses and rights to use intellectual property to others.
- Qualcomm possesses patents on CDMA, LTE, 5g, video and audio codec, WIFI, GPS, NFC and Bluetooth.
- QTL covers 23% of the company’s revenue
Financials
- Despite the numbers not being anything extraordinary, Qualcomm has reported a consistent increase in yoy revenue
- Especially in the case of Q3 2020, we have seen revenue and earnings skyrocket.
- The firm’s Q1 earnings was $468m, $845m in Q2, and $2.96b in Q3
- Along with this, their EPS has also skyrocketed, and analysts estimate a an EPS of $2.07 for Q4
- Qualcomm has not been profitable for the past few years due to their heavy investment in research and development
- While a lot was invested in R&D, the commercialization of proprietary 5g technology could bring immense profits to the company in the near future
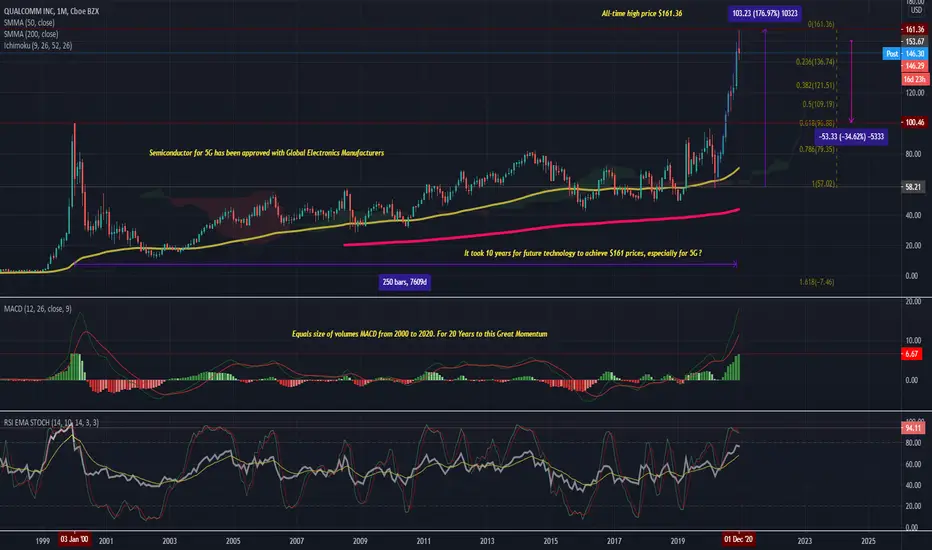
Technical Analysis
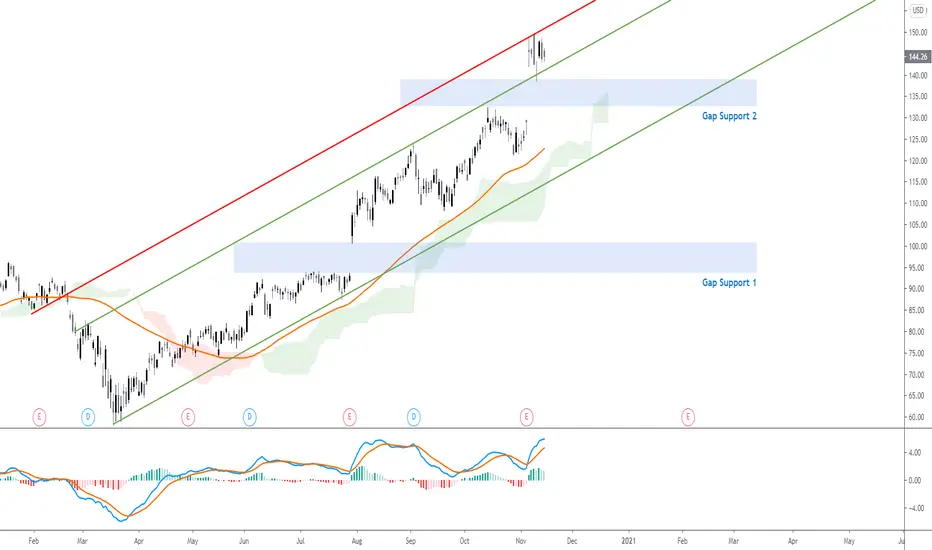
- The daily chart shows a clear uptrend, with prices creating higher lows and higher highs
- Prices are trading within an ascending parallel channel, having been rejected by the top trend line resistance
- There are two major gap supports at $100, and $140
- The Moving Average Convergence Divergence (MACD) demonstrates diminishing bullish momentum, with decreasing histograms
- Nevertheless, as prices trade above the Ichimoku cloud and the 60 Simple Moving Average (SMA), the overall trend is very bullish
Summary
In conclusion, Qualcomm is a company that has a proven, solid business model. Their heavy investment in research and development is finally seeing light as the company turns increasingly profitable. Technical analysis also demonstrates immense bullish momentum behind the stock’s price.
If you like this analysis, please make sure to like the post, and follow for more quality content!
I would also appreciate it if you could leave a comment below with some original insight.
SOXX 5smaNotice how the 5sma has been resistance for the SOXX for the past 12 trading days (red oval).
This tells us that short-term, SOXX has to break the 5sma to get out of its current down-trend.
The purple line is the 50sma, which is now also resistance, as we crossed below it, and is now touching the 5sma.

QCOM w43 2020. Risky long to 132$. Better w8 correction to 100$Whole Picture
Price in upward channel
Weekly
Uptrend reach its high.
Now its time to loose steam and get corrected for price.
If it is not good earning on Q3 it is better sell. and open from 112 - 118.
Price is on the top of channel. too risky to buy.
Case 1.
Positive Earnings and good political sitatuion = Long up to 143$
Open Now
TP 132$
SL 115$
Case 2 - more possible.
Weak earings in Q3. - deep correction to 100$
For now i think the best way is to work in short terms.

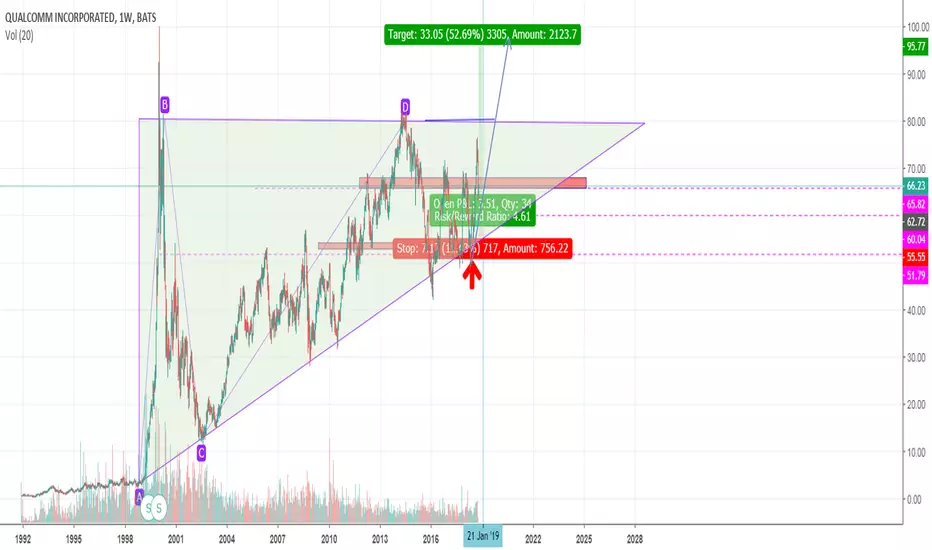
Long Position with break triangle patterGood day!
I see the clear triangle patter on 1w chart, now the price covered 2/3 of pattern and probably ready to test support and resistance.
After falling of SMP I expect accumulation of Momentum and power to make trend go up.
On RSI and chart we have slight Divergence, but i suppose its related to SMP falling and reflex it.
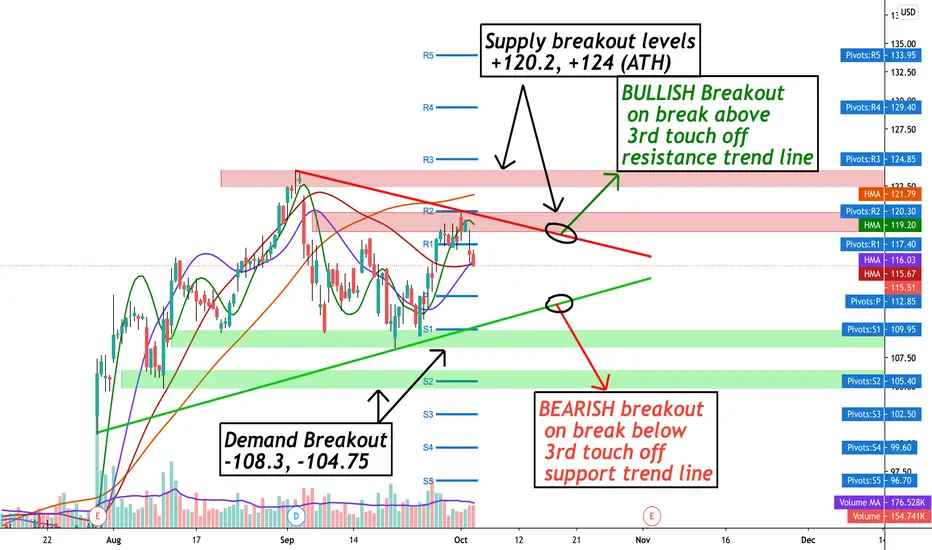
QCOM 4 hr symmetrical triangle breakout scenarios NASDAQ:QCOM Recently exploded above 100, fueled by the hype of 5G. looking at the 4 hr chart, we have a strong symmetrical triangle pattern formed with breakout potential to both the bull and bear side. QCOM appears to have only slowed down due to the recent sizable pullback to QQQ and the tech sector as a whole. I am feeling very bullish on QCOM and will be looking to scalp on breakouts of the 120.2 supply and the ATH. If tech continues to bleed, we could see a solid short opportunity on a break below the trend line support, using the demand zones as TP points.