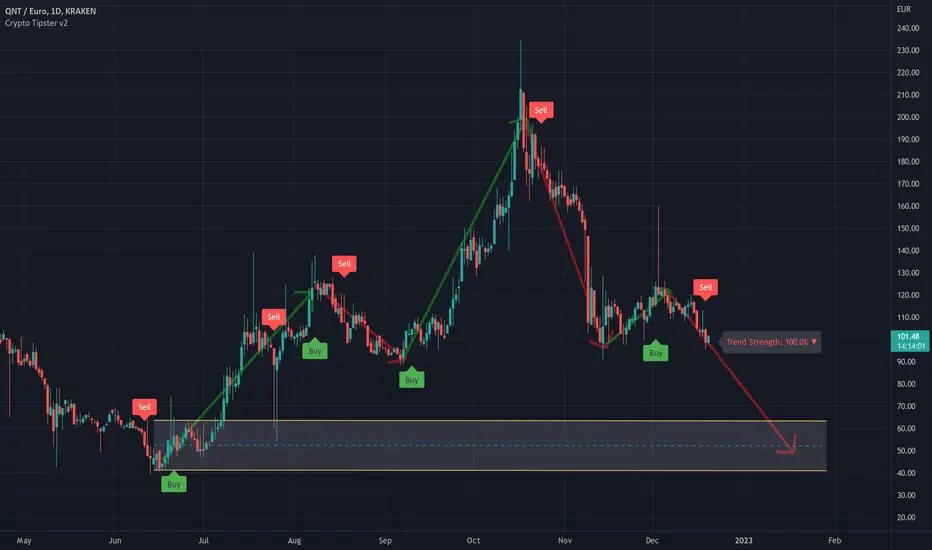
viewpoint Short For QNTHi, dear traders. how are you ? Today we have a viewpoint to SELL/SHORT the QNT symbol.
For risk management, please don't forget stop loss and capital management
When we reach the first target, save some profit and then change the stop to entry
Comment if you have any questions
Thank You
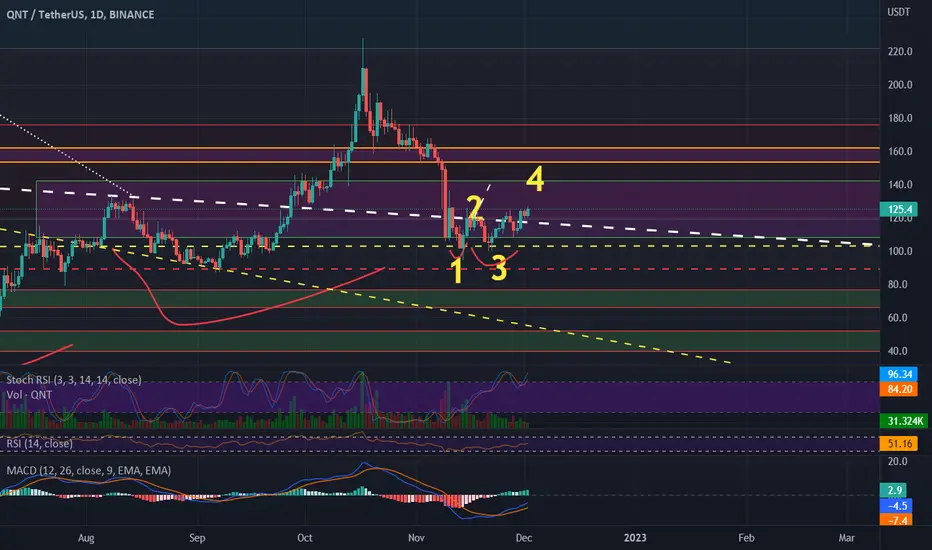
QNT

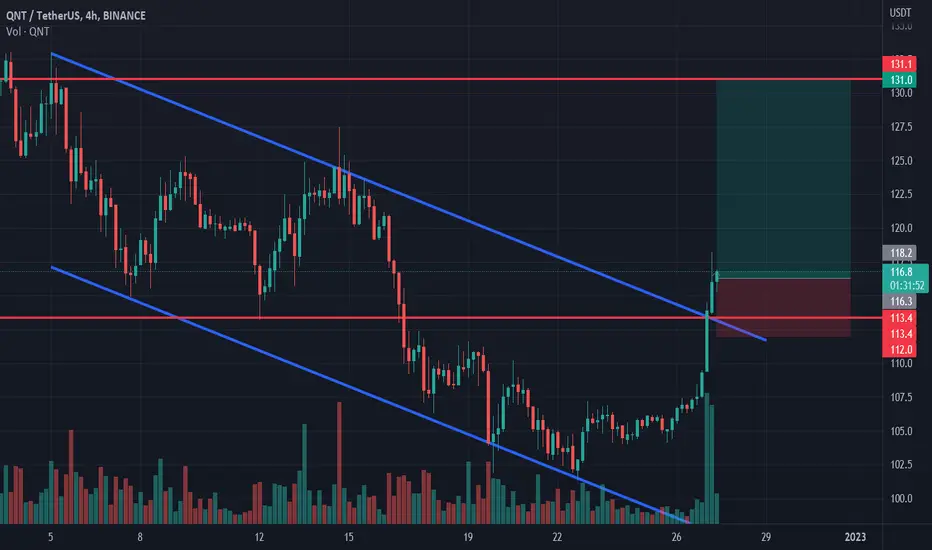
Quant longQuant broke trough off the upper boundary of descending channel. Asset broke trough the resistance level. Bullish movement to resistance level at 131 is expected to happen.
QNT : Day trade volumeQNT on Day trading seems to enter some important trend.
Interesting to see if this coin is able to get some confirmations on the day trading frame.
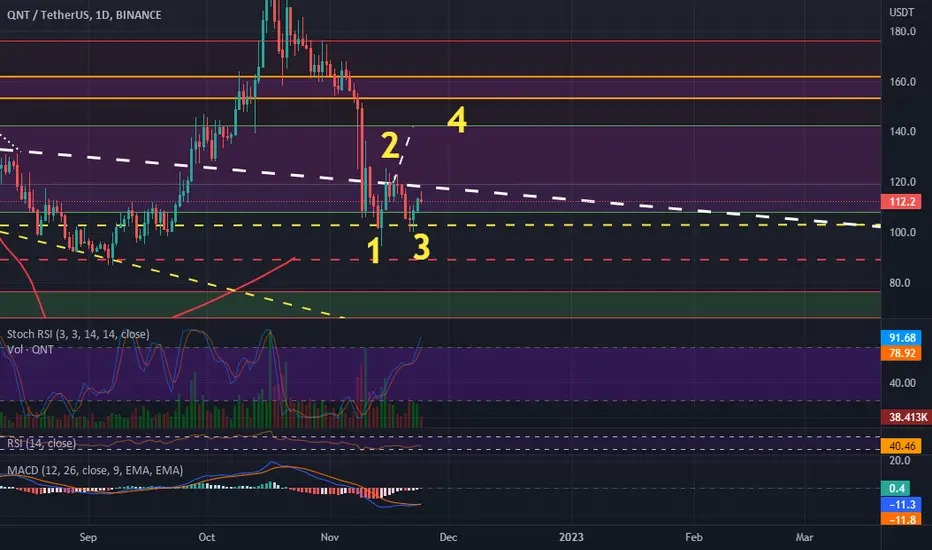
QNT CURRENTI think there is a shoulder head and shoulder formation in qnt and there is a negative dissonance in volume in terms of tangent, there is also a bearish retest image of rsi. I am predicting a strong decline in the coming days.
QNT breaking Head and Shoulder necklineQNT breaks head and shoulders neckline and price could drop 50%.
Target price = $44

QNTUSDT 1W Interval Targets and StoplossHello everyone, let's take a look at the 1W QNT to USDT chart as you can see that the price is moving below the downtrend line and is close to exiting the current triangle.
Let's start by setting goals for the near future that we can take into account:
T1 = $127.6
T2 = $148.7
T3 = $165.8
and
T4 = $182.5
Now let's move on to the stop loss in case the market goes down further:
SL1 = $102.6
SL2 = $82.6
SL3 = $66.4
and
SL4 = $50.8
Looking at the CHOP indicator, we see that the energy is gaining strength on the 1W interval, while the MACD indicator confirms the downward trend, but with a decreasing advantage of sellers.

QNTEUR 'D' - A Giant Head & Shoulder Pattern?Well, it looks like we've got a large head and shoulder pattern forming on the daily chart of Quant / Euro. It's going to take a month or more to see this form but if it does we're looking at a very healthy 50% reduction in market price.
Combine this information with a strong Sell signal from Crypto Tipster v2, and things could be looking like a downward trend for the immediate future of QNT.
QNTUSD 'D' - Sat on top of a RangeQuant is currently sat right on top of a clear area of historic market range. A slight drop into this area would offer an easy 10% drop in market price. With a descending line closing in on the current price too a rebound upward, alhough possible, is getting less likely as the days pass. Keep your eyes on this on!
QuantLooking for entry on quant before it takes off, seems to be a strong ecosystem and good overall dollar mover!
QNT ANALYSIS (1H)Hi, I hope you are well
For this symbol, I identified a diametric, and I think its wave f is a triangle. At the end of wave e, you can buy towards the announced targets

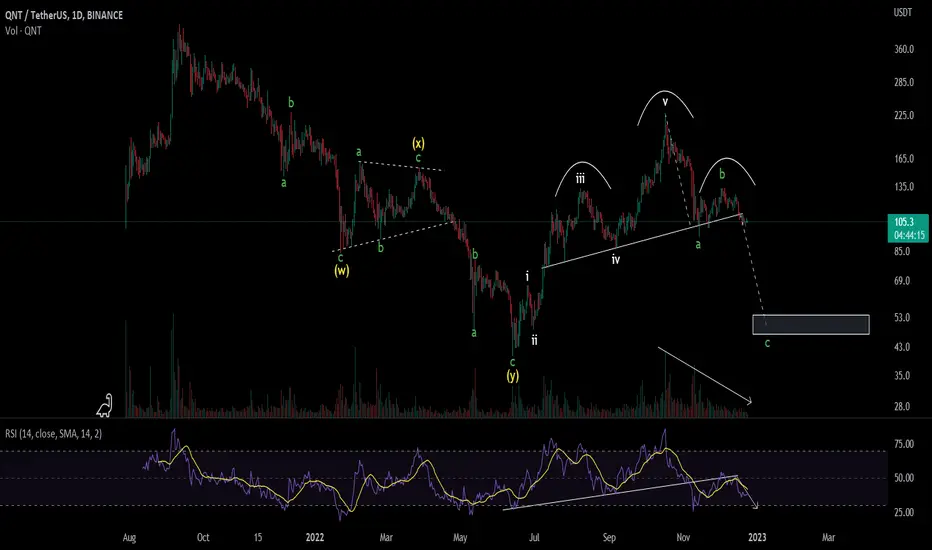
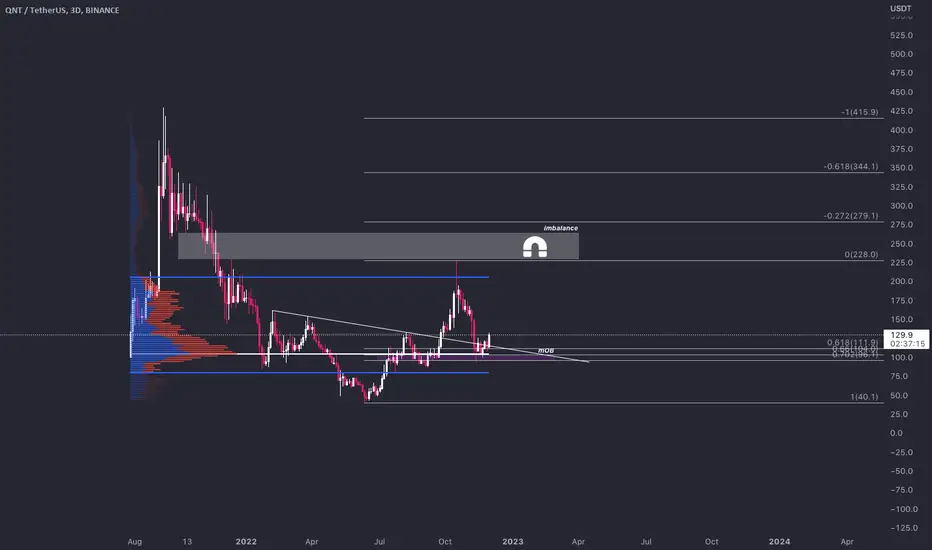
Quant #qnt short termQuant could fall to $90 in the short term but by mid 2023 we could see price break about $280

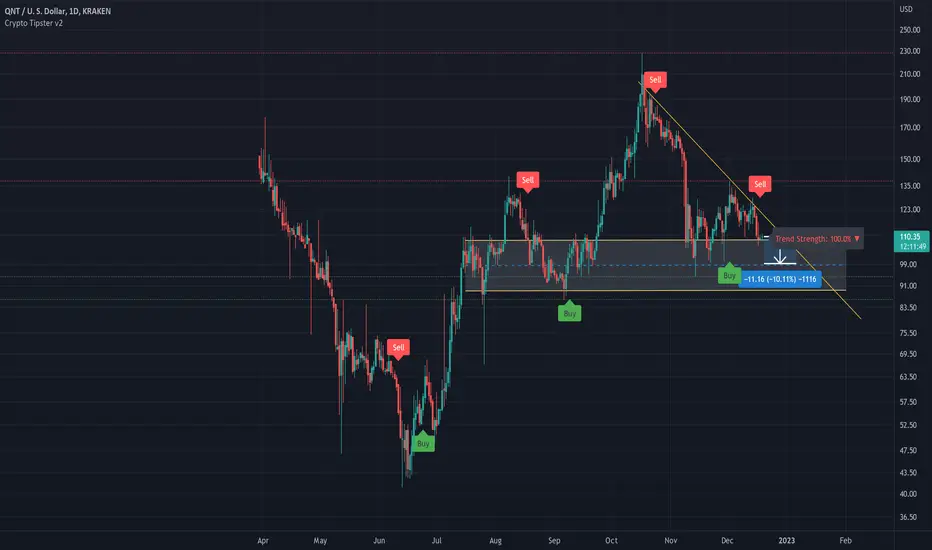
$QNT to 109$ USD?I have found a Rising Wedge in the QNT/USDT
Wait for the break of the Rising wedge to enter short
TARGETS:
1️⃣118.3🎯
2️⃣113.8🎯
3️⃣109.2🎯
4️⃣102.7🎯
QNT (Y22.P4.Video1).Fractal and macro overviewHi Traders,
#QUANT #Crypto
We found a fractal that can give reason to why we should be shorting from here.
All the best,
S.SAri

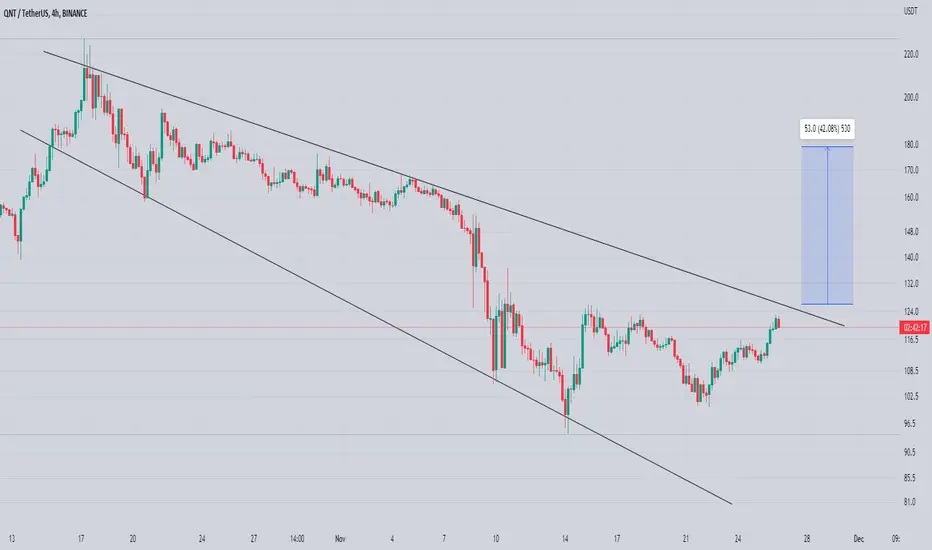
Quant might be a good shortQuant might be a good short if it breaks the trend line. BTC still has a few days before any possible good news. We might see most alts including QNT to get deep into the liquidity zone before moving back again.
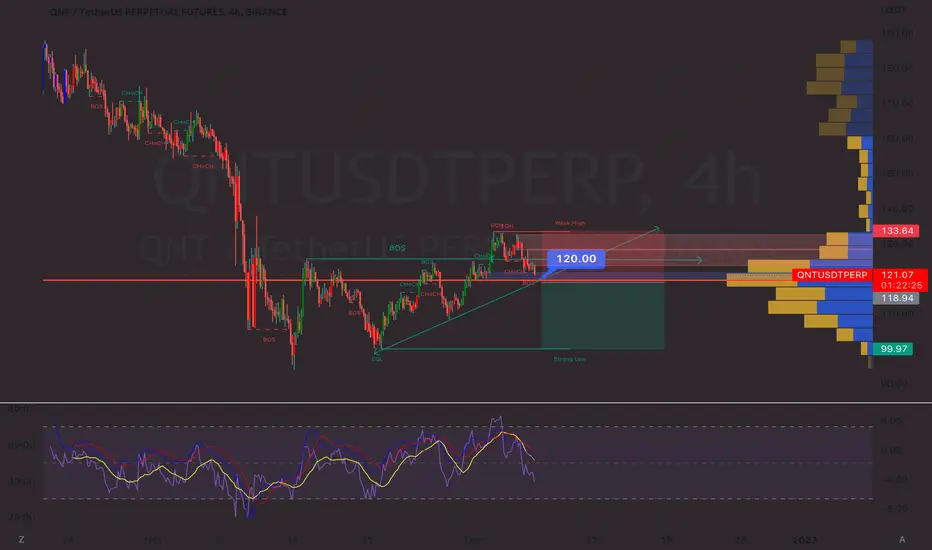
IS THIS THE LOCAL BOTTOMS FOR QNT?1. This area looks like a nice long "KEY" must hold
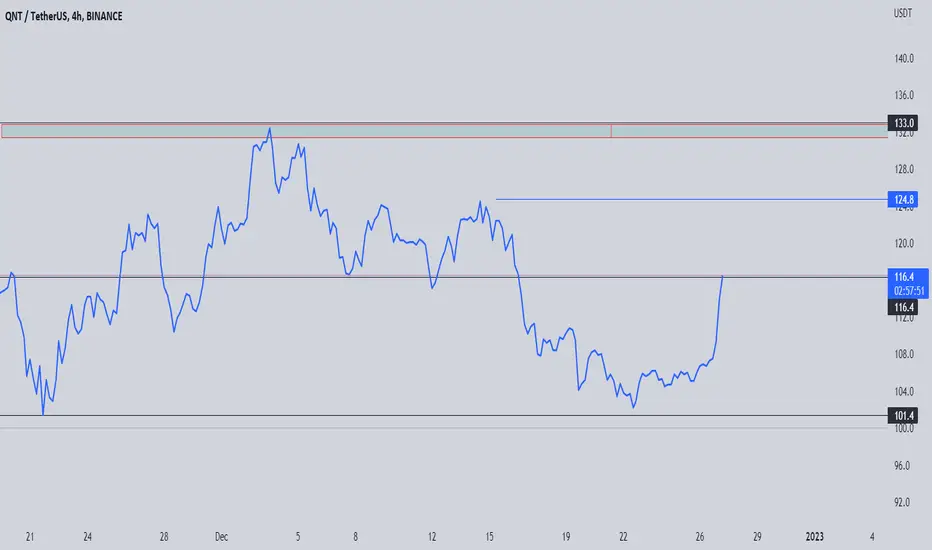
2. I dont like the recent high, its likely that will get taken out and push up to local resistance at $148
QNT : NEW VOLUME VIEW BREAKOUT POSSIBLITYQNT is the symbol for Quant Network, a company that provides blockchain technology solutions. It is a cryptocurrency for security and is traded on online exchanges.
As with any investment, it is important to thoroughly research and carefully consider the risks before investing in QNT or any other cryptocurrency. It is also important to manage risk by diversifying your investment portfolio and not putting all your money into one asset. It is impossible to predict with certainty the future performance of any investment just by expecting, so it is important to always approach trading with caution and to never invest more than you can afford to lose.
The scan was made today on this coin and it shows possible high volume can get confirmed.
We will follow it and see if it can go over 160 USD coming time.
QNT is one of the high coins that have + volume on-trend.
There is no guarantee that this expecting will happen, as we depend on studying and depending on high chances.
*the possibility is high.
This coin did hold before more levels, which makes it also interesting.

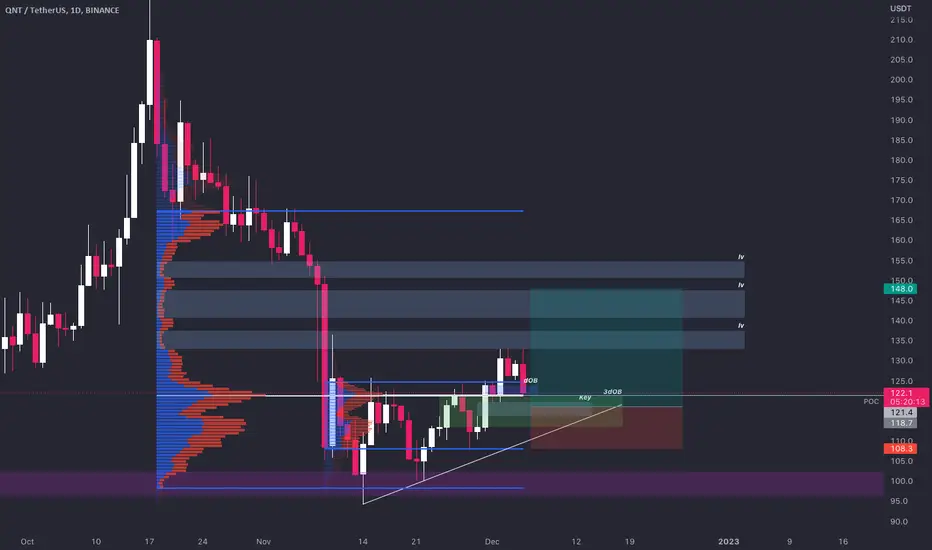
QNT QUANT BULLI like the look of $QNT chart
Bounce from:
1. Monthly order block
2. Big volume point of control
3. 60/70% fib
Targets to reclaim
1. $148
2. $166
3. $230
4. $344
QNTUSDTForming descending broadening wedge in h4 tf
incase of breakout expecting 40 to 45% bulish wave
QNT Update 2 December 2022QNT Update 2 December 2022 - Quant (QNT) is an Ethereum token that is used to power Quant Network's Overledger brand of enterprise software solutions, which aim to connect public blockchains and private networks. Overledger was designed to act as a gateway for any blockchain-based project to access all other blockchains.
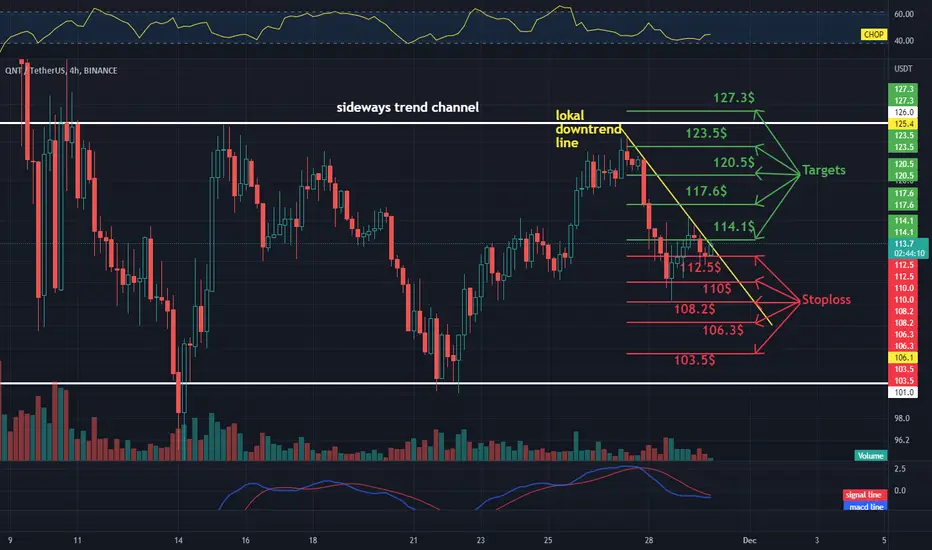
QNTUSDT 4H Interval Targets and StoplossHello everyone, let's take a look at the 4H QNT to USDT chart as you can see that the price is moving in a sideways trend channel and locally trying to break out of the down trend line upwards.
Let's start by setting goals for the near future that we can take into account:
T1 = $114.1
T2 = $117.6
T3 = $120.5
T4 = $123.5
and
T5 = $127.3
Now let's move on to the stop loss in case the market goes down further:
SL1 = $112.5
SL2 = $110
SL3 = $108.2
SL4 = $106.3
and
SL5 = $103.5
Looking at the CHOP indicator, we see that most of the energy has been used on the 4H interval, while the MACD indicator indicates a local downtrend.
Bullish double bottomI don't know exactly what to expect with crypto market dumping, but QNT never ceases to look super bullish.
Probably PA will do some sideways movement, maybe some other confirmations of the pattern and then up...
The pattern is printed in the chart with a confirmation coming with it so it's justifiable to expect the pattern to hold from now on.

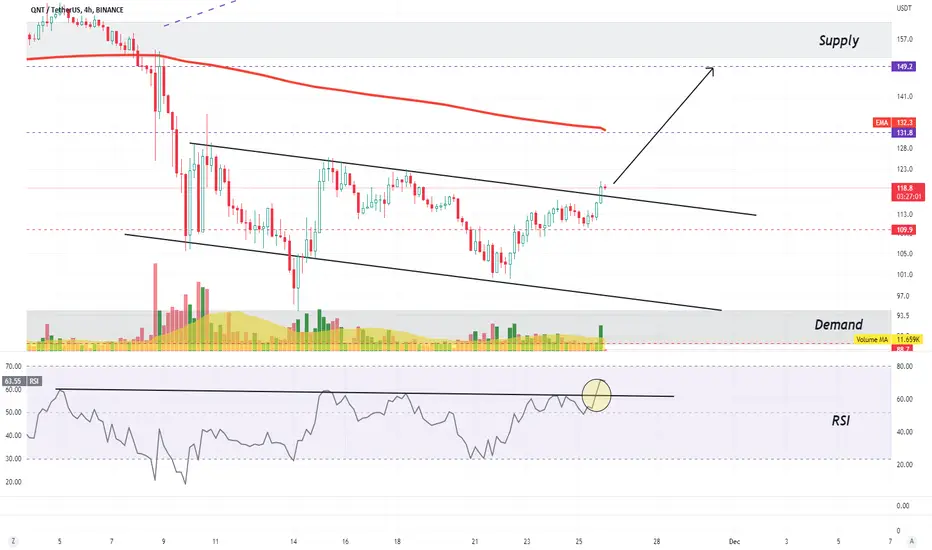
QNT break-out
QNT has been risen quite fast since touching the demand area on 14th November. It's just broken the descending channel with a good volumed candlestick (in 4H TF).
RSI had also broken the trendline.
On-chain indicators (on Glassnode) have shown the number of new buyers increased quite fast to catch the dip (on 14th November). The total adresses jump 12% since then.
In my opinion, QNT prices would revisit the supply area. Before reaching this level, a big resistance is the EMA 50D.
QNT idea 24 Nov 2022QNT may be moving up soon, worst case would be a fall down to $88 in the short term