SPY/QQQ Plan Your Trade for 5-9 : Inside-Breakaway PatternI will be unavailable tomorrow morning to do my normal Plan Your Trade video at 5am. So, I'm delivering this video for all of you tonight to assist you with the SPY cycle pattern tomorrow.
As soon as I get my brother settled in for his surgery, I'll find a Starbucks and settle in to check on the markets.
This is a short video - so please understand the context of the markets may depend on what happens overnight.
Get some.
#trading #research #investing #tradingalgos #tradingsignals #cycles #fibonacci #elliotwave #modelingsystems #stocks #bitcoin #btcusd #cryptos #spy #gold #nq #investing #trading #spytrading #spymarket #tradingmarket #stockmarket #silver
QQQ

$SPY Its time according to my chart.. Lower high is the trigger I posted two charts for reference to the current situation. With a historic rally right into resistance and a fractal analog that matches, I have no choice but to remain bearish. These are my studies. Sometimes Impatience leads to things like Impulsive Entries and Exits, Revenge Trading, and at times, even Blown Accounts. Times like those should be followed by a regroup and a reset.
The 9 Count Sell Signal Triggered with a Reset is on Technical Inidators for a move lower. I do believe we are going to consolidate for several days but nothing further than the second week of May. Today Bulls got extremely bullish and still were not able to hold the highs into the close. The test of the 200 day SMA was rejected and several days near these leveles whether above or below, would prove the downside move more possible. The monthly on SPX is my biggest indicator, personally. If it follows the pattern I'm following then after a test of the 10WMA, we will roll back over on the next 10 day candle. The market ran through a death cross without stopping, which if anyone were to study for several minutes, they would be able to see any first attempt at a death cross to the upsde is almost immediately met with a selloff back to the lows of the breakout move. Good luck everybody.
SPY/QQQ Plan Your Trade Update : Finding Confirmation & MoreThis video will become the start of more advanced training videos to help all of you understand how to use your own skills/tools/resources to try to find the best opportunities.
As I state in the video, I will never tell you what to trade. EVER!
It is unethical and illegal. I'm not a broker or financial advisor.
I'm a software developer/trader and I like to try to unlock the secrets of the markets using price action and inference models (and more).
This video teaches you how to use my CRASH INDEX and the SuperTrend indicator as a way to develop better allocation and risk protection skills for your own trading.
Let's face it - trading is about developing a process to consistently GET PROFITS. It doesn't really matter if they are 10%, 20%, 30% or more. If you are able to consistently execute good trades and PULL PROFITS - you will grow your account- right?
So stop swinging for the fences. Learn to develop skills that keep you on the right side of these big trends.
It's not that hard.
In this video I try to teach you to use Daily, Weekly, 240 min, 120 min, 60 min, 10 min, and 5 min data using my Crash Index to help you learn to trade the SPY/QQQ.
The Crash Index is suited for the SPY/QQQ in most cases. There are instances where the Crash Index may reflect some type of counter-trend - so remember to use Fibonacci Price Theory on the underlying symbol (SPY or QQQ) as final confirmation.
And, remember to try to understand primary trending (longer-term trending) vs. short-term trending. If you are going to try to trade a "counter-trend" swing - cut your trade allocation down by 50-60% (or more). Counter-trend swings are usually going against the major/primary trend.
Anyway, watch this video once or twice. I hope it helps all of you understand and build your own skills to trade more efficiently.
The trick is to get it down to a process where you know how to allocate your capital and you know how to confirm/invalidate trade setups/triggers.
Once you get to that point - you turn into a trading machine. The only step of the process that is really difficult to handle/manage is the BOOK IT phase. If you book your profits early - you may feel bad about leaving profits out there you could have had. But, a PROFIT is a PROFIT.
And the goal of trading it to PROFIT more than you LOSE - right?
Get some.
#trading #research #investing #tradingalgos #tradingsignals #cycles #fibonacci #elliotwave #modelingsystems #stocks #bitcoin #btcusd #cryptos #spy #gold #nq #investing #trading #spytrading #spymarket #tradingmarket #stockmarket #silver

Beyond The Plan Your Trade Videos - Trading Algos/ConfirmationMany of you follow my morning Plan Your Trade videos - and I thank you for your loyalty and dedication.
The Plan Your Trade videos are specifically deigned to highlight my SPY/GOLD Cycle Patterns and, over the course of the past 9+ months, I've started trying to teach all of you Fibonacci Price Theory and the concept of the Excess Phase Peak pattern (and Cradle Pattern).
My goal is to teach you to learn to understand price structures, setups, and actions as a way to try to advance your technical analysis/trading skills.
There are so many others out there trying to teach you to use indicators and other types of analysis to try to identify trading opportunities/setups. Some work, some don't.
Technical analysis using Indicators, Elliot Wave, or other forms of predictive analysis/AI are only about 50-75% accurate at best (IMO). Nothing is 100% perfect.
After 35+ years of trying to unlock the secrets of price action to devise a 100% accurate trading system, the closest I have come is a system that generates about 65-75% accuracy - but still manages to take some losses.
I do believe I can find that 100% accurate system (hopefully before I die). But the reality is it is almost impossible to accurately predict price movement 10-20+ days in advance with any degree of accuracy.
Over the past few weeks/months, we've seen the SPY/QQQ move through various stages/phases.
Over the past 4+ weeks I've been warning of the broad-consolidation phase that is currently setup on the SPY/QQQ. I believe this huge consolidation range is very dangerous for traders and that extreme volatility will create lots of risk/opportunities for those capable of trading within this range.
But, at the same time, failing to take advantage of tools to help traders hedge, daytrade, or otherwise balance allocation/risk levels is something I really don't talk about much.
I like to say "I do the research - you make all the trading decisions".
This video highlights some of my advanced algos and how I use them, in conjunction with the EPP and other patterns, to try to gauge market opportunities vs. risks.
Trust me. I've learned not to GO BIG on trades over the past 20+ years because I've blown up a few accounts trying to get greedy.
Right now, I focus on trying to be on the right side of trends (if possible) and to balance my portfolio in 10-20% increments.
For example, if I believe GOLD is going to move higher, I may start out with a 5-10% allocation into GLD or UGL (start small). If that trade works and Gold starts to make a move higher, I may try to add a bit more to that initial trade. If it doesn't work out, I may try to add a little bit more at a better entry price level - but I focus on not letting that trade occupy more than 15-20% of my total portfolio.
That way, if I take a loss on the trade, it is a small loss compared to the overall account capital.
If I take a 50% loss on a 20% allocation - that is only a 10% loss on the TOTAL ACCOUNT SIZE.
Get it?
So, the reason for this video is to show you how you can still use technical strategies/indicators to try to confirm you intraday trading and swing trading opportunities. I like to use the SuperTrend strategy on charts to identify general trending.
I'm urging you to consider my Plan Your Trade videos as "one component" of your skillset. You need to use your own skills/techniques/analysis to try to manage risks vs. opportunities as you continue to trade.
I highlight some of my algos because they become another "component" of my analysis when I'm trading. If I don't see broad market capitulation related to Daily trending - then I try to stay VERY CAUTIOUS. If I do see some capitulation within my algos suggesting the markets are starting to trend upward or downward, then I may try to take advantage of that opportunity.
Ideally, the process of trading is to use everything you like and can rely on to help confirm you decision-making. Then, fall back to a efficient trade allocation process that attempts to limit your risk level.
The biggest mistake I see people make is to go ALL IN or TOO HEAVY into a trade thinking they can't lose. Yes, you can lose. So can I.
That's why it is important to contain risks and protect capital at all times.
I'll try to create another video showing you how I use the SuperTrend indicator to help confirm some of my intraday analysis for trades.
Get Some.
#trading #research #investing #tradingalgos #tradingsignals #cycles #fibonacci #elliotwave #modelingsystems #stocks #bitcoin #btcusd #cryptos #spy #gold #nq #investing #trading #spytrading #spymarket #tradingmarket #stockmarket #silver

SPY/QQQ Plan Your Trade For 5-8 : EPP & Cradle Pattern UpdateThis video highlights why I continue to stay very cautious of this upward price move in the US markets.
It also highlights that the current trend is BULLISH - not BEARISH. When I post the videos in the morning, I've been selecting BEARISH as the general trend because I believe the markets are going to roll over into a breakdown phase. Until that happens, though, the markets are in a BULLISH price trend - attempting to possibly break above the current Ultimate High.
This is more of an instructional video - trying to show you why I continue to urge caution related to trends and why I belive we may have many months to go before the US markets really start to make a bigger "exit trend" type of move (exiting this broad consolidation range).
The other thing this video should teach you is how to identify EPP and Cradle patterns more efficiently and how to use them.
Ultimately, everything I share with all of you is designed to help you understand price as the ultimate indicator.
If you can grasp these concepts and understand how each phase of price structure presents opportunities, then you should be able to time and execute your trades very efficiently.
As I've stated in the videos, because of family medical issues over the past 60+ days, I've moved away from daytrading and gone back to a 2-5+ week swing trading style.
Simply put, I'm driving all over the place taking care of my family, seeing doctors, and other stuff - so I can't stare at my PC/Phone while the markets are open.
I'm also taking very low risk trades. If I decide to get into a trade, I'm usually avoiding the SPY/QQQ and selecting some SPDR sector (or other ETF) that allows me to play the move I expect without risking a fortune doing it.
Anyway, I hope you enjoy this video. I'll probably create one more after this video posts.
Get some.
#trading #research #investing #tradingalgos #tradingsignals #cycles #fibonacci #elliotwave #modelingsystems #stocks #bitcoin #btcusd #cryptos #spy #gold #nq #investing #trading #spytrading #spymarket #tradingmarket #stockmarket #silver

$SPY / $QQQ – Bull Flag Breakout in Progress?📈 Both AMEX:SPY and NASDAQ:QQQ just broke out of bull flag patterns after a strong recovery from the April lows.
🔍 Technical setup:
Flags formed after a vertical rally ✅
Breakout candles with follow-through ✅
Still riding key EMAs (20/50) with decent volume ✅
📌 Targets based on flagpole projection:
AMEX:SPY → ~582–590
NASDAQ:QQQ → ~505–510
However… mind the context:
We’re heading into macro risk events, and positioning is getting crowded.
These breakouts need confirmation via volume + higher high closes.
SPY/QQQ Plan Your Trade For 5-8 : Carryover PatternToday's Pattern is a Carryover pattern in Carryover mode.
After yesterday's FOMC news (unchanged), the markets are seeking a bit of direction. Bitcoin rallied and INVALIDATED a EPP Flagging pattern. In my opinion this suggests the SPY/QQQ may attempt to move a bit higher after the Fed decision.
Although, I still believe the global markets are reacting to uncertainty and tariff news within a very broad consolidation range. So, I'm cautious of trying to go ALL-IN on any long trades at the moment.
Until we break clear of the consolidation range, price could break strongly to the downside on news or geopolitical content. In reality, any type of big news could prompt a downward price move within an uptrend or a consolidation range.
It just seems as though the current global market environment is fraught with uncertainty - so I continue to stay cautious.
Gold and Silver pulled downward overnight. But I still believe metals will continue to rally - attempting to hedge against global risks.
With Bitcoin rallying a bit higher (still in consolidation) - let's see how the next few days play out.
I would be surprised if BTCUSD and the SPY rallied to new highs before the end of May. VERY SURPRISED given the status of the global markets.
But, the markets can stay completely irrational much longer than I can try to fight them. So we have to move WITH the markets - not against them.
Get some.
#trading #research #investing #tradingalgos #tradingsignals #cycles #fibonacci #elliotwave #modelingsystems #stocks #bitcoin #btcusd #cryptos #spy #gold #nq #investing #trading #spytrading #spymarket #tradingmarket #stockmarket #silver

SPY/QQQ Plan Your Trade For 5-7 : Post FOMC UpdateThis video highlights a number of factors why I believe the markets are stalling and are likely to REVERT back to the 515-525 area on the SPY.
Without any real economic driving component, while tariffs and other concerns continue to play out, I believe the SPY will continue to search for Ultimate Support over the next 5-7+ months, then move into an upward reversion phase.
Part of what I'm trying to teach my followers is to try to understand how price operates in structures and phases.
Price only does two things: TRENDS or FLAGS
Within those phases, price structures (EPP, Cradle, and others) take over to determine how and why price may or may not attempt to make certain price moves.
Additionally, without any bias, or economic impetus (driver), price tends to REVERT.
In this video, I show you how to use the STDDEV channels to identify possible target areas for the different phases of market trend.
Ultimately, IMO, trading is about being able to see the price structure, phases, and path of least resistance (in terms of bias/expectations). This helps us position for the highest probability outcome (and hopefully for successful trades).
Remember, all of these techniques can be applied to intra-day charts the same way I'm applying them to Daily and Weekly charts.
Remember, price only does two things: TREND or FLAG.
Once you understand that, applying price structures/phases to price while it TRENDS or FLAGS helps you to gain a keen understanding of where price may target/move in the immediate future.
Hope this helps.
Get Some.
#trading #research #investing #tradingalgos #tradingsignals #cycles #fibonacci #elliotwave #modelingsystems #stocks #bitcoin #btcusd #cryptos #spy #gold #nq #investing #trading #spytrading #spymarket #tradingmarket #stockmarket #silver

QQQ Don't Get Honey Dicked!These moves are designed to provoke emotions. Don't get fooled! Nothing has changed! Tariffs are not the problem; they are only a symptom of it.
Click BOOST, Follow, Subscribe!
Let me help you navigate these crazy markets.

FED DAY IS HERE! $qqq at MAJOR resistance. Today will be a tellQQQ is stuck under the 200sma and a supply zone. WE have used up a lot of the tarriff deals news flow. The market will be looking to uncle Jerome for direction. If he comes in dovish and says the inflation is tempered we could push through into the suction zone.
If he comes in hot and says the tariff war heating up inflation we could get a big pause on the rally. with the QQQ under so much supply this is a logical spot for Powell to dump on the market.
We have the 9ema under if we break under it will trigger a short for me. if we stay above its a leave alone unless we remount the 200sma on the daily chart.
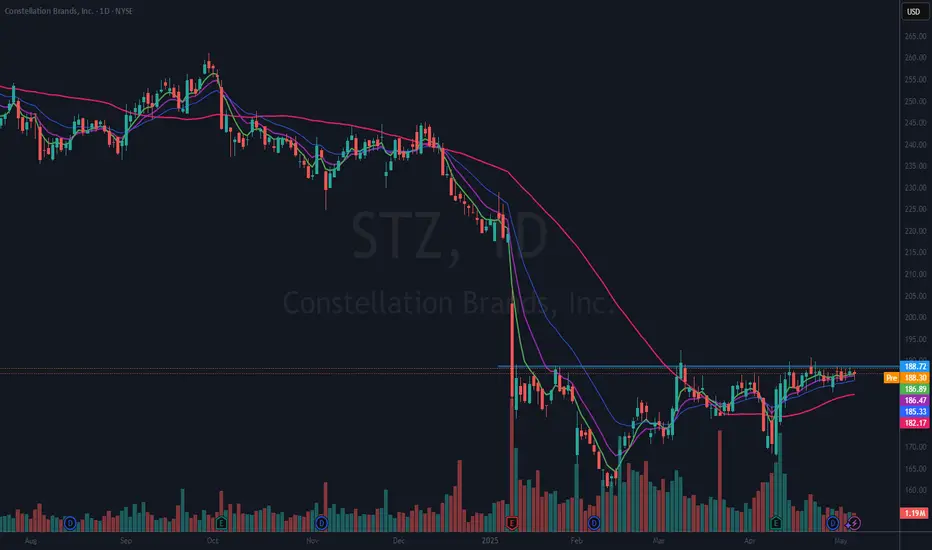
$STZ Get Upgrade and $125 Price TargetNYSE:STZ Has been in a stage one base for about 4 months and is above all the Moving Averages with the fastest on top and slowest on bottom. With the new upgrade can it breakout into a stage 2 uptrend?
I have an alert set at just 188.50, right in the resistance area. I will take the trade if it triggers with a stop just below the most recent low of 182.62. That makes a well-defined risk reward for me.
On the fundamental side, we are moving into summer and beverage sales could easily pick up.
SPY/QQQ Plan Your Trade Video For 5-7 : Breakaway In CounterToday's Breakaway In Counter Trend mode suggests the markets will likely attempt to break downward before the end of trading, today. Why do I state the downward trend direction?
Because the LT/ST trends are BULLISH and the general upward price trend in the SPY over the past 5-10+ days.
Counter-trend patterns are typically inverted compared to the general 5-8 day price trend. If we can't clearly identify a 5-8 day price trend, then the counter-trend patterns should be determined based on the ST/LT and BIAS trend information on the SPY Cycle Patterns data window.
Today, being a FOMC comment day, should stay rather muted/sideways in early trading. Normally, on FOMC days, the markets tend to stay paused ahead of the FOMC comments.
I believe the FED will not raise or lower rates - meaning NO CHANGE. I don't believe the US Fed has any reason to be concerned with US economic performance right now.
Gold and Silver should move into a rally phase today - but that will likely come near the end of the day as the FED comments drive the markets.
BTCUSD has moved into an early FLAGGING formation. This could be very interesting as BTCUSD has been leading the SPY/QQQ by about 4-6 trading days over the past few weeks.
If BTCUSD continues to lead the SPY/QQQ - that means the SPY/QQQ would be in the early breakdown phase right now - moving into a FLAGGING formation possibly next week.
Get some.
#trading #research #investing #tradingalgos #tradingsignals #cycles #fibonacci #elliotwave #modelingsystems #stocks #bitcoin #btcusd #cryptos #spy #gold #nq #investing #trading #spytrading #spymarket #tradingmarket #stockmarket #silver

$DJI & $NDX at MAJOR RESISTANCEDaily
The TVC:DJI has done well since April & we noticed a sentiment change. This is why we turned bullish. Only problem? Lack of volume. We can see that volume stayed under the pink dots. This is an average of 90 days.
We can also see this by the Money Flow. As of now the lowest peak since mid March on this indicator.
---
Weekly
The TVC:DJI RSI hasn't broken the halfway point. This is needed for more bullish momentum.
Money flow is slanting lower. The interesting tid bit is that volume for the week is not bad at all. But compare this to Jan 2024 and 4th quarter of the same year... LOWER.
Posted this yesterday, see profile for more info.

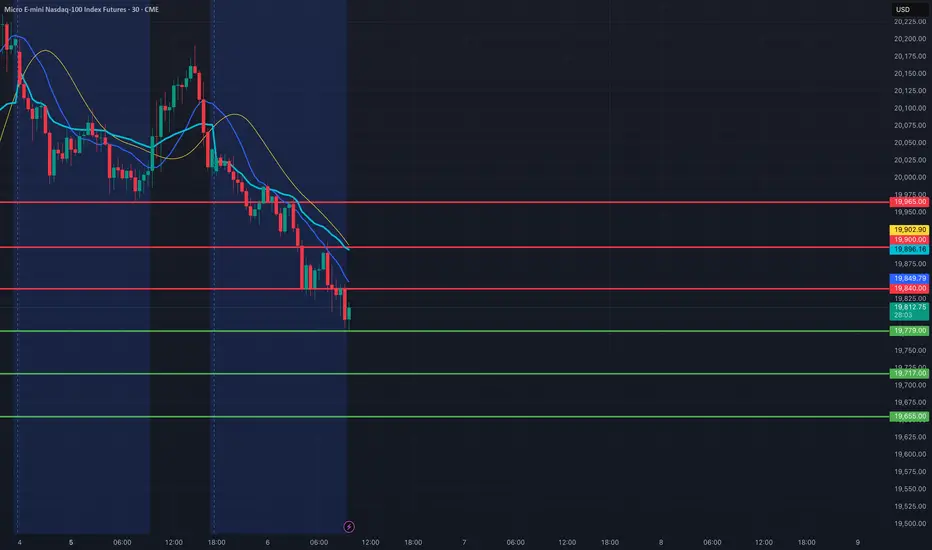
MNQ1!/NQ1! Day Trade Plan for 05/06/2025MNQ1!/NQ1! Day Trade Plan for 05/06/2025
📈 19840 19900 19965
📉 19779 19717 19655
Thanks to all my followers! Truly appreciate the support!
Please like and share for more ES/NQ levels Tues & Thurs 🤓📈📉🎯💰
*These levels are derived from comprehensive backtesting and research and a quantitative system demonstrating high accuracy. This statistical foundation suggests that price movements are likely to exceed initial estimates.*
TSLA Eiffel Tower Not CompleteEiffel tower patterns are rare but very powerful TA structures when they develop.
They are very hard patterns to short since we can never know when the wave up ends. However, there is so much information we can extract from them during and after the collapse.
When they are rising and going vertical, and you happen to be in it. The benefits will be great! As the price action sucks in everyone all at once with virtually no sellers.
So, what info can we learn?
On the way up, when this is happening, you should have the ability to recognize it at some point without worrying if you got the top. Take your money and RUN!
Never try to get back in and try to chase it up!
Never try to short it, thinking it is too high, this is the top!
When it tops out, never buy the dip! Bc you know how this structure will end.
Never buy based on some silly FIB or bc it's down too much!
Never buy the base thinking it will go back to new all-time highs, and it is now safe to get back in bc it will only keep going lower, more through time, frustrating you until you puke it up.
So remember this gimmicky sound bite.
"If they don't scare you out, they will wear you out!"
Ain't nobody got time for that! Your money has a much better place to be allocated to make you money instead of being fixated on a chart like this.
The reason people get stuck is bc the move provoked emotion! Then, when they get involved thinking they will be Buffett tomorrow from this one trade, they will experience Euphoria, sadness, anger etc., further provoking even more emotions to the point they become obsessed! Guessing, waiting, hoping, doubling down on and on...
Ask me how I know! hahaha!
While I made a lot of money shorting GME, here is an example of an Eiffel tower with many, many people that have this trading disease I just spoke about.
In conclusion, anyone who believes that TSLA will hit $1,000 blah blah blah and suckered into buying it. You now know you are being honey dicked by a bunch of armatures and bots on X. Beyond TSLA there are many such charts out there tight now that have formed the beginnings of ET. As such, you should know how to recognize it quickly and avoid the pitfalls out there.FYI I called the Top on TSLA ))
Click Like, Follow, Subscribe to learn much more about real macroeconomics and technical analysis. Let me help you navigate these crazy markets.

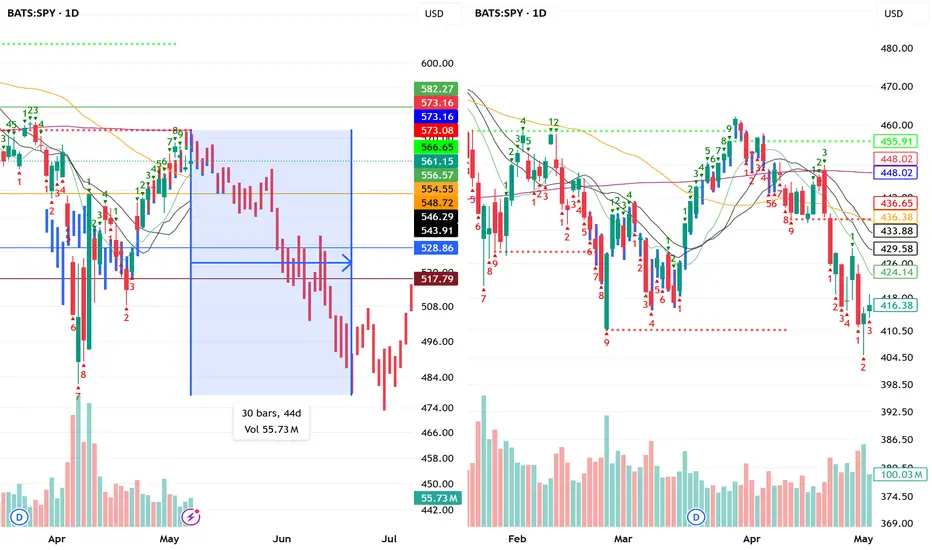
SPY/QQQ Plan Your Trade For 5-6 : GAP Breakaway patternToday's pattern suggests a morning GAP will take place and price will continue to break away from yesterday's body range.
Given the fact that the markets are already almost 0.8-0.9% lower than yesterday's closing price level, this suggests the markets will continue to trend downward today.
Is this it? Is this the breakdown for May 2-5, seeking the Major Bottom I've talked about for the past 3+ weeks?
We'll find out over the next 5-10+ days.
Ultimately, the EPP patterns have aligned across multiple instruments/symbols to present a very clear opportunity to the downside. Now, we need to watch and wait as the markets should be moving into the early FLAGGING stage of the downward EPP pattern.
After the FLAGGING pattern, we should get the breakdown into consolidation, which is where I believe big profits can be made. That breakdown into the consolidation phase is usually very aggressive and can often be after the FLAGGING range.
Gold and Silver are making a move higher. I suggested this would be the case over the past 5-10+ days - but, boy, was it frustrating to watch Gold and Silver consolidate over the past few weeks.
At this point, I'm looking for Gold to rally above $3500 and for Silver to attempt to rally above $34.00.
Bitcoin seems to be leading the SPY/QQQ (again) and appears to be about 2-3 days ahead of the major US indexes, attempting to move into a downward FLAGGING formation.
This could be very interesting if BTCUSD continues to lead the SPY/QQQ. Meaning, we may be able to rely on the structures/setups in BTCUSD as a 2-3 day early window of that the SPY/QQQ may be doing (for a while). I'm sure it won't continue to align at some point in the future.
Again, I'm getting great comments from followers and subscribers. Thank you.
I'm doing my best to deliver the best research I can within these 15 to 20-min videos.
Get some.
#trading #research #investing #tradingalgos #tradingsignals #cycles #fibonacci #elliotwave #modelingsystems #stocks #bitcoin #btcusd #cryptos #spy #gold #nq #investing #trading #spytrading #spymarket #tradingmarket #stockmarket #silver

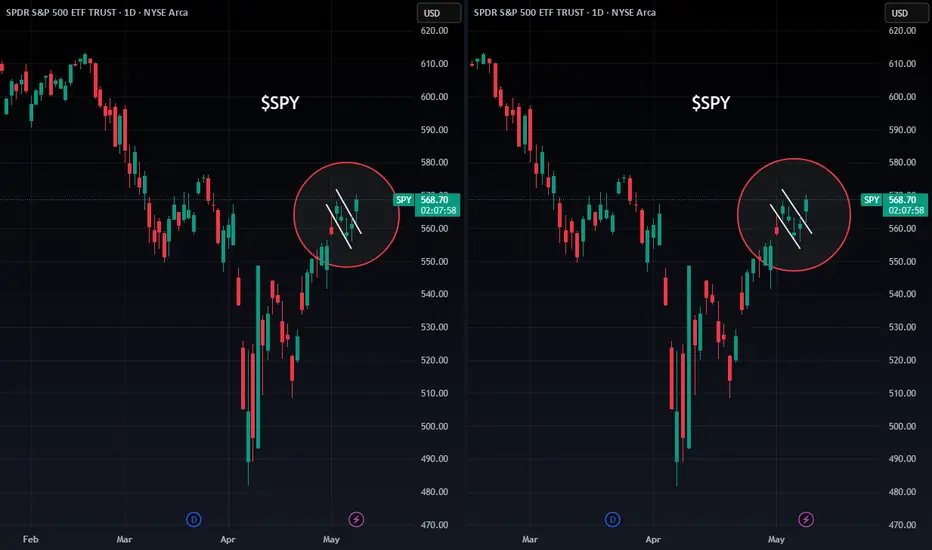
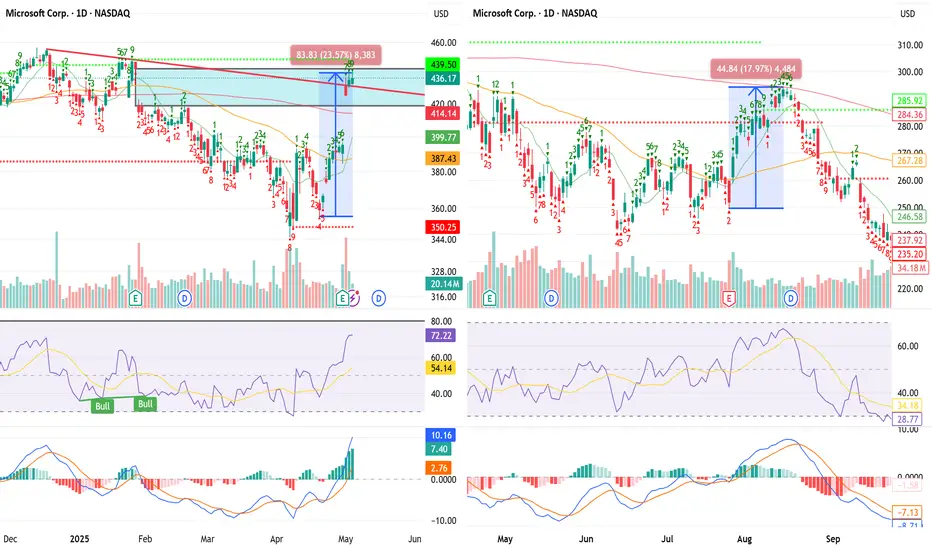
$MSFT BEST TRADE EVER? SUB $400 incoming by Mid JuneHey everybody, I hope that rally didn't kick your arses the way it did mine. You know, it's like I'm allergic to taking upside atm due to how bearish the MACRO is. Of course, with time, I'm going to assume I get most of my downside Price Targets in the next several years.
If you refer to the previous 23% Run to the 200DMA from the 50day in 2023 , NASDAQ:MSFT produced a 9 COUNT SELL SIGNAL , RALLIED for a week, and then dropped to new lows. That is what I am expecting here.
NASDAQ:MSFT looks absolutely ripe for the taking. We just rallied 17% and got the 9 COUNT SELL SIGNAL . Mind you, Gaps galore below. The Monthly and the Weekly both have Gaps . Charts do not like that, let me tell ya. I'm excited if you can't tell. NASDAQ:META and NASDAQ:AVGO look great as well. I'm still cautious about a spike out but I figure if we continue higher, i will have opportunity to grab more for cheaper as I am very confident in this move. The price moved above the DEATH CROSS and above the 200DMA . Not ever a healthy move if it moves Vertically from the 50 day and Crosses above both MA's without a stop. Mid June NASDAQ:MSFT should be at new lows.
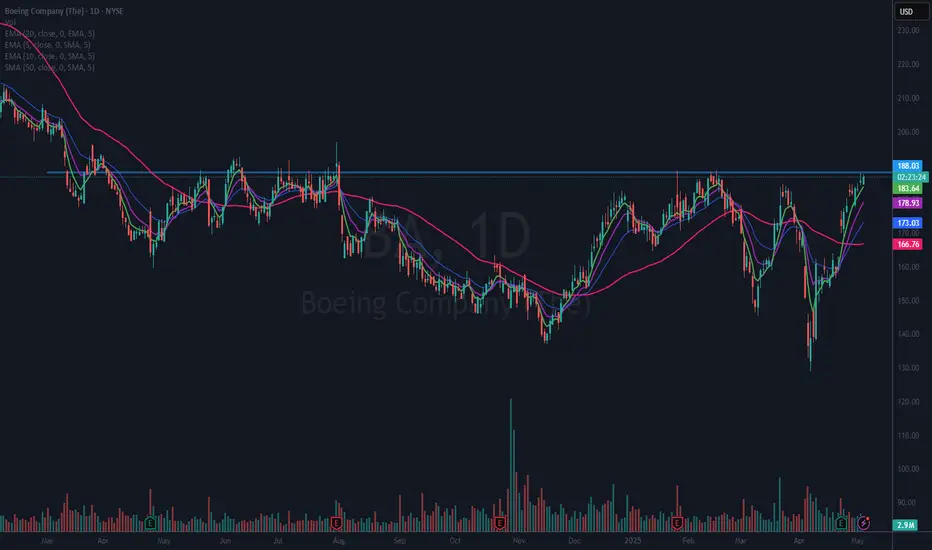
$BA Been Basing About 1 Year – Ready to Break-out?I am already long NYSE:BA since earnings report on April 23 with a full size position. I am looking for this to form a short flat base to allow the 10 (purple) and twenty ema (blue) to catch up. I will be looking to add to my position if that happens and it resumes the uptrend. Since it bottomed out on April 7th it has made about a 45% move. That is why I think my scenario may play out. All TBD.
SPY/QQQ Plan Your Trade For 5-5-25 : GAP Reversal PatternToday's pattern suggests the SPY will open with a GAP range from yesterday's candle Body and attempt to reverse the trend we saw last week.
I believe this move will resolve to the downside, as I've been warning of the May 2-5 Major Bottom for many weeks.
I believe the extended uptrend over the last few weeks was pure speculation related to Q1 US earnings. It is hard to argue that traders playing into the Q1 earnings boost didn't play the right side of the trend after watching the markets rally over the past 2+ weeks. But, I still believe the markets will consolidate and attempt to move downward over the next 10- 20+ days.
The one thing that we have to understand is Q1 was almost on auto-pilot from Biden's economy/spending until Trump threw a curveball at the global markets with tariffs.
I don't believe the US & global markets have truly priced in a global -25% to -45% economic contraction because of the ongoing tariff negotiations. It has been reported that shipping rates are down 60% in China. I believe we still need another 30-60+ days to work out the tariff issues and to allow the markets to settle into proper expectations for future economic output/growth.
Because of this, I continue to urge traders to stay cautious.
Sitting on CASH right now (only trading 20% of your total capital) is probably the smartest thing you can do at the moment.
I still expect the July and October 2025 lows to be the base/bottom of the markets, leading to a stronger upward price trend.
Right now, I've very cautious we've just seen a "dead-cat bounce" off recent lows because of Q1 earnings expectations.
Now that we've passed most of the Q1 data - we are staring at Q2 & Q3. What comes next.
I believe Gold/Silver will continue to price in extreme risk factors - resulting in a strong rally through May and into June.
I believe Bitcoin will stall and move back down to the lower consolidation range.
Let's see how things play out this week.
Get some.
#trading #research #investing #tradingalgos #tradingsignals #cycles #fibonacci #elliotwave #modelingsystems #stocks #bitcoin #btcusd #cryptos #spy #gold #nq #investing #trading #spytrading #spymarket #tradingmarket #stockmarket #silver

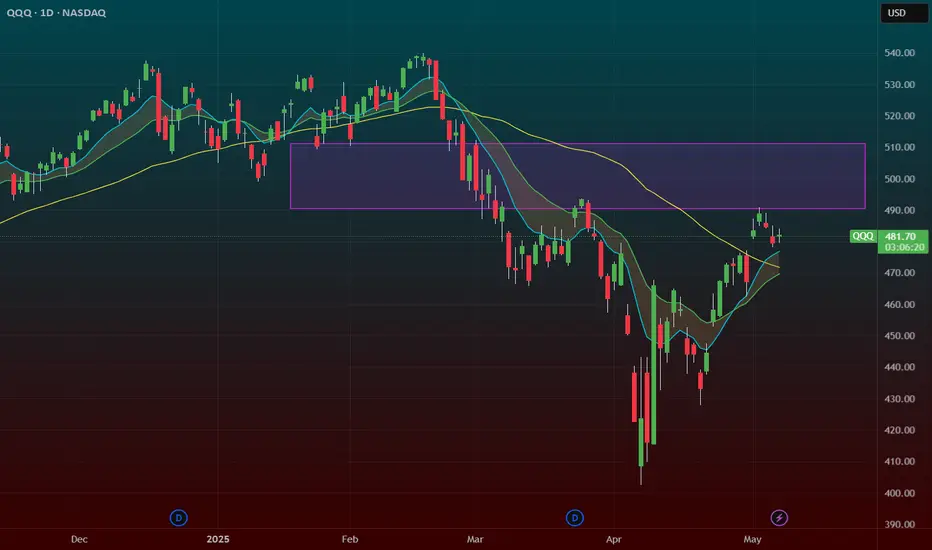
QQQ at SMA 200 resistance There might be some pullback here
I am staying bullish as long as it is above 477.58.

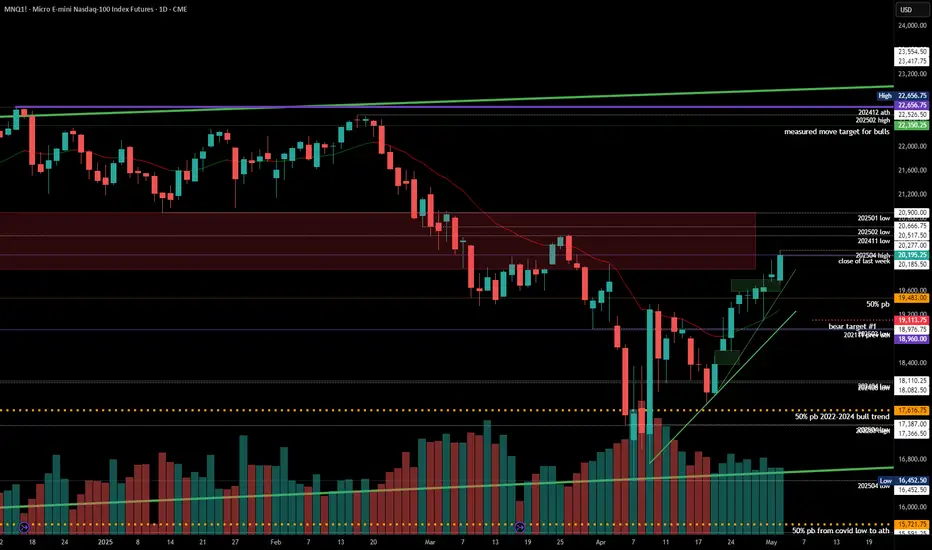
#202518 - priceactiontds - weekly update - nasdaqGood Evening and I hope you are well.
comment: Bulls want at least 20536 now and run all the stops from before the big sell-off. Bears are not doing anything at all, so bulls will likely get it. This could be a breakout-retest and I marked the area for that with the red rectangle. Small chance bears come around next week but for now it’s too early to short and buying into 9 consecutive bull days is statistically beyond moronic.
current market cycle: trading range
key levels: 15500 - 23000 (upper range is a guess, could also become 21000 but for now we don’t know so I assume the higher price)
bull case: 20536 and then 21000. Those are the next targets and bulls are in full control of the market. The measured move from the buy spike at the lows is around 22350 and it’s possible that we get there. I think we need to see a pullback and how deep that will be. If we get only another sell spike and immediate buying for higher highs, we can also assume much higher prices. Above 21100 there is no reason not to go for 23000.
Invalidation is below 19100.
bear case: Bears have nothing. Below 19100 market is neutral but until then, selling this is dumb. Wait for more bears to appear or at least seeing something that resembles a topping pattern. Like a lower high on the 1h chart. Don’t try to be the lucky bear who shorted the exact high.
Invalidation is above 21100.
short term: Neutral. No interest in buying such a buy climax but it’s way too early for shorts. Patience is key.
medium-long term - Update from 2024-04-26: My most bearish target for 2025 was 17500ish. Now I assume we will be in a trading range 16000 - 23000 for much longer.
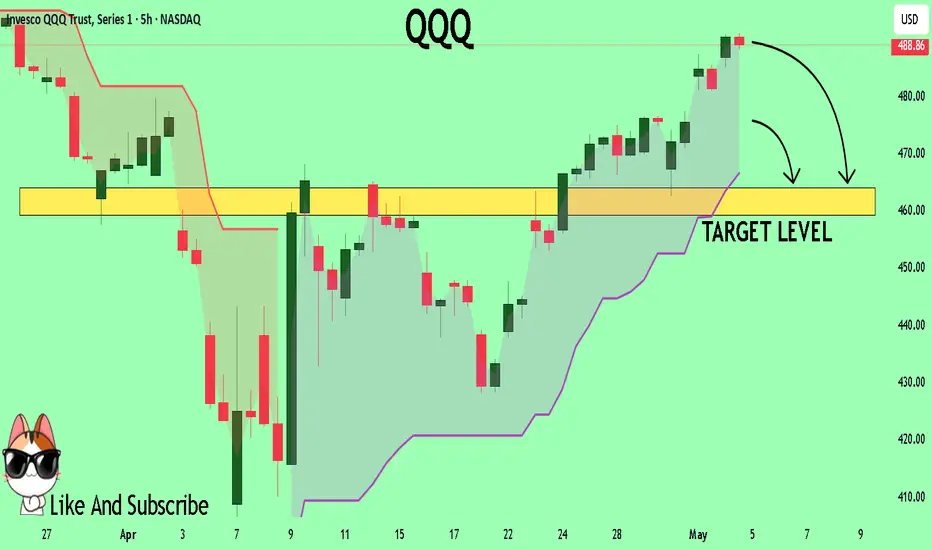
QQQ Technical Analysis! SELL!
My dear subscribers,
This is my opinion on the QQQ next move:
The instrument tests an important psychological level 488.86
Bias - Bearish
Technical Indicators: Supper Trend gives a precise Bearish signal, while Pivot Point HL predicts price changes and potential reversals in the market.
Target - 463.87
About Used Indicators:
On the subsequent day, trading above the pivot point is thought to indicate ongoing bullish sentiment, while trading below the pivot point indicates bearish sentiment.
Disclosure: I am part of Trade Nation's Influencer program and receive a monthly fee for using their TradingView charts in my analysis.
———————————
WISH YOU ALL LUCK
Stock Market Forecast | TSLA NVDA AAPL AMZN META MSFTStock Market Forecast | CME_MINI:NQ1! CME_MINI:ES1! QQQ SPY SP:SPX
Mag 7 Forecast TSLA NASDAQ:NVDA AAPL AMZN META MSFT
