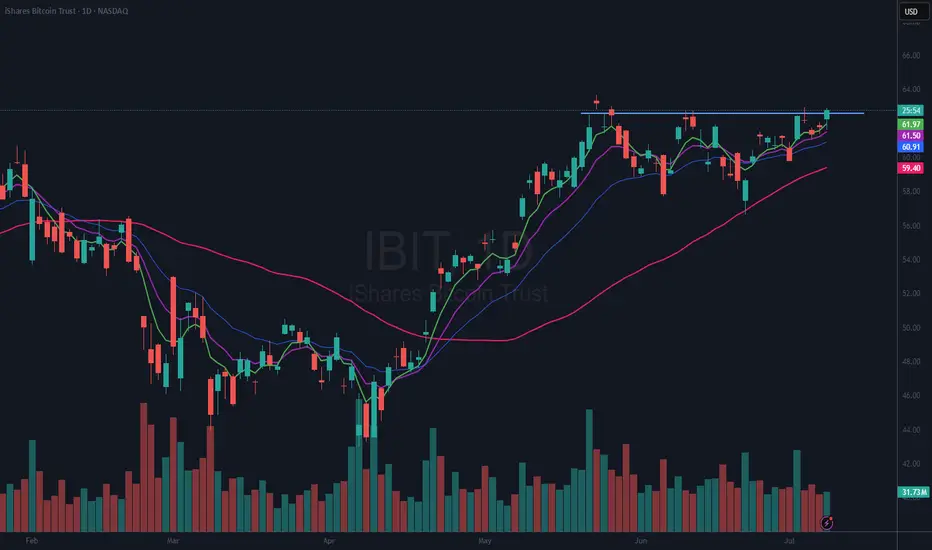
$IBIT a BITCOIN ETF Is Breaking Out of a Flat BaseNASDAQ:IBIT I have been looking at this for quite awhile now. I drew in an “area” of resistance, and it has hit that twice in the last few days. I bought a position on Jul 3rd and was stopped out. It just broke again so I have opened yet another position and will use a stop on a close below the 21 EMA (blue).
If you like this idea, please make it your own and trade it only using your own trading plan. Remember, it is YOUR money at risk.
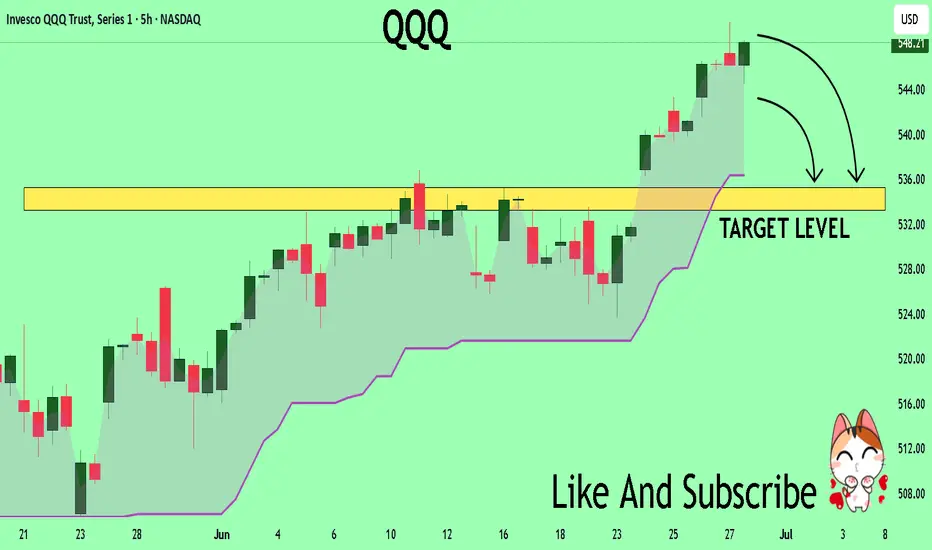
QQQ
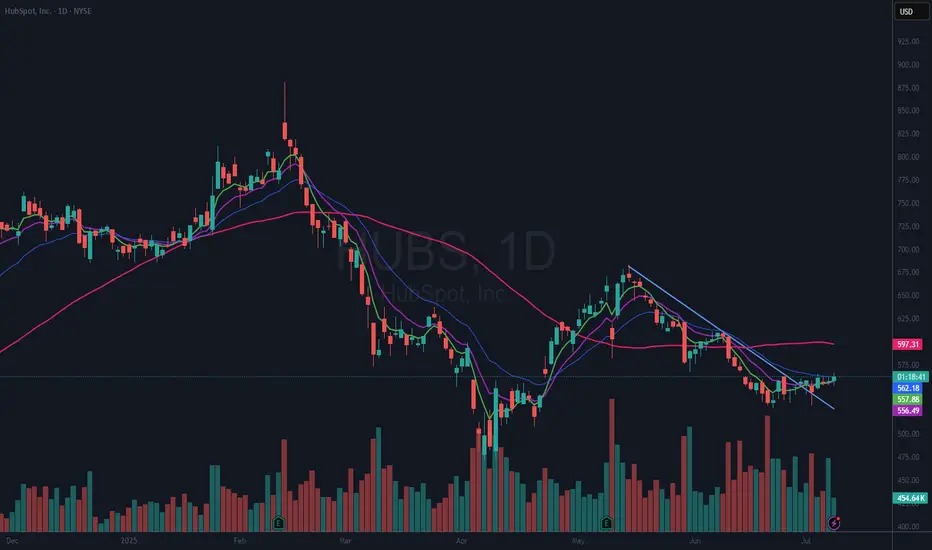
$HUBS Basing / Ready for Next Move Higher?I traded this stock last year and made good $$$. I think it may be time for it to make another run. I had set an alert to see if it would get up and over the 21 EMA. That triggered today. Based on that, I have opened a ¼ size position, not much, but enough to make me keep my eyes on it. I also have a stop just below today’s low. This is another A.I. play and it is also a bit of a dumpster dive. It seems to me to have broken its downtrend and in a Stage 1 base. It has also put in a higher low from the April 2025 lows. I do not expect this will just rocket higher and it may turn out to be dead money. But it is one you may want to keep an eye on.
If you like this idea, please make it your own and follow your trading plan. Remember, it is YOUR money at risk.
HubSpot's NYSE:HUBS new Breeze AI platform continues to turn heads, since its launch last September, just ahead of Salesforce's NYSE:CRM Agentforce.
The idea is simple enough: let Breeze handle the grunt work in your Marketing, Sales, and Service Hubs by generating leads, automating campaigns, personalizing outreach and even fielding basic support questions in real time. Sounds neat, right?
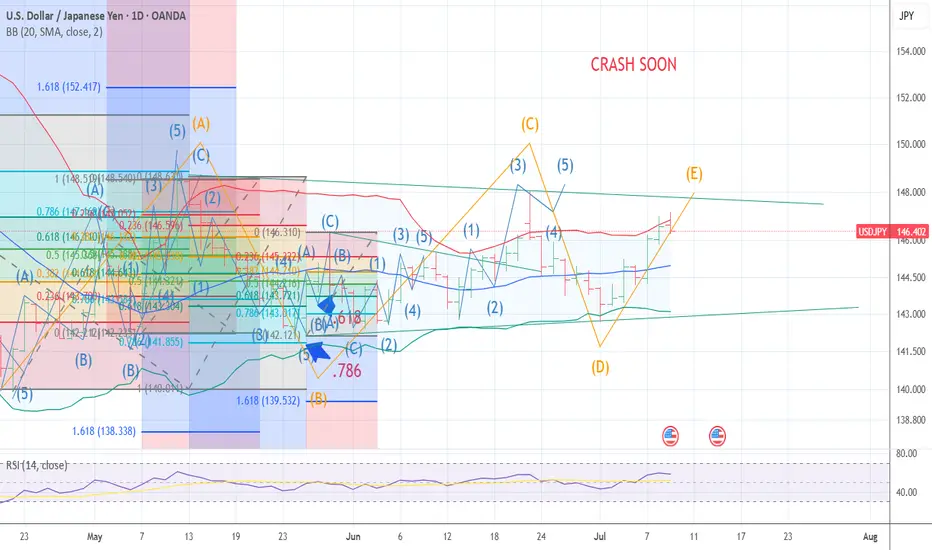
YEN CARRY TRADE TICK TICK BOOM WAVE E The chart posted is my work on the yen trade I have maintained the same labeling and as you can see What I think is rather near . I am major bearish the US stock market and I am starting to reposition for a MAJOR DOWN TURN into mid OCT the 10th best of trades WAVETIMER
TESLA PRICE ACTION 7 JULY 2025I have clearly explained the price action for Tesla. I have tried my best to explain why you should not be aggressive here.
I have also discussed the stops
NOTE:DO NOT BUY CALLS

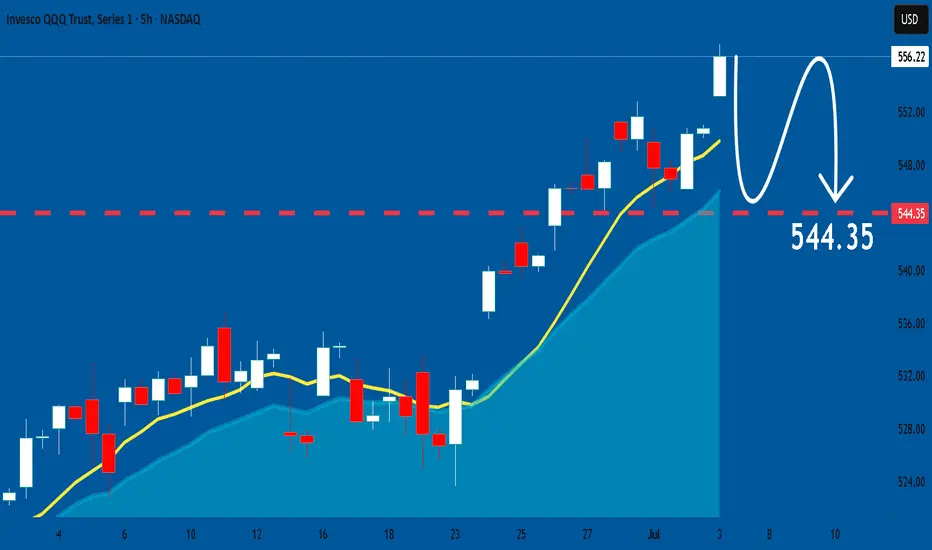
QQQ Massive Short! SELL!
My dear subscribers,
QQQ looks like it will make a good move, and here are the details:
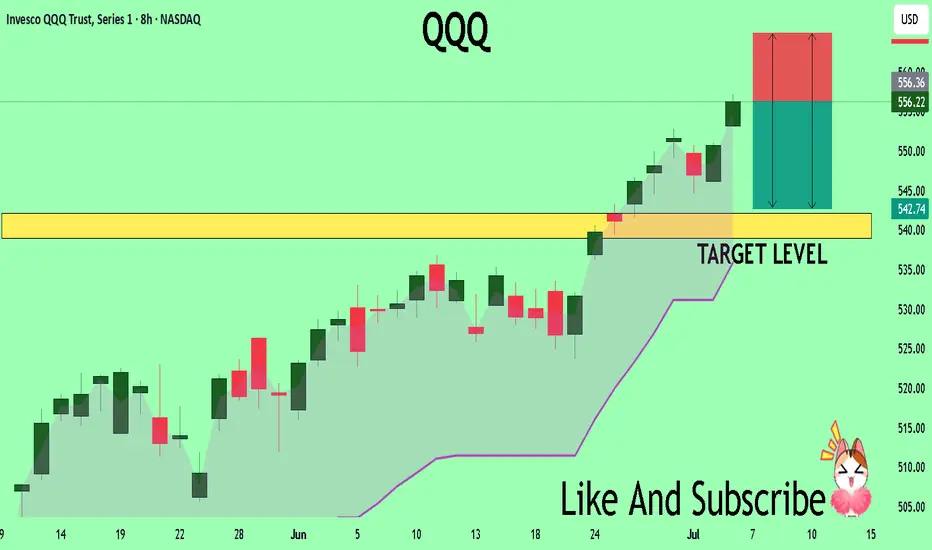
The market is trading on 556.22 pivot level.
Bias - Bearish
My Stop Loss - 564.94
Technical Indicators: Both Super Trend & Pivot HL indicate a highly probable Bearish continuation.
Target - 542.15
About Used Indicators:
The average true range (ATR) plays an important role in 'Supertrend' as the indicator uses ATR to calculate its value. The ATR indicator signals the degree of price volatility.
Disclosure: I am part of Trade Nation's Influencer program and receive a monthly fee for using their TradingView charts in my analysis.
———————————
WISH YOU ALL LUCK
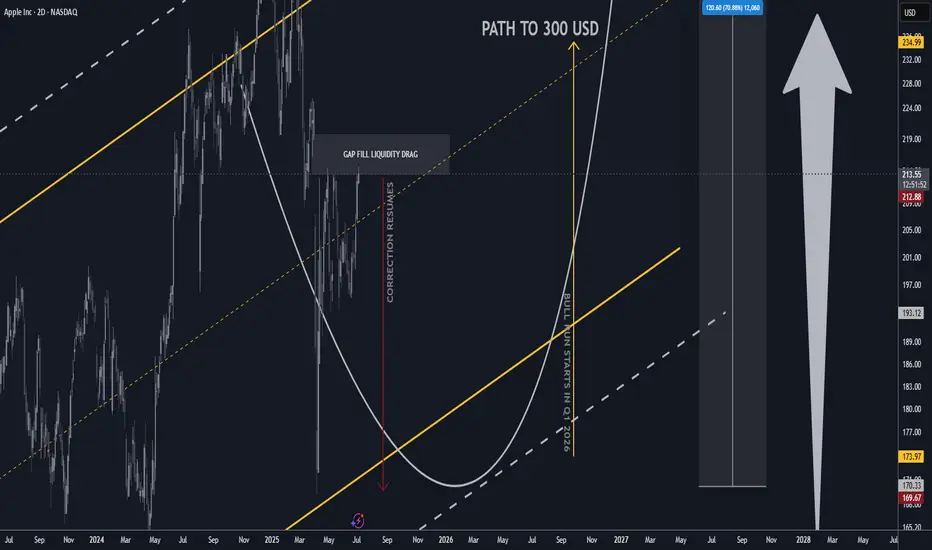
AAAPL: Updated Outlook and Best Level to BUY/HOLD 70% gains________________________________________
Apple Outlook: July 2025–Q1 2026
After peaking near $200 in late May, Apple (AAPL) remains under correction territory despite pockets of resilience, closing July around $193. The current correction is projected to persist until Q1 2026, as global macro and policy headwinds weigh on the broader tech sector. Technicals suggest AAPL could find its cycle low between Q3 and Q4 2025, potentially setting the stage for a renewed bull run into late 2026. Pullback until 170/175 USD. 📉
Catalysts Shaping Apple’s Stock Price in 2025–26
1. AI Integration and Apple Intelligence
Strength: 9/10
The roll-out of on-device Apple Intelligence features—including an upgraded Siri, ChatGPT integrations, and generative AI tools—continues to build anticipation for a major iPhone upgrade supercycle. Initial adoption has been strong, but broader impact will hinge on Q4 developer and enterprise feedback. 🤖
2. Services Segment Growth
Strength: 8.5/10
Apple’s Services business (App Store, iCloud, Apple Music, AI-powered subscriptions) is projected to post double-digit growth into Q4 2025, with consensus revenue estimates at $25–27B for the quarter. Analysts see upside from new AI-driven service bundles, which could add $5–8B in annualized revenue by 2026. 💡
3. Gross Margin Expansion & Cost Efficiencies
Strength: 8/10
Apple’s gross margin is forecast to improve by up to 60 basis points in Q4 2025 as the product mix tilts toward higher-margin services, and as component costs ease. Operational efficiencies from supply-chain automation may further cushion profit margins amid macro uncertainty. 📊
4. iPhone 17 Product Cycle
Strength: 7.5/10
The iPhone 17 lineup—rumored to include advanced polymer batteries and potential foldable form factors—is expected to launch Q4 2025, giving Apple a competitive hardware edge versus Android rivals. Early channel checks point to pent-up demand, though upgrade rates may lag previous cycles due to consumer caution. 📱
5. Vision Pro & Hardware Diversification
Strength: 7/10
Next-gen Vision Pro headsets and new AR/VR devices, boosted by Apple Intelligence, are expected to drive incremental growth in Q4 2025. However, high price points and limited mainstream adoption keep near-term impact contained. 🥽
6. Share Buybacks & Dividend Policy
Strength: 7/10
Apple’s $110B share buyback authorization and steady dividend growth provide valuation support, but recent market volatility has prompted a more cautious pace of repurchases. Yield-seeking investors are watching closely for any pivot in capital return policy if macro pressures persist. 💵
7. Supply Chain & Trade Policy Risks
Strength: 6.5/10
Escalating U.S.–China trade tensions—including the risk of expanded tariffs or tech export bans—remain a top concern. Apple is accelerating its assembly shift toward India and Vietnam to diversify risk, but any new policy shocks in Q4 could hit margins and unit volumes. 🌏
8. Regulatory & Antitrust Pressures
Strength: 6/10
The EU’s Digital Markets Act and potential U.S. antitrust probes could force Apple to further open up its iOS ecosystem by year-end, potentially capping Services revenue growth and adding compliance costs. ⚖️
9. Macro & Interest-Rate Environment
Strength: 5/10
With the Fed signaling “higher for longer” rates through mid-2026, tech sector valuations remain under pressure. Analysts see this limiting multiple expansion even if EPS growth resumes in late 2025. 📈
10. Smartphone Market Competition
Strength: 5/10
Aggressive pricing and innovation from Samsung and Chinese OEMs are intensifying competitive pressures, especially in emerging markets. Apple’s share gains are likely to slow until the macro environment improves and new hardware cycles fully materialize. 🥊
________________________________________
Analyst Projections for Q4 2025:
• Consensus Revenue: $108–112B (up ~4% YoY)
• EPS Estimate: $2.30–$2.42
• Gross Margin: 45–46%
• iPhone Unit Growth: 2–3%
• Services Revenue: $25–27B
Morgan Stanley and JP Morgan maintain “Overweight” ratings, but expect rangebound performance until macro and trade uncertainty clears. Most price targets for Q4 2025 hover between $195–$215, with upside potential post-correction into 2026. 📊
________________________________________
Analyst / Firm Date Rating Price Target (USD)
Barclays 06/24/2025 – 173 ()
Jefferies (E. Lee) 07/01/2025 Hold (Upgraded) 188.32
UBS (D. Vogt) 07/03/2025 – 210.00
J.P. Morgan (S. Chatterjee) 06/26/2025 Overweight 230.00
Morgan Stanley (E. Woodring) 03/12/2025 Overweight 252.00
Evercore ISI 01/31/2025 – 260.00
Redburn Partners 01/31/2025 – 230.00
D.A. Davidson (G. Luria) 05/02/2025 – 250.00
TradingView Consensus (avg) – Consensus 228.98
TipRanks Consensus (avg over 3mo) – Consensus 226.36
Inevitable Pull Back Coming Soon?| NVDA TSLA AAPL AMZN META MSFTStock market Forecast | QQQ SPY CME_MINI:NQ1! CME_MINI:ES1!
Mag 7 FORECAST| NASDAQ:NVDA NASDAQ:TSLA AAPL AMZN META MSFT July 2025 Forecast

QQQ: Expecting Bearish Movement! Here is Why:
The price of QQQ will most likely collapse soon enough, due to the supply beginning to exceed demand which we can see by looking at the chart of the pair.
Disclosure: I am part of Trade Nation's Influencer program and receive a monthly fee for using their TradingView charts in my analysis.
❤️ Please, support our work with like & comment! ❤️
SPY/QQQ Plan Your Trade End Of Week Update For 7-4Happy 4th of July
I've been very busy with projects and new tools for traders, as well as the new book I'm working on, and thought I would deliver an End Of Week update for everyone.
In this video, I cover the past Cycle Patterns and how they played out for the SPY/QQQ, Gold/Silver, and Bitcoin, as well as add some of my own insight related to the market trends.
All of my systems are still LONG and have not changed. I still believe this market is extremely overbought, and I believe it could roll over at any moment into a pullback - but we need to wait to see if/when that may/does happen.
Gold made a big move higher this week, and I believe that move could continue throughout July.
Bitcoin made a surprising Double-Top and is not rolling downward. Could be a breakdown in the markets as BTCUSD tends to lead the QQQ/NQ by about 3-5 days.
The SPY/QQQ rallied like a rocket all week. It was absolutely incredible to see the markets rally like this. But, I'm still cautious of a sudden rollover top.
I managed to catch some nice trades with options spreads this week, and my metals positions were on fire. I'm still trading from a "hedge everything" mode as I don't trust this rally, and I'm still watching for REJECTIONS near these new highs.
Stay safe and GET SOME.
DM me if you have any questions.
#trading #research #investing #tradingalgos #tradingsignals #cycles #fibonacci #elliotwave #modelingsystems #stocks #bitcoin #btcusd #cryptos #spy #gold #nq #investing #trading #spytrading #spymarket #tradingmarket #stockmarket #silver

July Doesn't Disappoint - S&P Nasdaq Dow Russell All RunningS&P All Time Highs
Nasdaq All Time Highs
Dow Jones closing in on All-Time Highs (and outperforming both S&P and Nasdaq recently)
Russell 2000 playing catch up and moving higher
This is melt-up at its finest
Since US/China Trade Agreement and Middle East Ceasefire Agreement, markets have used
these two events as further catalysts to continue the upside runs
Stochastic Cycle with 9 candles suggesting a brief pause or pullback in the near-term, but
a 3-5-10% pullback is still an opportunity to position bullish for these markets
I'm only bearish if the markets show that they care with price action. The US Consumer isn't breaking. Corporate Profits aren't breaking. Guidance remains upbeat. Trump is Pro Growth and trolling Powell on the regular to run this economy and market HOT demanding cuts (history says that's a BUBBLE in the making if it's the case)
Like many, I wish I was more aggressive into this June/July run thus far, but I'm doing just fine with steady gains and income trades to move the needle and still having plenty of dry powder
on the sidelines for pullbacks
Markets close @ 1pm ET Thursday / Closed Friday for 4th of July
Enjoy the nice long weekend - back at it next week - thanks for watching!!!

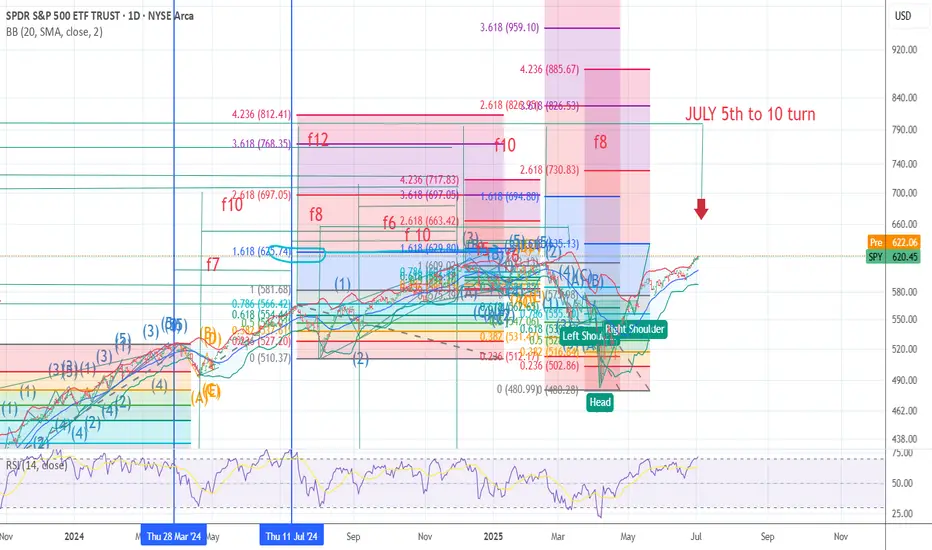
SPRIAL TURN MAJOR JULY 5to the 10th TOP 4 spiral and one FIBThe chart posted is the updated chary for SPY SPIRAL calendar TURN Notice f12 is a spiral from July 16th 2024 top F 10 is from 11/2024 DJI The SPY was 12/5 th TOP F8 is from Feb 19th Top They ALL have a focus point on JULY 5th to 10th 2025 it is also 89 days since the print low. I Am looking for a MAJOR World event into this date . This time I feel it will be something with JAPAN . As to the markets here The put/call is now at the same level as july 2023 top and july 2024 . I have had fib targets in cash sp 500 from 6181 to as high as 6331 we are now in the middle of the targets But Time still has 3 to 5 days .So if we close strong today I will be buying deep in the money puts once again . The QQQ have entered the min target 551/553 But I tend to think {HOPE] we can reach 562 plus or minus 1.5 to move to a full short . But now in cash BTW the SMH target 283/285 is also a target .for its TOP Bitcoin is now setup for the next TOP I just need a new high .Best of trades WAVETIMER
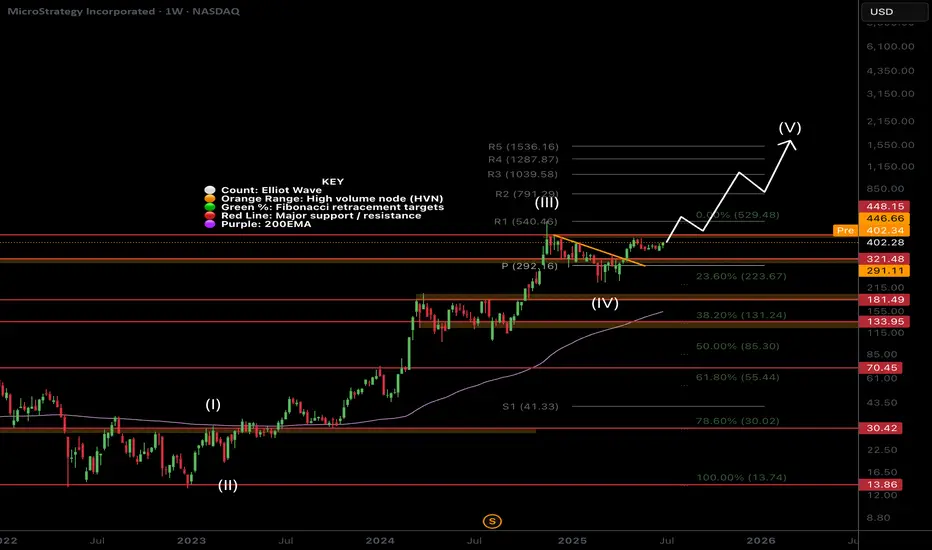
$MSTR Megatrend Continuation?NASDAQ:MSTR is market leader in the CRYPTOCAP:BTC strategic reserves strategy and has set the benchmark.
After a nearly 20x rally profit take is exceptive, price has held up extremely well through the last 6 months only dropping to the .236 Fibonacci retracement and weekly pivot. As Bitcoin continues into price discovery expect the MSTR rally to continue with renewed tailwinds.
It is an extremely hated stock as well as its collection of yield baring derivatives. The keeps the social mood / sentiment low which could prove further tailwind for growth.
I am looking at a terminal target this cycle of around $1500 at the R5 weekly pivot.
Safe trading
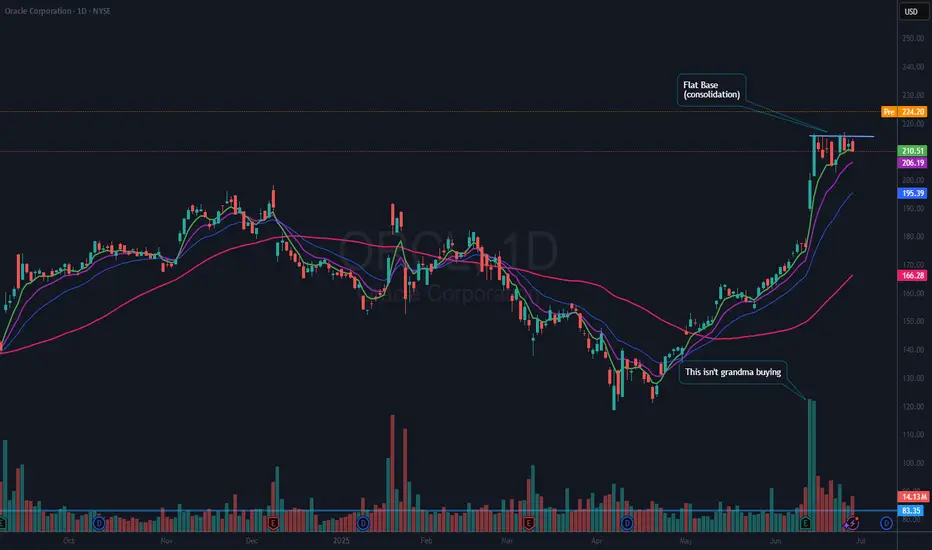
$ORCL Beats Earnings – Flat Base Breakout?There is a lot to like about NYSE:ORCL both on the chart and fundamentals. Not only did they beat earnings and now get an upgrade (see below), but the stock has also now formed a flat base after earnings. What that means to me is that buyers have pushed the stock up and there are not enough sellers to bring it back down.
I have an alert set at 215.01. If that triggers, I plan to open a full-sized position with a stop just under the most recent low (202.54). That is a 6% risk. Although, if it does not perform well right off the bat, I may close it on whatever day I open if it falls below the day low. All TBD.
If you like this idea, please make it your own and follow your trading plan. Remember, it is your money at risk.
Oracle rises as Stifel upgrades to 'buy'
** Stifel upgrades stock to "buy" from "hold", citing strong momentum in its Cloud business and disciplined cost management
** Increases PT to $250 from $180, implying an 18.91% upside to stock's last close
** "We believe Oracle is well positioned to accelerate total Application Cloud growth to the low teens range in FY26" - brokerage
Oracle Beat Expectations
Wednesday, June 11, 2025 at 4:05 PM ET
Oracle (ORCL) reported earnings of $1.69 per share on revenue of $15.90 billion for the fiscal fourth quarter ended May 2025. The consensus earnings estimate was $1.64 per share on revenue of $15.54 billion. The Earnings Whisper number was $1.66 per share. The company beat expectations by 1.81% while revenue grew 11.31% on a year-over-year basis.
SPY/QQQ Plan Your Trade For 7-1 : Post Market UpdateToday was a very powerful day for the Cycle Patterns - particularly for Gold and BTCUSD.
Gold rallied as the Cycle Pattern predicted a RALLY in TREND mode.
BTCUSD collapsed on a CRUSH Cycle Pattern.
The SPY Cycle Pattern predicted a Gap Reversal pattern. We did see the Gap today and a moderate reversal in price. But the SPY, as usual, continued to try to melt upward.
I highlighted a very interesting TWINNING pattern in Bitcoin in this video. Pay attention.
Get some.
#trading #research #investing #tradingalgos #tradingsignals #cycles #fibonacci #elliotwave #modelingsystems #stocks #bitcoin #btcusd #cryptos #spy #gold #nq #investing #trading #spytrading #spymarket #tradingmarket #stockmarket #silver

QQQ A Fall Expected! SELL!
My dear subscribers,
This is my opinion on the QQQ next move:
The instrument tests an important psychological level 548.21
Bias - Bearish
Technical Indicators: Supper Trend gives a precise Bearish signal, while Pivot Point HL predicts price changes and potential reversals in the market.
Target - 535.27
About Used Indicators:
On the subsequent day, trading above the pivot point is thought to indicate ongoing bullish sentiment, while trading below the pivot point indicates bearish sentiment.
Disclosure: I am part of Trade Nation's Influencer program and receive a monthly fee for using their TradingView charts in my analysis.
———————————
WISH YOU ALL LUCK
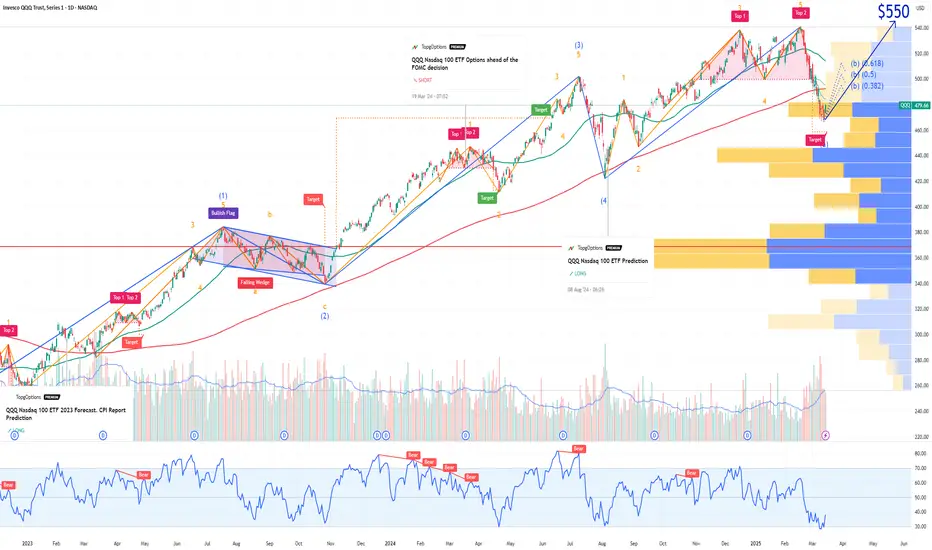
QQQ Nasdaq 100 Year-End Price Target and Technical Rebound SetupIf you haven`t bought the previous oversold area on QQQ:
Now the Nasdaq-100 ETF (QQQ), which tracks the performance of the largest non-financial companies in the Nasdaq, has recently entered oversold territory, suggesting that a technical rebound may be imminent. Similar to the Russell 2000, QQQ has experienced significant selling pressure, driving key technical indicators into oversold zones and creating favorable conditions for a bounce.
The Relative Strength Index (RSI) has dropped below 30, a level that typically signals oversold conditions and the potential for a reversal. Additionally, QQQ is trading near key support levels, with a large portion of its components underperforming their 50-day and 200-day moving averages — a classic setup for a mean reversion rally.
From a historical perspective, QQQ has shown a tendency to rebound strongly after similar oversold conditions, particularly when macroeconomic factors stabilize and buying pressure returns. Given the current technical setup, my price target for QQQ is $550 by the end of the year. This represents a recovery of approximately 8-10% from current levels, aligning with previous post-oversold rallies in the index.
While downside risks remain — including potential volatility around Federal Reserve policy and broader economic data — the technical backdrop suggests that QQQ is well-positioned for a recovery in the coming months.
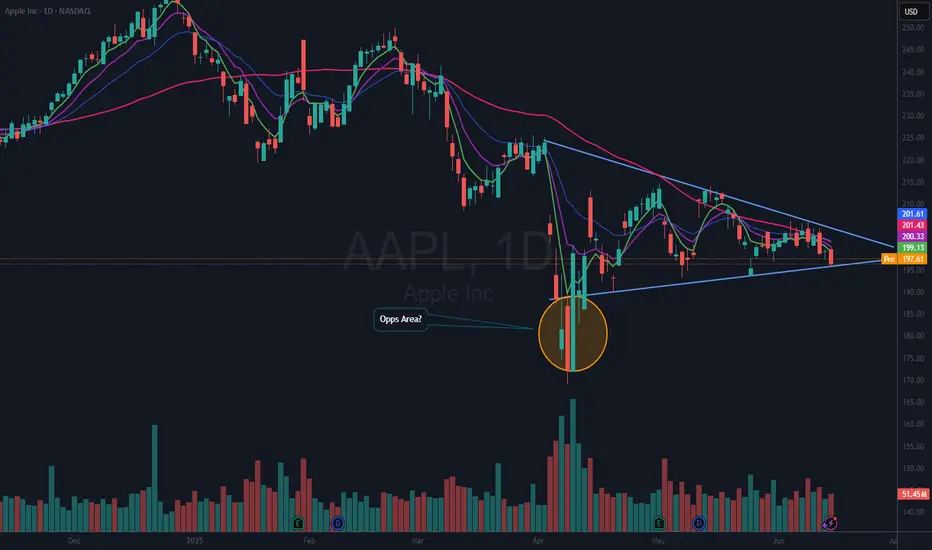
$AAPL In ConsolidationNASDAQ:AAPL is consolidating here in a wedging pattern. I do not know which way this will resolve. But, since I rarely if ever short, I am looking on the long side of a trade. The thing I like about a consolidation pattern like this is, you know when you are wrong very quickly. My plan is to take a ¼ size long position if / when it moves above the 50 DMA (red) with a stop just below the most recent low (which would also correspond to dropping below the lower wedging trendline.
Then if it can break out over the upper downtrend line, I will look to build out my position. I thought this would be a good one to put on your watchlist. If you like the idea, please make it your own so that it fits within your trading plan.
Stock Market Forecast | TSLA NVDA AAPL AMZN META MSFTStock Market Forecast | CME_MINI:NQ1! CME_MINI:ES1! QQQ SPY
Mag 7 Forecast | CBOE:MAGS NASDAQ:TSLA NVDA AAPL AMZN META MSFT

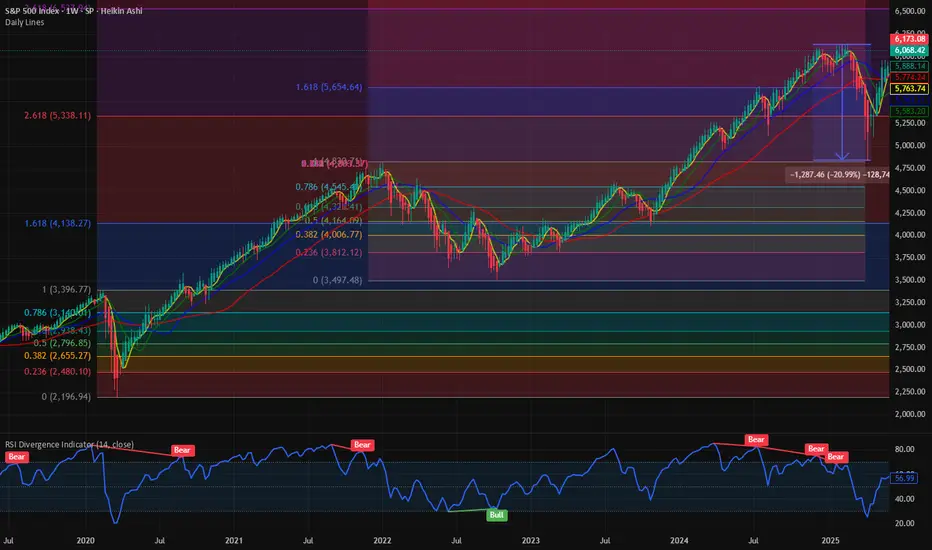
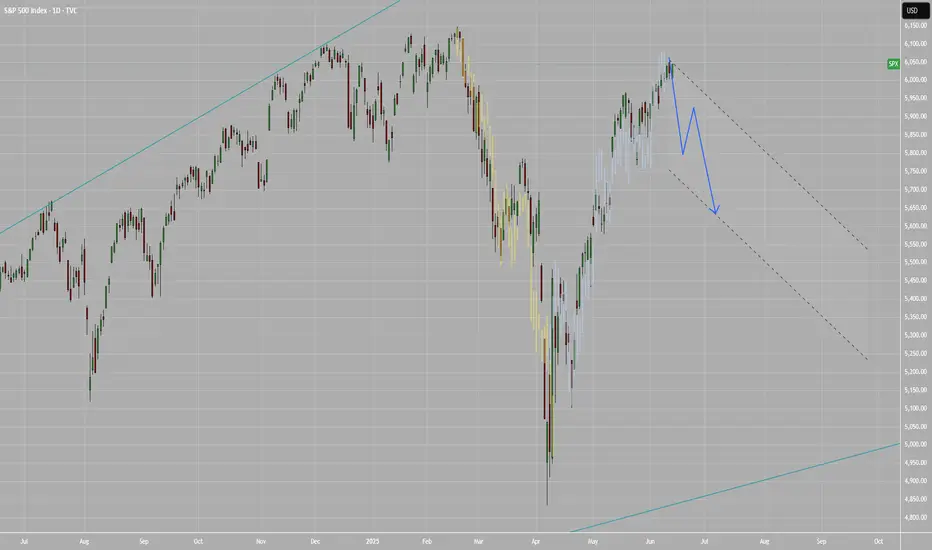
$SPX Path of least resistance is higher. Next Stop : 6500 This week we officially recovered all the losses from the liberation day low. We had a 20% bear market crash and since then there has been a V shaped rally in the major averages. NASDAQ:QQQ and SP:SPX have fully recovered the losses and then some. It is 0% form its ATH. We have been closely following the chart of SP:SPX for the last few weeks and have marked various Fib Retracement levels and Fib Extenstion. IN my opinion the Covid lows were one of the majot drawdown moments.
If we plot the Fib Extension on the COVID highs and lows, we can clearly see the Support and Resistance zones. As per the Fib Levels the next consequential level in SP:SPX will be 6550, which is the 3.618 Fib level. That I would suggest as the path to least resistance. First, we go higher before we can see any major correction. In case of a Major correction, we get support @ 5300.
Verdict : SP:SPX goes higher first before correction. 6550 is the next stop.
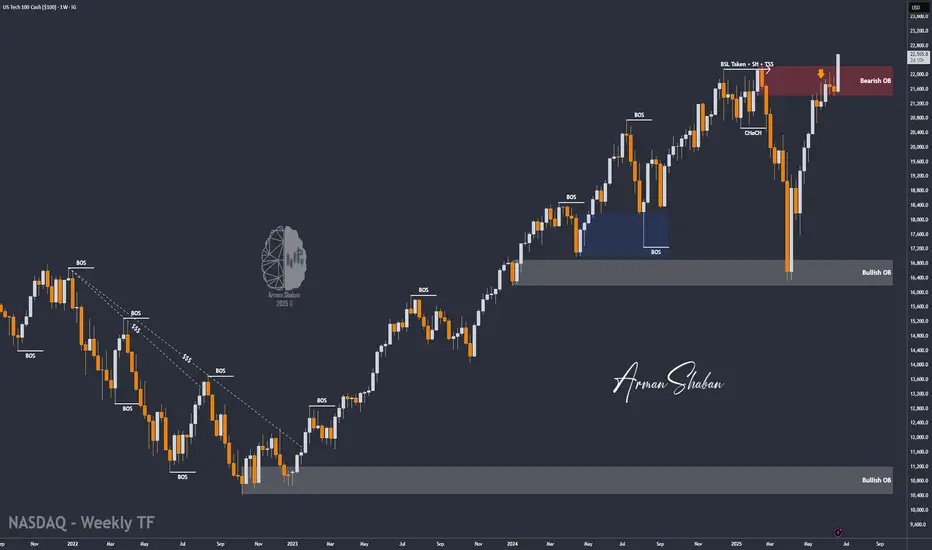
Nasdaq Hits New ATH at $22,570 – Eyes Now on $23,200 and $24,000By analyzing the #Nasdaq chart on the weekly timeframe, we can see that the index followed our previous analysis perfectly, hitting the $22,400 target and printing a new all-time high at $22,570!
Momentum remains strong and bullish, and we expect price to continue climbing toward the next targets. Based on the original projection, upcoming targets are $23,200 and $24,000.
Stay tuned for the next update!
Please support me with your likes and comments to motivate me to share more analysis with you and share your opinion about the possible trend of this chart with me !
Best Regards , Arman Shaban
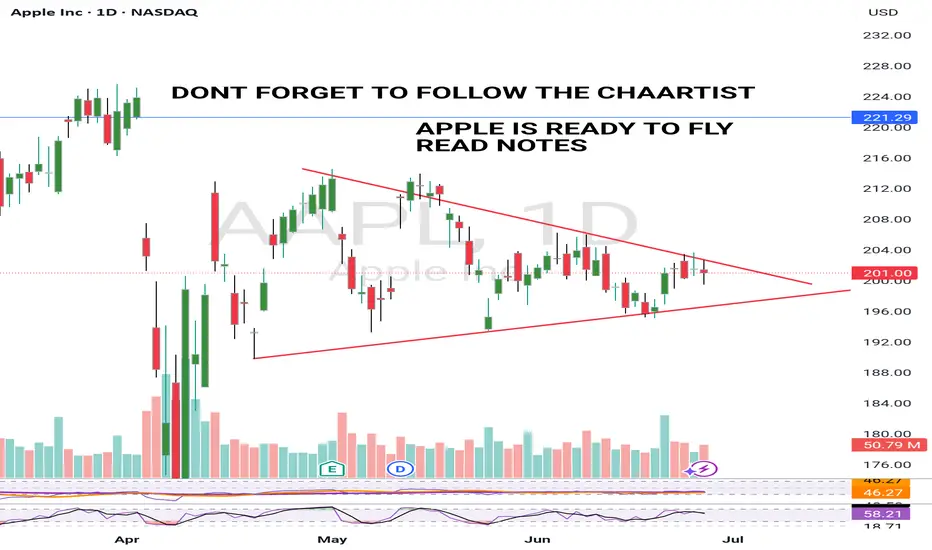
APPLE BULLISH 26 JUNE 2025Apple looks ready to breakout.It is really well squeezed now and ready to form a Green candle.
Breakout is an expectation so dont trade blindly.
I will upload video analysis Asap.
I am bullish and my price target is a minimum $220 from here.
NOTE: RISK MANAGEMENT IS A MUST
TSLA PRICE ACTION JUNE 25 2025This is the price action for Tesla. I have discussed all the levels. I have given a trade today & have discussed it thoroughly.
If you have any doubts, then feel free to Dm me or leave a comment below
NOTE:DO NOT BUY CALLS
