SPY/QQQ Plan Your Trade for 5-23 : Carryover PatternLooking at the charts today, I want to say that it certainly looks like the SPY Cycle Patterns are blending into a consolidated CRUSH/BOTTOM pattern (see the weekend patterns) today and possibly "carrying over" into the early trading next week.
I have been warning of a pending rollover/breakdown in this uptrend for weeks. Today's breakdown seems a bit aggressive, but it is what it is.
If the patterns are consolidating/blending into a bigger breakdown over the Memorial Day weekend, then we could be looking at a very big downward/rotational move in the SPY/QQQ/Bitcoin over the next 5+ trading days while Gold/Silver continue to rally.
Silver is lagging Gold right now, but I don't think that lasts. Once Gold gets back above $3400, I believe Silver will start to make a big move higher.
The big question in my mind is - how does this carry into Monday's holiday trading schedule and into Tuesday's OPEN?
I'll have to see how things play out today - but it certainly looks like I'll be adding some SPREADS to potentially catch any big move over this weekend.
GET SOME.
This could play out exceptionally well for skilled traders.
#trading #research #investing #tradingalgos #tradingsignals #cycles #fibonacci #elliotwave #modelingsystems #stocks #bitcoin #btcusd #cryptos #spy #gold #nq #investing #trading #spytrading #spymarket #tradingmarket #stockmarket #silver
QQQ

Tesla (TSLA): Daily uptrend support and potential bull flagHey guys/gals,
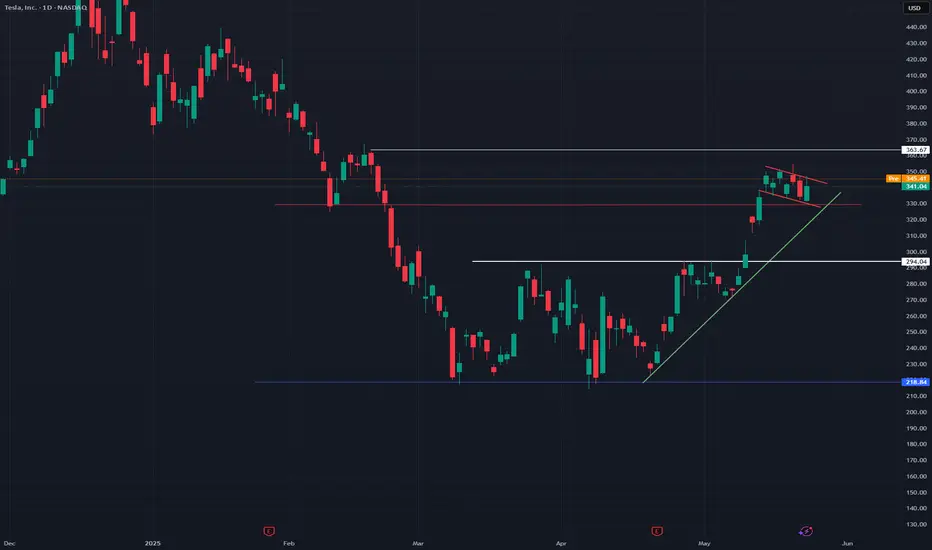
Today, I am showing you the daily chart of Tesla ( NASDAQ:TSLA ), which provides an idea of where this stock may be heading next.
As you can see, the support trendline from the 21st April low is still well intact. Currently, Tesla is holding this line very well and over the past few days, it's clear that it has also been in consolidation mode. Taking a deeper look, the consolidation period seems to be forming a potential bull flag pattern. Minus the upper wick which could be a price anomaly due to a fake-out, a real actual breakout from the bull flag in combination with a bounce from the support trendline could help Tesla reach $365 as the next resistance point.
On the contrary, and it does depend strongly on what the broader market does next (as Tesla is a high beta stock), its flag pattern may not play out and a break below the support line could send the stock all the way to first support at £325.
This wholly depends on the wider market. On my other posts, I've made it clear that S&P 500 AMEX:SPY is also forming a flag pattern, with many other indices following suit.
Note: Not financial advice.
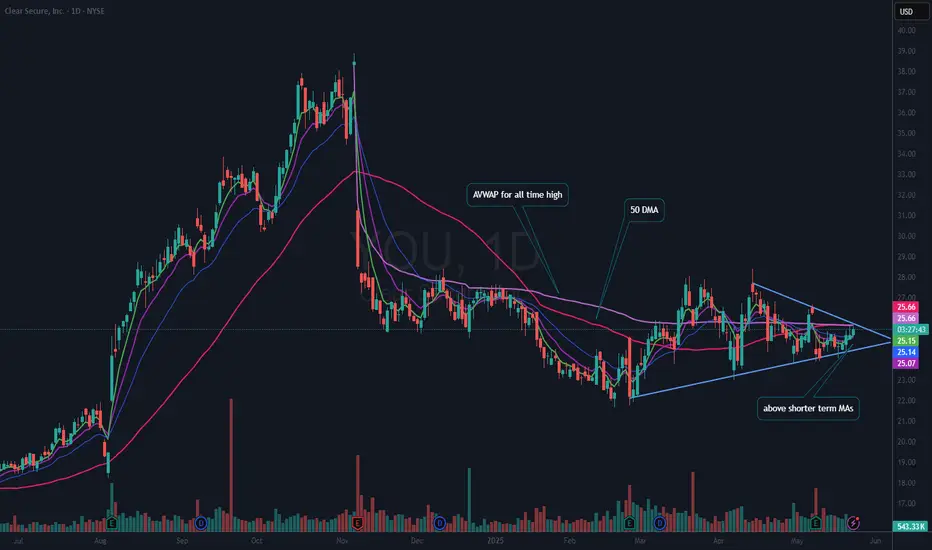
$YOU – Wedging with Confluence of MA’s & AVWAPNYSE:YOU is a name I have “thought” could move higher. It is the Clear System at select airports. They continue to expand to other busy airports, and it is an IPO from 2021, so it has had time to squeeze out pure speculation.
To be sure this type of wedging pattern can resolve either way. It is more of a consolidation type pattern. I like the fact that it is above the shorter-term Moving Averages but is stuck just below the All Time High AVWAP and the 50 DMA which also coincides with the upper downtrend line (DTL) of the wedging pattern.
For me to take a trade it either needs to move up through the AVWAP, the 50 DMA and the DTL, in which case I will go long with a stop under the most recent higher low. If it breaks down, I will consider a short trade.
If you like this idea, make it your own and make sure it fits with your trading plan.
SPY/QQQ Plan Your Trade For 5-22 : Inside Breakaway CountertrendToday's Inside Breakaway in Countertrend mode suggests the markets may attempt to move downward - away from the recent highs.
I believe the SPY/QQQ will move into a sideways/consolidation range over the next 3-5+ trading days before attempting to make any big moves. We have a holiday-shortened trading week next week, and I believe the markets are moving into the Summer doldrums.
Overall, I would ask traders to stay cautious of this transition in the markets over the next 5--10+ days and prepare for volatility to increase after June 1st.
You all know what I believe is the most likely outcome - a rollover topping pattern followed by a breakdown in price targeting the 525-535 level on the SPY. We'll see what happens going forward.
Gold and Silver pullback back overnight which suggests the metals markets were a bit overheated to the upside. I still believe Metals will continue to push higher.
BTCUSD is trading up above $111k. Here we go.
BTCUSD is moving up into the potential rejection level that I suggested in my 5-20 video as a MASSIVE WARNING setup.
This is where we'll see how BTCUSD plays out - if we continue to push higher or if we REJECT and move into a broad downtrend.
I didn't expect it to happen only TWO DAYS after my video - but here we are.
Time to get muddy and play what price puts in front of us.
Get some.
#trading #research #investing #tradingalgos #tradingsignals #cycles #fibonacci #elliotwave #modelingsystems #stocks #bitcoin #btcusd #cryptos #spy #gold #nq #investing #trading #spytrading #spymarket #tradingmarket #stockmarket #silver

TSLA PRICE ACTION 21st MAY 2025This is the updated price action of Tesla. I have clearly discussed the new buying levels & have also discussed why I sold it.
If you have any questions, feel free to leave a comment or DM me.
NOTE: AVOID OPTIONS IN TESLA

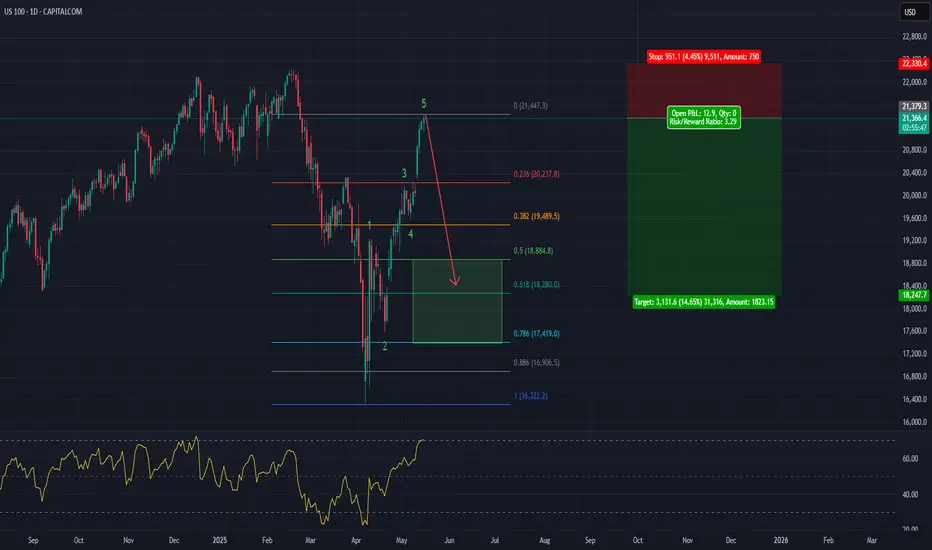
Going short on the Nasdaq 100CAPITALCOM:US100
The Nasdaq 100 has moved up impulsively on a 5-wave move over the past 6 weeks, which is very bullish long term. However, in the short term, it is overextended, with the RSI indicator over the 70 level.
I expect it to decline over the next couple of weeks to the area marked in the green rectangle, between the 50% and the 78.6% Fibonacci Retracement level.
I hope you find this interesting.
Good luck to you
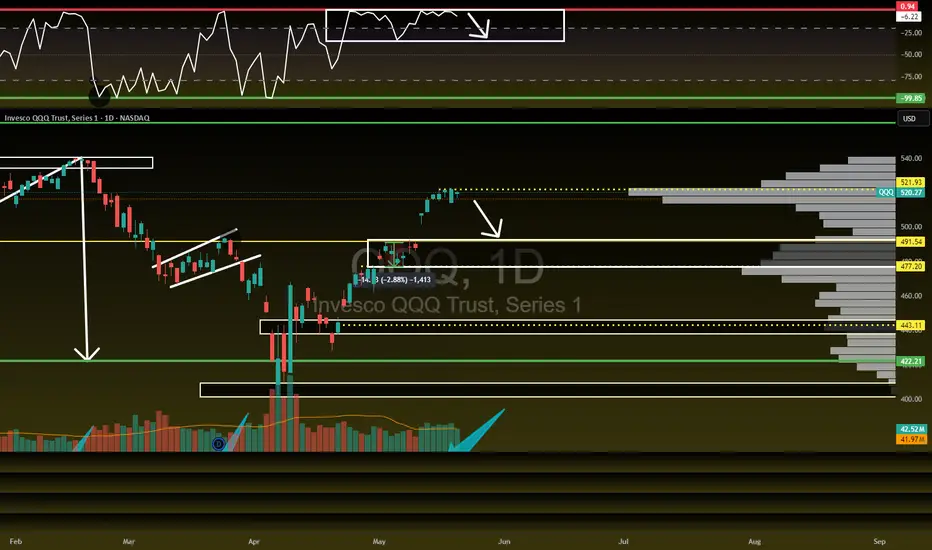
QQQ about to FLUSH?! Let's talk about it!I'm not saying it's over but you have to admit it does feel like we are going to see a decent size pullback...2-6% over the next few weeks on the NASDAQ:QQQ AMEX:SPY
- TVC:VIX back over 20
- US20Y hit 52 week high
- USDJPY starting to creep towards April lows
- $491.54 GAP to fill on NASDAQ:QQQ
- $447.58 Bigger GAP to fill on NASDAQ:QQQ
- Credit starting to become and issue
- Banks/ Credit companies tanked today
There is bullish pieces as well but we do look extended here and a healthy 2-6% would be welcomed...A break of $475 level spells trouble on QQQ.

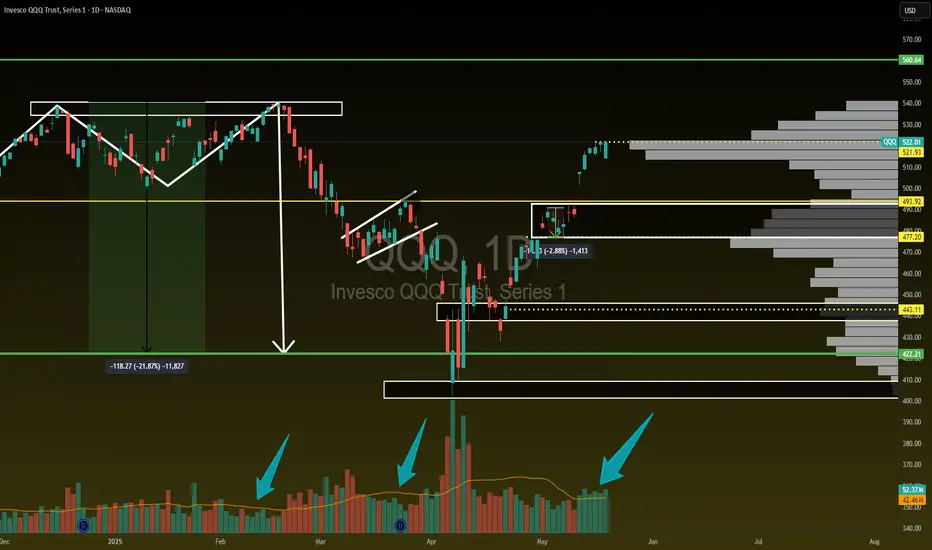
$QQQ is due for a pullback! GAP fill inboundNASDAQ:QQQ is due for a pullback!
- Slamming into $522ish Volume shelf
- At the red barrier and needs to peel off
- GAP fill down to $491.54
- Strong volume but can't push through $522 resistance
SPY/QQQ Plan Your Trade For 5-21 : Inside-BreakawayI've been very clear over the past few weeks that I believe the markets are poised for a rollover/topping pattern and I believe BTCUSD is showing us exactly how/when that rollover top is going to play out (June 1-June 9).
In the meantime, I believe the SPY/QQQ are entering a more volatile "early topping" formation while still in an uptrend (Bullish).
I urge traders to start watching various sectors for weakness and keeping your eyes open for any signs the market could be moving into a sideways price rotation.
I think the rollover top will be aligned with some financial event (trade/tariff/other) that will result in a broad disruption of the US/Global markets. And I believe BTCUSD will lead the move by about 4-7+ days.
Gold and Silver are starting to move higher again. That is a sure sign that traders are now more actively seeking to hedge global risks (again).
I believe this move higher in metals may continue through this week and into next week (looking for that top in the SPY/QQQ).
Follow my detailed BTCUSD video to learn why BTCUSD may continue to try to push a bit higher before topping and moving into a broad price decline.
Get some..
#trading #research #investing #tradingalgos #tradingsignals #cycles #fibonacci #elliotwave #modelingsystems #stocks #bitcoin #btcusd #cryptos #spy #gold #nq #investing #trading #spytrading #spymarket #tradingmarket #stockmarket #silver

5-20-25 WARNING : Bitcoin Sets Up MASSIVE Double-Top WarningI highlighted this incredible price/technical pattern in my morning Plan Your Trade video. But, I thought it was important enough to create a separate video highlighting this incredible Double-Top warning and to try to tell all of my followers to start actively protecting capital over the next 2-3+ weeks.
As much as I would like to say this won't happen (meaning some type of crisis event or global financial crisis) causing a collapse in Bitcoin (and the US/Global markets) - but I believe the continued constraints on the global markets, related to Trump's policies and attempts to reduce US govt spending) will act as a devaluation event for global economies.
Think about it for a minute...
1. If the US is able to remove $500-900 Billion in fraud/waste/NGO spending (of which, a portion of that spending is dedicated to supporting global initiatives/spending), this will result in a contraction (in some form) for some global economies.
2. If the US is able to negotiate more favorable tariff rates for US goods supplied to the world (where foreign nations reduce or eliminate tariffs on US goods), this will also act as a reduction in economic income for many foreign nations.
3. These combined and continued efforts to restructure the US economy into a strong and more dynamic global economic driver (more fairly balanced in terms of global trade) will come at the expense of breaking away from what has traditionally been untouched.
This breaking of the past, in terms of what nations expected related to US spending and tariffs on US Goods, may represent a 15-25% (or more) contraction in foreign economic activity.
If this disruption from "what was normal" results in the US Fed, or global central banks, taking emergency measures to address short-falls in their economies, this could prompt a series of events that could result in a broad devaluation type of event (very similar to what happened after COVID in 2022-2023).
That event was prompted by the US Fed raising rates trying to stop inflation. This event could be the result of slower/lower economic outputs/expectations related to the changing tariff rates and the reduction in US spending throughout the world. Central Banks and regional governments may attempt to provide some type of capital stimulus to transition through this phase - but I see that as "building a bigger bubble - just waiting to pop".
The smart move for global central banks is to follow the US's lead and start to move towards more austerity/accountability regarding their own economies/spending and attempt to let the devaluation price phase play out.
Either way, time will tell if I'm correct or not.
You have been warned. IMO, you have about 3-6 weeks before BTCUSD potentially tops and may roll into a very strong breakdown phase.
Get Some.
#trading #research #investing #tradingalgos #tradingsignals #cycles #fibonacci #elliotwave #modelingsystems #stocks #bitcoin #btcusd #cryptos #spy #gold #nq #investing #trading #spytrading #spymarket #tradingmarket #stockmarket #silver

SPY/QQQ Plan Your Trade For 5-20 : Harami-InsideToday's pattern suggests the SPY/QQQ will stay somewhat FLAT in trading.
In this video, I go over the SPY/QQQ, Gold/Silver, and BTCUSD.
What I find interesting in today's video is the setup in BTCUSD - being very similar to the peak in late 2021 before the double-top in Bitcoin.
If my analysis is correct, we are moving into a type of final speculative phase (bullish) that will quickly transition into a type of breakdown move in the US/Global markets.
Gold should do very well once this move sets up and begins to drive the Risk/Hedge trade.
In the meantime, sit back and wait for this speculative move to phase out (top).
Get some.
#trading #research #investing #tradingalgos #tradingsignals #cycles #fibonacci #elliotwave #modelingsystems #stocks #bitcoin #btcusd #cryptos #spy #gold #nq #investing #trading #spytrading #spymarket #tradingmarket #stockmarket #silver

THIS TIME IT'S DIFFERENT!🔥 THIS TIME IT'S DIFFERENT! 🔥
Can you see the shift?! VOLUME IS HERE—AND IT'S MASSIVE. 💪💰
Unlike those weak, fleeting rallies that got crushed under waves of red, this one is packed with bullish buyers and offside hedge funds READY TO SEND IT HIGHER. 🚀📈
Not to mention the last time we had this level of above average volume for this long was in October 2023 when we were coming out of a bear market and it was only the beginning of our ascent higher!
I'm not saying we can't have a pullback soon...I'm just simply saying the volume is here and it looks like dips will indeed be shallow.
ATH retest INBOUND!
Are you positioned for the move? 👀
AMEX:SPY NASDAQ:QQQ
SPY/QQQ Plan Your Trade For 5-19 : Gap Breakaway In Trend ModeToday's pattern suggests the SPY/QQQ will start with an opening price GAP (downward in this case) and could continue to move into a Breakaway pattern.
Given the recent news of a US Credit Downgrade, I'm suggesting all traders prepare for what may become a period of sideways price volatility over the next 3-5+ days.
I've highlighted a potential breakdown range on the SPY/QQQ on my charts that I believe acts as a solid confirmation level related to any potential reversal/breakdown in trend.
Currently, the trend is still BULLISH. If price falls below my breakdown range (the angled rectangle on my charts) - then I believe price will have broken this upward FLAGGING trend channel and will begin to move downward - targeting lower support levels.
This is a critical time for the markets. If we fail to move higher at these levels, we have a long way to go (downward) before we attempt to find any support.
Gold and Silver appear to be attempting to break the FLAG HIGH of an Inverted Excess Phase Peak pattern. This could prompt a strong rally phase back above $3300/$33 for Gold/Silver over the next few days. Time will tell how things play out.
BTCUSD appears to be REJECTING the recent highs within a consolidation range. If this rejection continues, I see BTCUSD moving downward - trying to reach the $95k (or lower) looking for support.
Remember, we are still generally BULLISH and moving upward within the FLAGGING channel. If we do get a breakdown in price over the next few days, it will become clearly evident on the charts and we'll have to begin to change our expectations.
Right now - HEDGE.
Get Some...
#trading #research #investing #tradingalgos #tradingsignals #cycles #fibonacci #elliotwave #modelingsystems #stocks #bitcoin #btcusd #cryptos #spy #gold #nq #investing #trading #spytrading #spymarket #tradingmarket #stockmarket #silver

Vanguard Mega Cap Growth ETF (MGK): FAQ guide before investing🚀 Vanguard Mega Cap Growth ETF (MGK): A Deep Dive into Holdings and Hypothetical Returns
🌟 The Vanguard Mega Cap Growth ETF (MGK) is a popular exchange-traded fund offering investors access to some of the largest and most dynamic growth-oriented companies in the U.S. market. MGK closely tracks the CRSP US Mega Cap Growth Index, emphasizing mega-cap stocks.
🎯 Key Features of MGK
💰 Expense Ratio: 0.07%, a cost-effective choice for investors.
📊 Assets Under Management: Around $25.42 billion.
💵 Dividend Yield: 0.44%, distributed quarterly.
🏆 Top Holdings:
🍎 Apple Inc. (AAPL): 14.34%
🖥️ Microsoft Corp. (MSFT): 11.93%
🎮 NVIDIA Corp. (NVDA): 10.70%
📦 Amazon.com Inc. (AMZN): 7.63%
📱 Meta Platforms Inc. (META): 4.33%
🔌 Broadcom Inc. (AVGO): 3.54%
🚗 Tesla Inc. (TSLA): 3.22%
💊 Eli Lilly and Co. (LLY): 3.20%
💳 Visa Inc. (V): 2.76%
🔍 Alphabet Inc. (GOOGL): 2.31%
📌 Sector Allocation:
💻 Technology: ~52.8%
🛒 Consumer Discretionary: 15.9%
📡 Communication Services: 11.0%
📈 Performance Overview
MGK has consistently demonstrated strong returns:
🗓️ Year-to-Date (YTD): 0.96%
📅 1-Year Return: ~21.09%
📆 3-Year Return: ~23.26%
📊 5-Year Return: ~19.26%
💸 Hypothetical Investment Scenarios
Assuming an average annual return of 19.26%, here's how various investments might grow over five years:
💲 $10,000 Investment:
Year 1: $11,926
Year 2: $14,219
Year 3: $16,951
Year 4: $20,207
Year 5: $24,070
💲 $100,000 Investment:
Year 1: $119,260
Year 2: $142,190
Year 3: $169,510
Year 4: $202,070
Year 5: $240,700
💲 $1,000,000 Investment:
Year 1: $1,192,600
Year 2: $1,421,900
Year 3: $1,695,100
Year 4: $2,020,700
Year 5: $2,407,000
⚠️ Note: These returns are hypothetical and assume consistent annual performance, which may not reflect actual market volatility.
🔑 Considerations for Investors
🎯 Concentration Risk: MGK heavily invests in technology and a few major stocks, tying its success closely to these specific companies.
📉 Market Volatility: Although historically strong, MGK can be highly volatile, particularly during tech-sector downturns.
📈 Long-Term Growth: Ideal for investors seeking significant long-term capital appreciation through prominent U.S. growth firms.
📌 In Summary: MGK provides focused exposure to U.S. mega-cap growth stocks with a strong track record. Investors should consider portfolio diversification carefully due to its sector concentration.
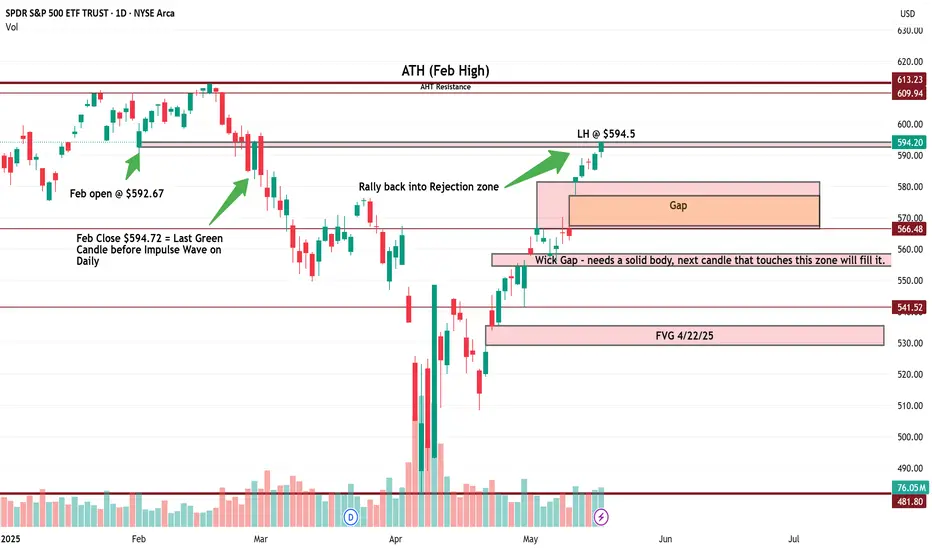
$SPY Daily Chart Taz Plan - May 2025 into June-July Breakdown📉 SPY Daily Chart Trading Plan — May 2025
Thesis:
Price has returned to the exact level ($594.20) where the February impulse breakdown began. This zone is acting as a Lower High rejection within a broader bearish structure. A clean rejection here opens the door to multiple inefficiency fills below.
🔍 Structure Breakdown:
Feb High (ATH): $613.23
Feb Open: $592.67
Feb Close (last green candle before impulse): $594.20
Current Price: $594.20
Marked LH: $592.50
This is a rally back into rejection, not strength.
📉 Key Zones & Gaps:
🔺 Gap Supply: $566.48 – $578.50
🔺 Wick Gap: $558 – $566 → Needs a full-body candle to initiate fill
🟥 FVG (4/22): $528 – $541.52
🧱 Major Support: $481.80
🧠 Trade Plan:
Short Entry 1 (Confirmation-Based):
🔻 Red candle rejection under $592.50 = starter short
🔻 Watch RSI and MACD for momentum fade
Short Entry 2 (Gap Breach):
🔻 If $578 is broken and retested → scale in
🔻 Gap fill expected quickly once triggered
Short Entry 3 (Wick Gap):
🔻 Body close through $558 = last add
🔻 Sets up for final flush to FVG
🎯 Targets:
$578.50 → $566.48 (Gap Fill)
$558 → $541.52 (Wick Gap & FVG Top)
$528 – $530 (FVG Close)
$481.80 (Long-Term Panic Target)
❌ Invalidation:
Daily close > $595.50 = Pause thesis
Weekly close > $600 = Structural shift, short squeeze zone
🧠 Final Thoughts:
This isn’t just a gap fill play — it’s a structural fade from a lower high back into memory. The Feb impulse wave left behind layers of inefficiency, and price just tapped the origin of the breakdown.
Momentum is peaking. If this is a trap, the downside should begin immediately.
Let the chart prove it.
US Downgrade, 3-5-10% Pullbacks But Still Bullish on S&PHappy Sunday!!!
US Futures open lower after Friday's close and Moody's downgrade.
Last time this occurred in 2011, the S&P dropped around 10% from the "news."
This is all interesting timing but I'm still liking pullbacks for opportunities to position
bullish in the US indexes (S&P, Nasdaq, Dow)
Because the melt-up continues to run (US/China gap last week and drift higher), I'm trying to stay patient for a pause or pullback
Trump and Bessent are still chirping about Tariffs and a government "detox" so a round of trade war related news may help calm the market's red hot advance post April 7 lows
I'm selling calls on owned positions for income. I'm waiting for more favorable levels to add new positions, but within 3-4% of all time highs for the S&P and Nasdaq I don't think anybody will be surprised to see the all-time highs revisited in the near to medium-term
Let's have a great week - thanks for watching!!!
-Chris Pulver

SPY WEEKLY 19TH-23RD MAY 2025Welcome to Spy weekly. I have tried to explain the price action & all-important levels in the best possible way but still if you have doubts then feel free to leave a comment below.
NOTE: WE ARE IN BULL RUN

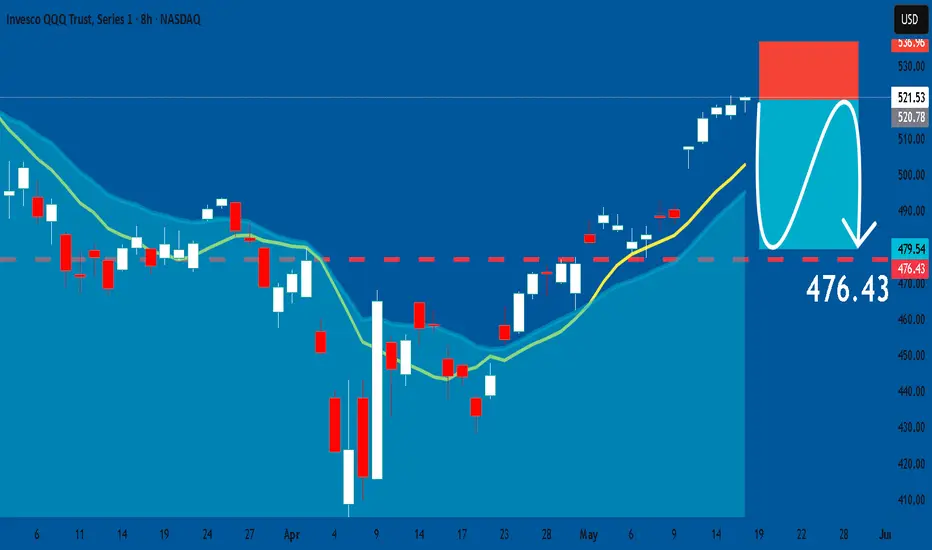
QQQ: Bearish Continuation & Short Trade
QQQ
- Classic bearish pattern
- Our team expects retracement
SUGGESTED TRADE:
Swing Trade
Sell QQQ
Entry - 521.53
Stop - 536.96
Take - 476.43
Our Risk - 1%
Start protection of your profits from lower levels
Disclosure: I am part of Trade Nation's Influencer program and receive a monthly fee for using their TradingView charts in my analysis.
❤️ Please, support our work with like & comment! ❤️
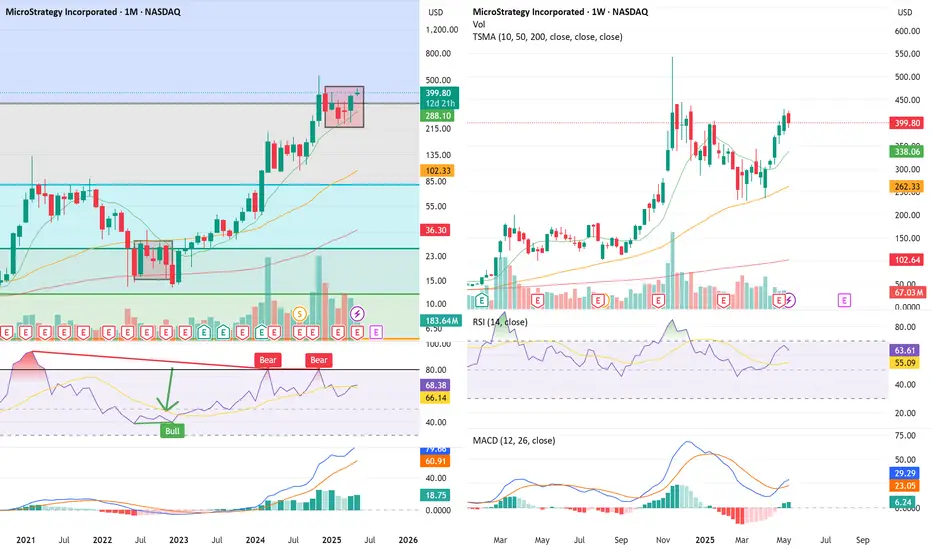
$MSTR Monthly Top Form: “Backwards 4” + Multi-TF RSI DivergenceBefore we begin... trading view is restricting my post for an indicator.. maybe someone reported it... not sure... doesn't seem like a problem... it's a TD Sequential ...
🔍 The Setup — Monthly “Backwards 4” Pattern + Multi-Timeframe Breakdown
We’re now forming the 5th candle in what I call the “Backwards 4” formation, or the upside-down lowercase ‘h’ — a recurring reversal structure I’ve tracked at macro tops.
Structure breakdown:
✅ Strong monthly green candle
2–3. 🔻 Two red candles that retrace the body but don’t break it
✅ A second green candle that re-tests the highs and baits breakout buyers
❌ Final candle closes red → confirms exhaustion → multi-month drawdown begins
We saw this exact setup in early 2021 before MSTR collapsed from $1,000+ to $134. The pattern is now repeating — but this time it’s backed by RSI + MACD divergences on all major timeframes.
📊 Multi-Timeframe Technical Breakdown
📆 Monthly
Inside the “Backwards 4” zone now (candle 5)
RSI Bear Divergence: price made new highs but RSI keeps printing lower highs
MACD flattening after extended expansion
Volume fading for 3 months straight
📌 Momentum is dying while price floats. That’s not strength — that’s late-cycle distribution.
📆 Weekly
TD9 printed this week at the top of a tight 5-month box
RSI rejected at 63.61 — exact same rejection level as last cycle highs
MACD histogram curling while price stayed flat
Range: ~$338–$430 → energy has been spent
📌 This isn’t breakout behavior — it’s a liquidity trap.
📆 Daily
Double top attempt failed at $406
MACD crossed bearish, histogram turning red
RSI Bear Divergence Confirmed:
Price made higher highs from April to May
RSI made lower highs, tagging 66.90 vs. 74.70 earlier this year
📌 Daily has now logged 3 bearish RSI divergence peaks since February.
📋 Trading Plan (as of May 17, 2025)
Position: No current short — stalking ideal entry
Entry Zone: $406–$410 rejection zone (upper box resistance)
Trigger: Daily close under $390 confirms failed breakout
Add Confirmation: Weekly close under $375 = trend shift
Stop: Above $430 monthly high (invalidates breakout fade)
Target 1: $320–$290 (May red close zone)
Target 2: $262 (range midpoint / fib retrace)
Target 3: $240 (prior base support)
Stretch Targets: $175 and $102 if macro breaks down
Waiting for clean structure breakdown before initiating core position. This is a setup worth being early but precise on.
🧠 Final Thoughts:
This is one of my highest conviction macro top setups.
The “Backwards 4” is showing up again with RSI and MACD fading across the board. Price is floating under resistance on weakening momentum, and volume confirms it.
If May closes red, we likely begin a multi-month correction.
I’m watching for the breakdown trigger under $390 to begin building short exposure, targeting sub-$300 by month-end and lower into summer if momentum continues to unwind.
📉📦 Let’s see how it finishes.
Stock Market Forecast | TSLA NVDA AAPL AMZN META MSFTStock Market Forecast | CME_MINI:NQ1! NASDAQ:QQQ AMEX:SPY CME_MINI:ES1!
Mag 7 Forecast | TSLA NVDA AAPL AMZN META MSFT GOOGL

Bullish Semiconductors? SOXX The semiconductors NASDAQ:SOXX definitely tend to lead the market In bull rallies. I still think this saying will hold true for several years.
The NASDAQ:SOXX is flirting with some pretty decent resistance. This would be a perfect spot for sellers to exit and price action to digest recent gains.
If the chart plays out like I think it will, we should have a decent pullback in this area which could create an epic inverse head right shoulder. This pattern would be a very bullish setup that could take us into new All Time Highs in 2026.
This is a weekly pattern so allow the chart some tike to play out.

+10% from tomorrow till mid-MaySPX is getting ready to rebound with around 10% till mid-May. Invalidated if breaks below 5400.

SPY/QQQ Plan Your Trade For 5-16 : Gap Potential PatternToday's pattern suggests the SPY will attempt to GAP at the open. The current price structure suggests the SPY/QQQ are in an upward FLAGGING formation related to a broad Excess Phase Peak pattern. I believe this upward trend will continue until price attempts to break either the upper previous Ultimate High pattern or break the lower channel of the current FLAGGING formation.
The wonderful thing about these Excess Phase Peak patterns, and other techniques I'm trying to teach you, is that they provide very clear triggers/directions/opportunities for traders who understand these patterns.
Today, I highlight my SPY Bias (Primary & Secondary) trending system that shows the SPY is much weaker than many people believe. Because of this, I believe we are potentially nearing an Exhaustion Peak in the SPY/QQQ - time will tell.
The use of my extended Biasing systems and Custom Index charts helps me understand what is taking place behind the SPY/QQQ price action. It's like peaking behind the curtains in terms of what my Custom Indexes and other specialized data can provide. I can see what is really taking place related to price action - moving beyond the simple SPY/QQQ charts.
Gold and Silver appear to be setting up an Inverted Excess Phase Peak pattern off a potential Ultimate Low in price. It will be interesting to see how this downward price flag plays out over the next week+. If this pattern holds, we should see the FLAG end and price should rally up into the consolidation phase. Very exciting for metals.
Bitcoin, which tends to lead the SPY/QQQ, is stalling near a peak. Keep your eyes on BTCUSD over the weekend as I believe we may be able to identify how the SPY/QQQ will react on Monday by watching what BTCUSD does.
Thanks for being patient and understanding my schedule over the past 30+ days. I've had multiple family member visit the hospital over the past 5-6+ weeks and my world has been filled with doctors, hospitals, follow-ups, work, and trying to keep everyone healthy and away from trouble.
It appears these issues are starting to get more settled - which means I'll be able to stay more focused on work - instead of driving around everywhere and waiting for appointments.
Get some..
#trading #research #investing #tradingalgos #tradingsignals #cycles #fibonacci #elliotwave #modelingsystems #stocks #bitcoin #btcusd #cryptos #spy #gold #nq #investing #trading #spytrading #spymarket #tradingmarket #stockmarket #silver
