QQQ LEAP Trade Thesis – Aug 1, 2025
🧠 **QQQ LEAP Trade Thesis – Aug 1, 2025**
🎯 **Setup**: High-conviction LEAP PUT
📉 **Bias**: 🔻 *Moderate Bearish*
📆 Horizon: Long-Term (12+ months)
---
📊 **Multi-Model Intelligence Summary**
🧪 **Grok (xAI)**
• Monthly RSI = bearish 📉
• Trading near 52W highs = overvalued 💥
• Suggests: \$545 PUT
🧠 **Gemini (Google)**
• High conviction bearish
• Suggests: \$590 PUT (expensive premium)
🧬 **Claude (Anthropic)**
• RSI breakdown = confirmed weakness
• Recommends: \$530 PUT for max downside
🦾 **Meta (LLaMA)**
• Moving averages turning over
• Suggests: \$555 PUT – moderate confidence
🛰️ **DeepSeek**
• Long-term RSI confirms bearish drift
• Volatility ideal for LEAP entries
• Recommends: \$545 PUT
---
📍**MODEL CONSENSUS**
✅ Bearish trend across all models
✅ Favorable volatility (VIX ✅)
✅ Overvaluation = downside pressure
⚠️ Strike variance across models → we anchor at **\$545** for balance
---
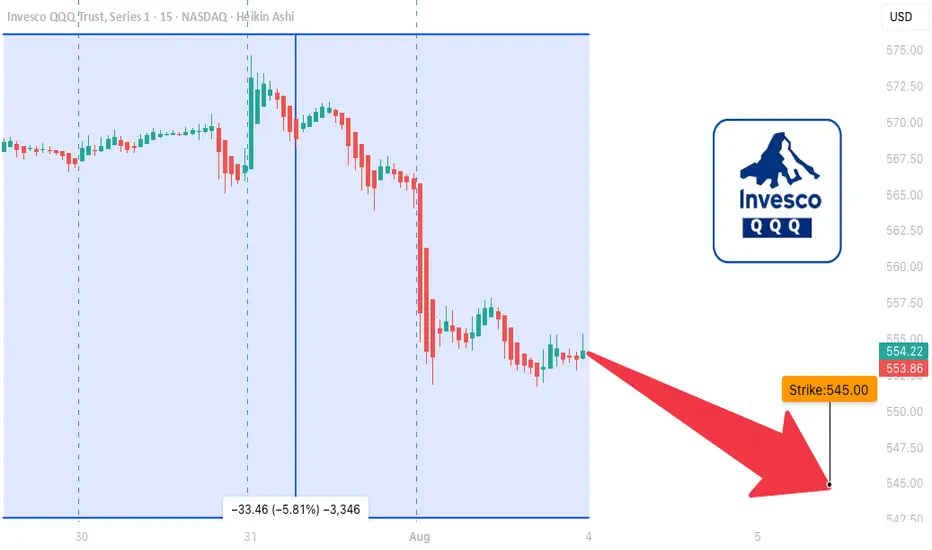
💼 **TRADE SETUP (LEAP PUT)**
• 🔻 Direction: PUT (Short)
• 🎯 Strike: **\$545**
• 📆 Expiry: **2026-09-18** (413 days)
• 💰 Entry Price: **\$38.33**
• 🎯 Target: **\$76.66**
• 🛑 Stop: **\$24.91**
• ✅ Confidence: **75%**
• ⏰ Entry: Monday Open
• 📏 Size: 1 contract
---
📌 **Narrative**:
Every model says the same thing: RSI rollover, inflated price, and perfect LEAP conditions. Institutions are neutral → retail can front-run the decay. You don’t often get long-dated PUTs this clean.
🎯 Asymmetric risk/reward.
📉 Macro setup aligns.
🎯 Strong long-term positioning play.
---
🧠 Stay smart. Position early. Ride the macro shift.
🔔 Like + Follow for more AI-driven trade setups.
Qqqanalysis
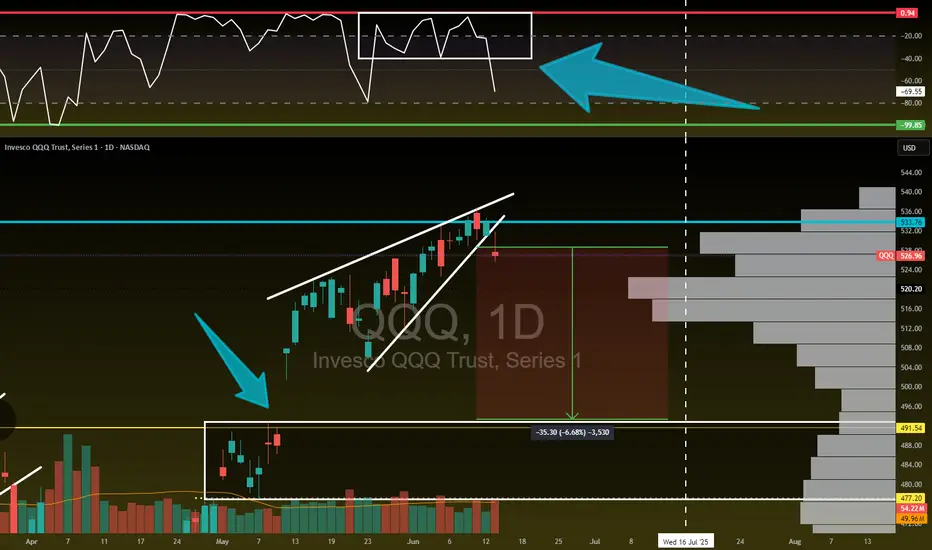
Bears Intensify... $QQQ - Pullback LikelyBears Intensify... NASDAQ:QQQ
🐻 Falling Wedge Breakdown
🐻 Hammer Candle
🐻 Bearish Wr%
🐻 H5 Flow Increasing
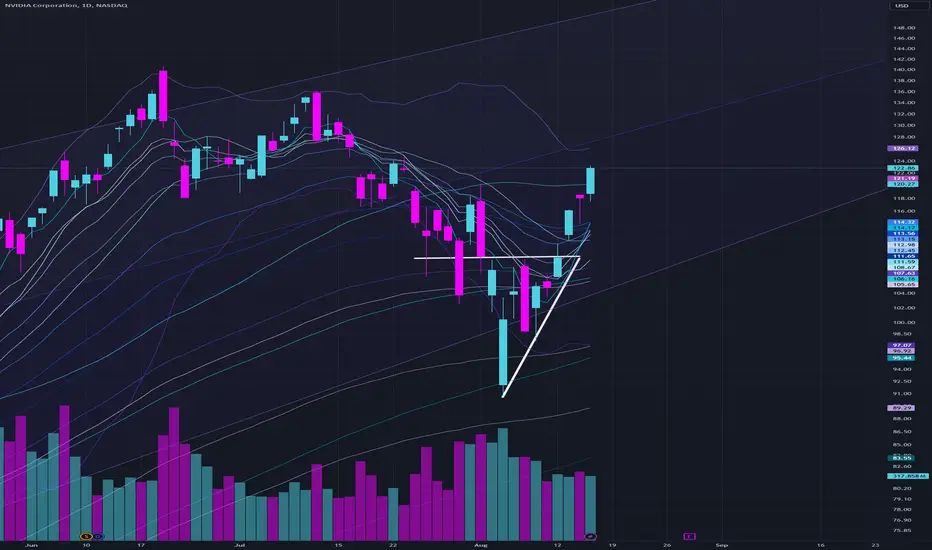
NVDA reclaimed the daily 50 SMA along with QQQ.NASDAQ:NVDA broke out of a wedge consolidation at $109 earlier this week and has closed above the daily 50 SMA, along with NASDAQ:QQQ and many other technology leaders. There has been a shift in market tone since the jobs report last Thursday, 8/8. Since then, all data points have been bought by the bulls, and QQQ reclaimed the daily 10 SMA, giving signs that the bull-thesis was valid. The longer QQQ and other major technology names build above the daily 50 SMA, the more likely they are to continue higher.
Nasdaq 100 ETF (QQQ) ~ December 4H SwingNASDAQ:QQQ chart analysis/mapping.
QQQ ETF in consolidation phase after strong November rally.
Trading scenarios:
Further consolidation = descending trend-line (light blue) / multiple EMA confluence zone.
Continuation rally #1 = top range of Fib / ascending trend-line (green) confluence zone.
Shallow pullback #1 = 78.6% Fib / 200MA confluence zone.
Shallow pullback #2 = descending trend-line (white dotted)\
Deeper pullback #1 = gap fill / ascending trend-line (green) / Golden Pocket confluence zone.
Capitulation #1 = 50% Fib
Capitulation #2 = 38.2% Fib / gap fill / ascending trend-line (light blue) confluence zone.
Capitulation #3 = 23.6% Fib

Is QQQ Preparing To New All-time High???Technical Analysis:
- There is very possible once AAPL and MSFT as a bullish structure in weekly timeframe
- H1 right side is turning down
- H4 right side is up
Technical Information:
- Don't sell QQQ and you can buy in next days around 360
