QTUM/USDT - Potential 200%+ SetupHello Traders!
QTUM completes the drop phase approaching the zone of interest of buyers $2.66 - $5.00
It is possible to look for medium-term purchases closer to support levels of $3.79 and $2.66
In case the price of the asset will go below $2.20, the position should be closed using a stop loss.
The targets for medium-term purchases will be price levels of $7.32 $11.20 and $14.19
Good luck and watch out for the market
P.S. This is an educational analysis that shall not be considered financial advice
Qtumusdt

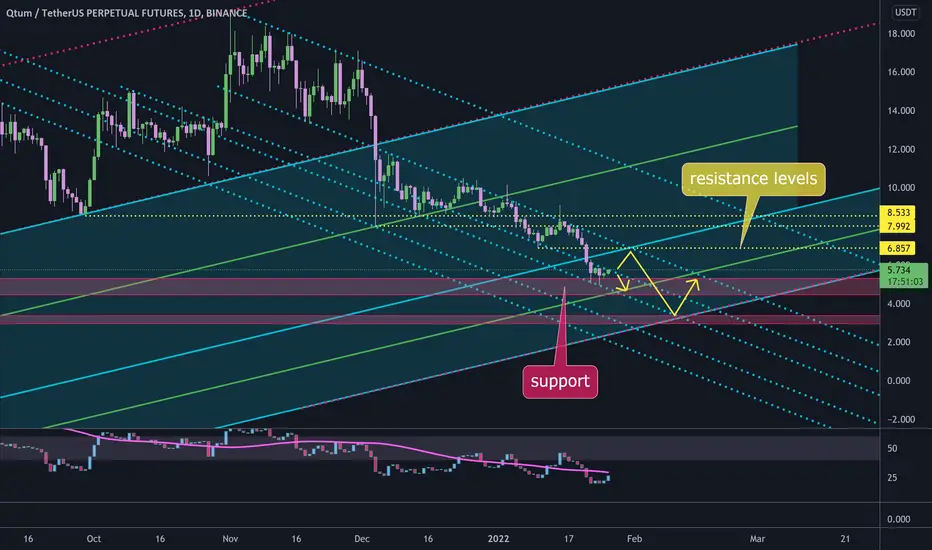
QTUMUSDT - SETUPQTUMUSDT price has a good bounce from the critical support zone now price is trying to break that trendline resistance and showing the bull's strength, if they succeed to break the level we could see an upside surge.
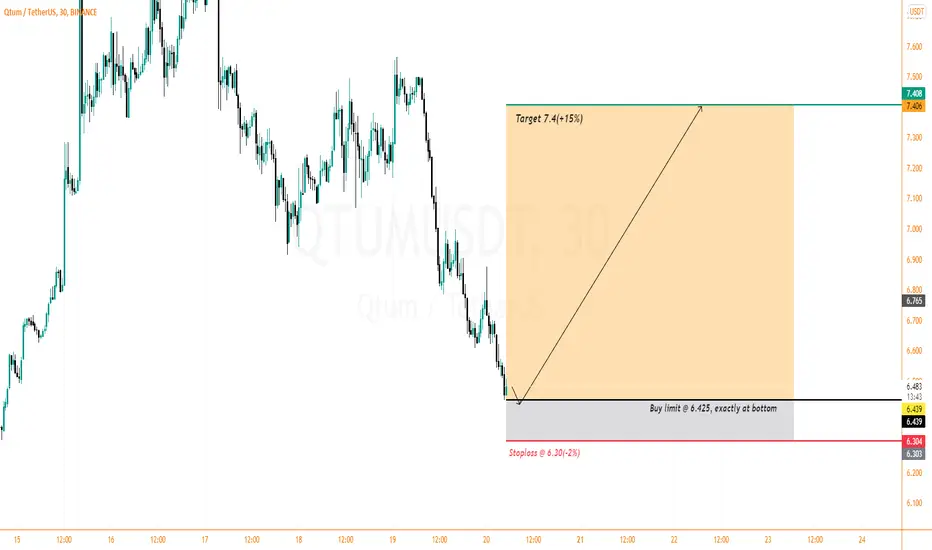
Qtumusdt: Bears are exhaustedHello traders!
Previously it was a beautiful drop for those who knew about the drop congrats to them as I already told you In BTC that the Market is about to fall and that was the peak of this dump. but now it looks like bears are tired and will leave the Market soon. Bulls will jump in exactly from our Buy entry.
The buy entry is at 6.425, it's the bottom of the current low.
Stoploss is at 6.30, it's about -2% of the investment
The target is at 7.4, it's about 15% profit and I will suggest you use 12x leverage.
The target is the first low before the dump and expecting that market will hit it now. The target is about 1:7 so it will be a great trade.
Don't forget to hit the like button and follow to stay connected
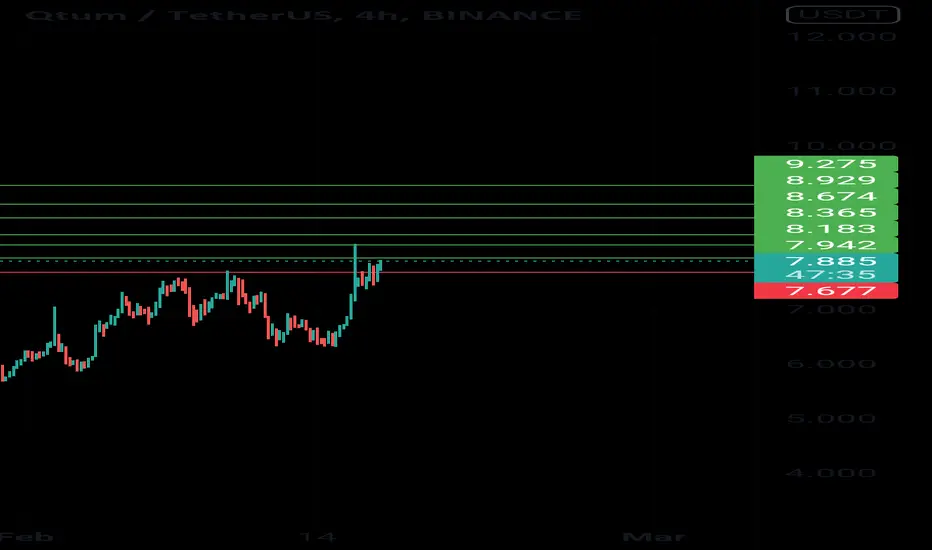
QTUM is one of the best performing coins right nowCompared to most coins, QTUM has established an uptrend on a 4h chart. Besides, price continues to respect the uptrend trendline, thus bulls are defending each support. Such price action favors a strong rally to the upside in the coming days.

Qutm breaking the resistance _ scalpHello
Qutm breaking the resistance on 4h chart
Targets on the chart
Sl red line
Gl
QTUM- 23% Higher Since Our postIt was the first time we posted about QTUM and it was PERFECT!
I guess we know how to read a chart when we see it.
One Love,
the FXPROFESSOR

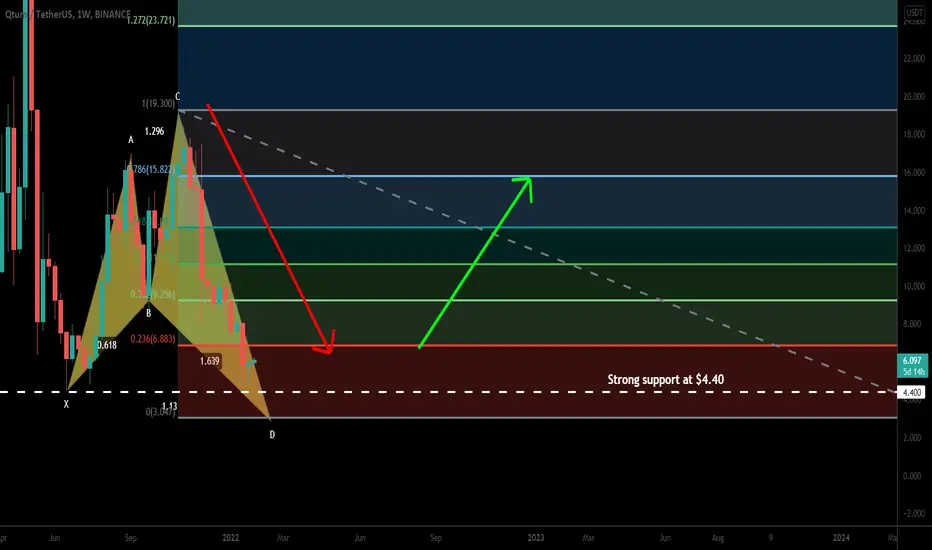
QTUM formed a big bullish Shark for upto 258% pumpHi dear friends, hope you are well and welcome to the new trade setup of QTUM coin.
During the previous market crash, QTUM formed a big bullish Cypher which I shared as below:
Now during the current drop,QTUM has formed a big bullish Shark, on a weekly time frame. Right now after completing the final leg, the priceline has moved up, therefore, we can wait for some correction to buy it from the potential reversal zone.
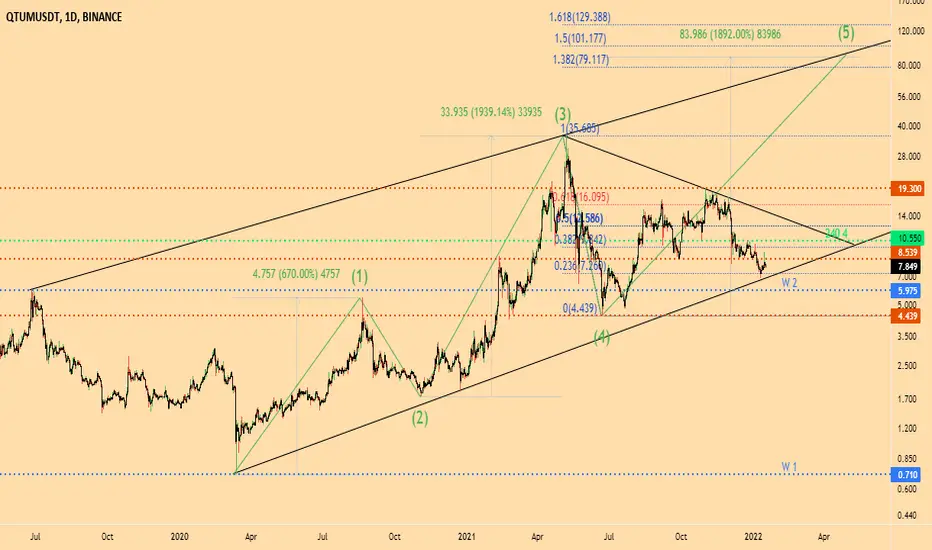
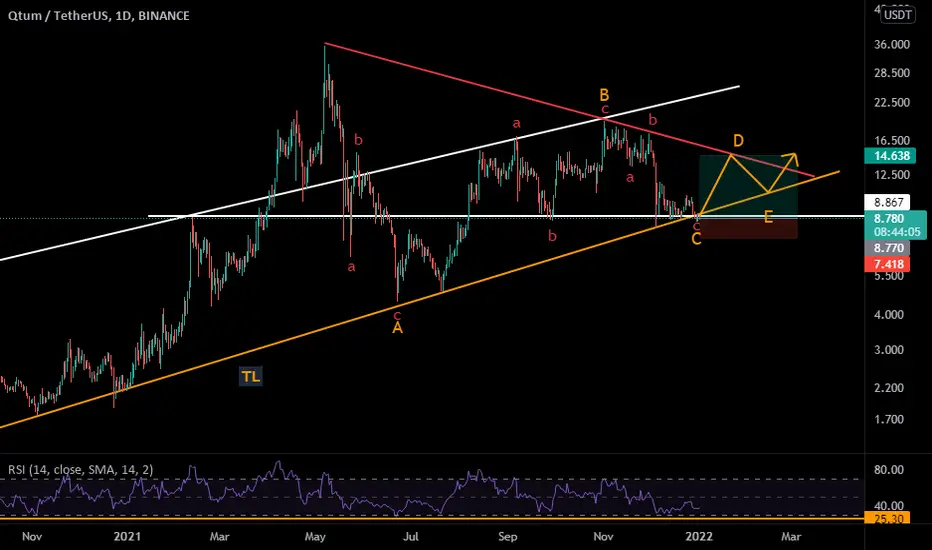
I BOUGHT MORE QTUM (POTENTIAL 10X PLAY)Welcome back to our QTUM analysis Series
In our first analysis, we pointed out buying zones for a potential bottom as shown in the chart below
A month later we updated that idea after a few buyng zones were met
Now in this analysis, we are analyzing afresh, with a different view.
In our two previous analysis, we drew 2 trendlines that price continued to respect, as shown below
Now resting the last trend support which was created when the overall impulse move was initiated, we can see that we are currently in a channel, one which has a target of at least $80-100 dollars depending on how soon we test resistance again, and aligns with our 5th wave top coming in at the 1.382-1.618 fib resistance eventually.
Previous ideas are linked below.
Added in another trendline running across the chart for a potential rejection and a take-profit zone. That way, we can have the growth of wave 5 and 1 almost equal or closely related if we don't get $80, even though it would still technically be shorter than wave 3
Should Bitcoin decide this isn't it's bottom and take another dive, we will most likely retest the $4 support before a move to the upside.
If you agree with this, pls leave a like and your thoughts in the comments section.
As always, feedback is appreciated.
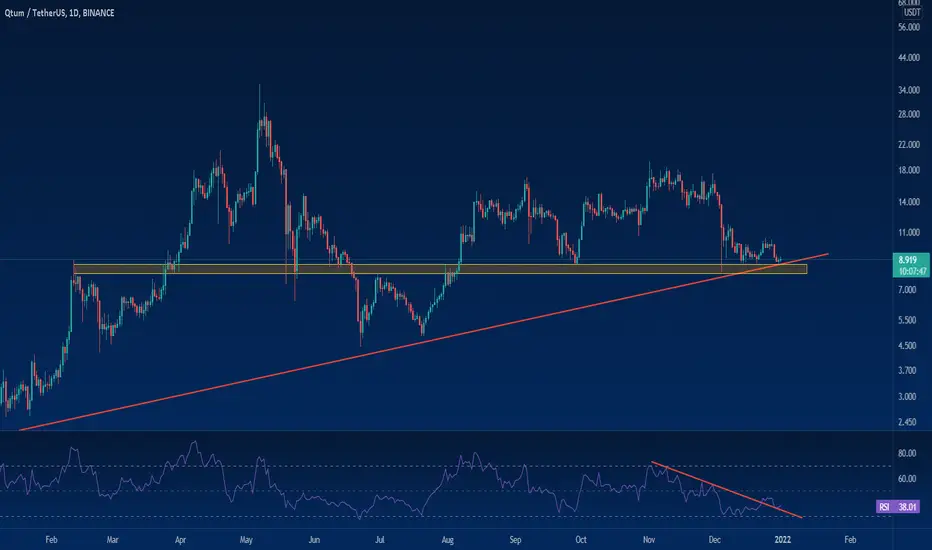
QTUM trend lines#QTUM/USDT
$QTUM trend lines show that if price success to break out from current descending trend line it will head up to resistance of $6.85 as a pullback then drop to support zone around $3
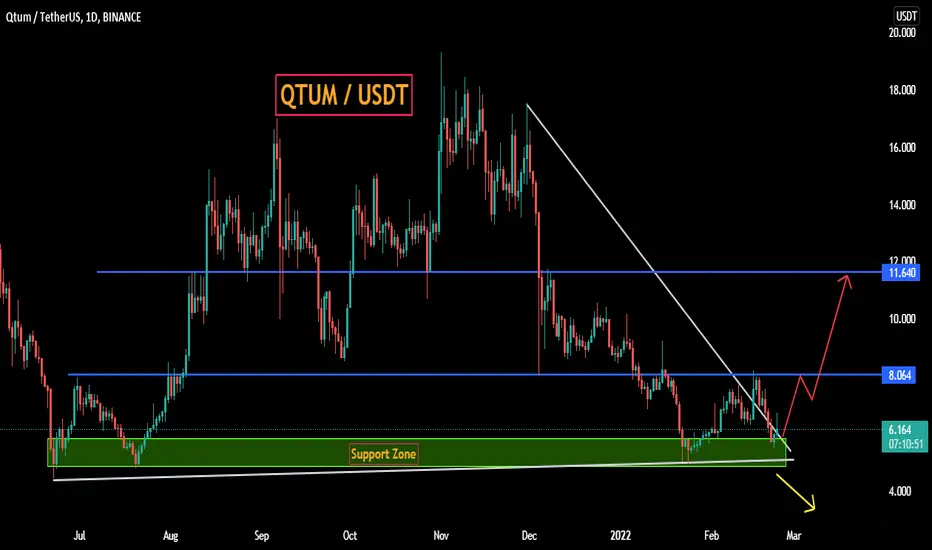
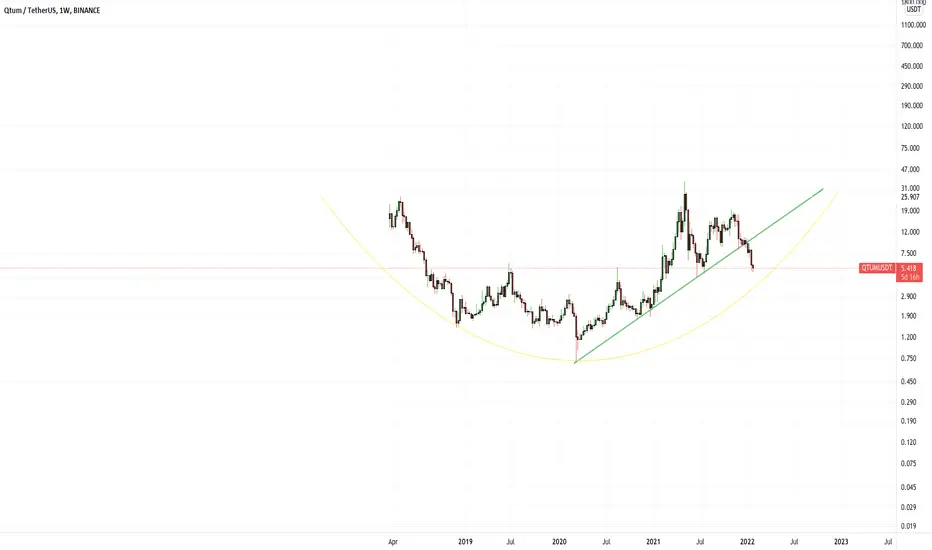
QTUM/USDT 1W. Huge cup.Qtum/usdt 1w. Big cup is forming. Price broke down the upside trendline(green), after that bottomed to the support of this big cup. Potential reversal zone.
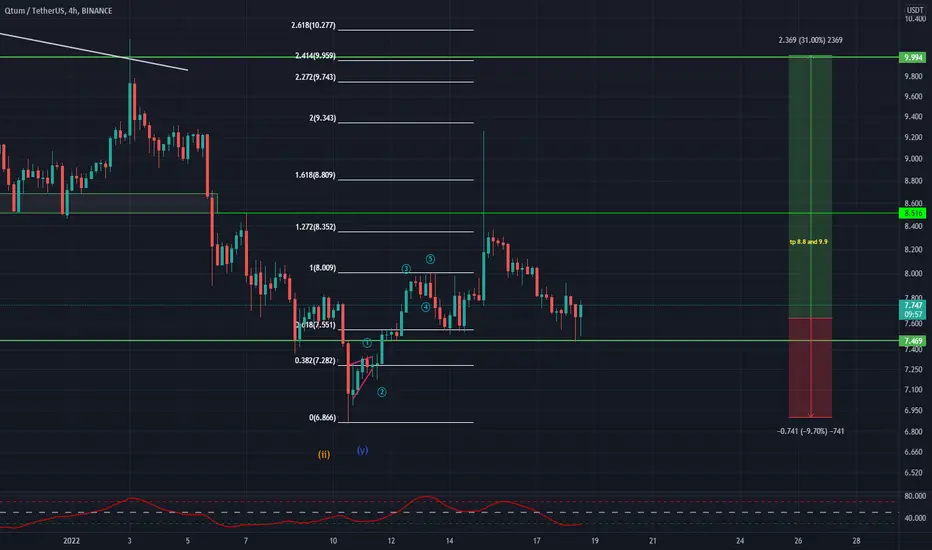
QTUMUSDT Analysis (LOCAL VISION)Hello friends.
Please support my work by clicking the LIKE button👍(If you liked). Also i will appreciate for ur activity. Thank you!
Everything on the chart.
Entry: market and lower
Target: 8.8 and 9.9
after first target reached move ur stop to breakeven
Stop: under 6.9 (depending of ur risk). ALWAYS follow ur RM .
Risk/Reward: 1 to 3
risk is justified
Good luck everyone!
Follow me on TRADINGView, if you don't want to miss my next analysis or signals.
It's not financial advice.
Dont Forget, always make your own research before to trade my ideas!
Open to any questions and suggestions.
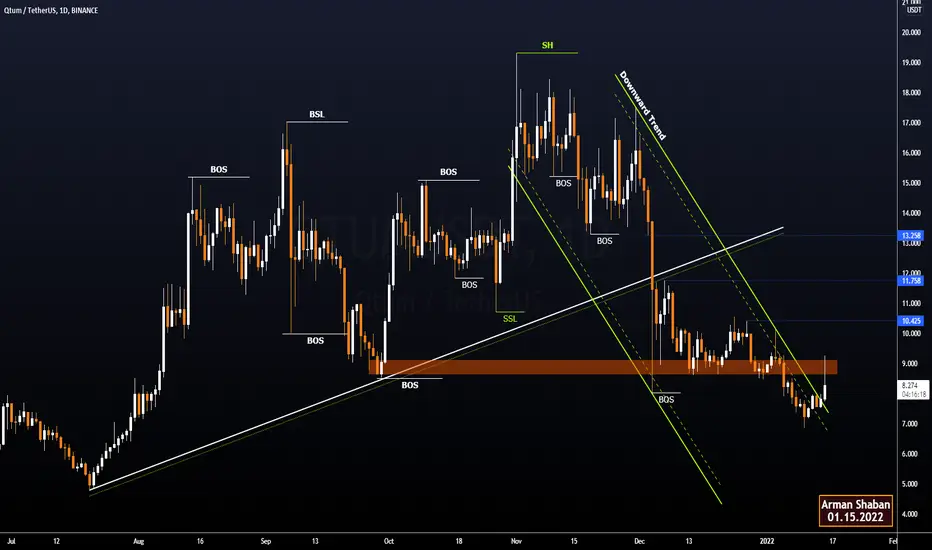
QTUM Daily TA : 01.15.22 : $QTUMAll supports and resistances are marked on the chart. As we can see, the price is in an important range and recommended to keep an eye on it ...
Follow our other analysis & Feel free to ask any questions you have, we are here to help.
⚠️ This Analysis will be updated ...
👤 Arman Shaban : @ArmanShabanTrading
📅 15.Jan.22
⚠️(DYOR)
❤️ If you apperciate my work , Please like and comment , It Keeps me motivated to do better ❤️
QTUMUSDT - LONG - Short TermQTUM READY TO Take Profit - Target Obvious on the chart - Set Your Stoploss , Do it with your Own Risk
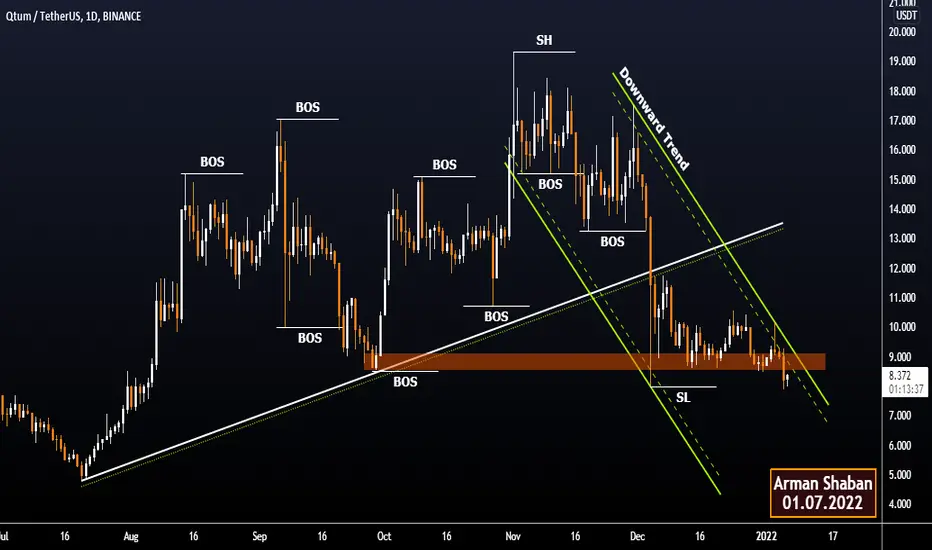
QTUMUSDT 1D TA : 01.07.22 : $QTUMAll supports and resistances are marked on the chart. As we can see, the price is in an important range and recommended to keep an eye on it ...
Follow our other analysis & Feel free to ask any questions you have, we are here to help.
⚠️ This Analysis will be updated ...
👤 Arman Shaban : @ArmanShabanTrading
📅 07.Jan.22
⚠️(DYOR)
❤️ If you apperciate my work , Please like and comment , It Keeps me motivated to do better ❤️
bulls need to hold this pattern! next target is $14 Qtum has been supported by the indicated huge ascending parallel channel which is from 14, Mar 20.
As we confirm the channel bottom line support, it beautifully bounced back and penetrate the Ichimoku cloud and brings us bullish price action.
So how about this time? well, the RSI bottomed pretty much similar to what has been happening those oragin rectangle .
Now the next question is whether we can expect the increasing volume coming in to next target $14.04, which is the descending parallel channel resistence line and fibonacci retracement & expected Ichimoku cloud breakout target.
before go long, let's see how the ascending parallel channel support works or not.
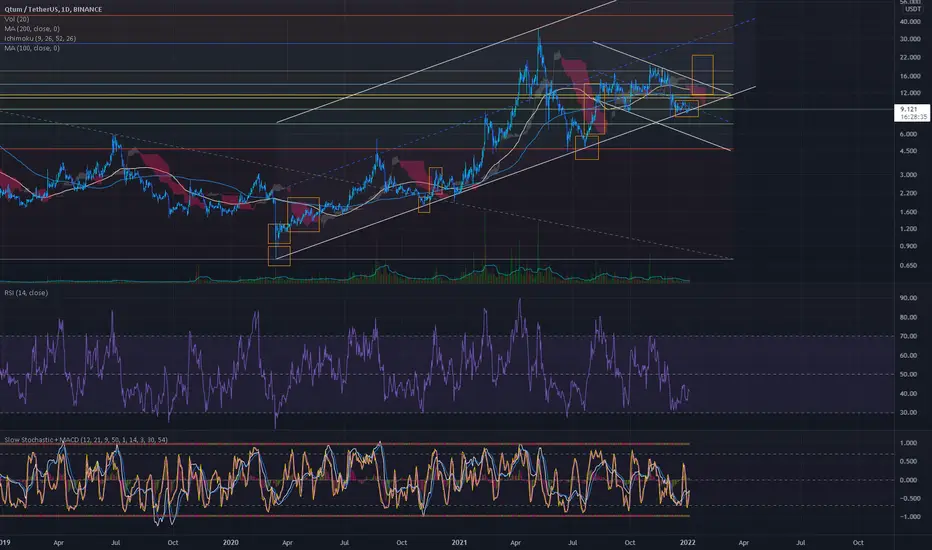
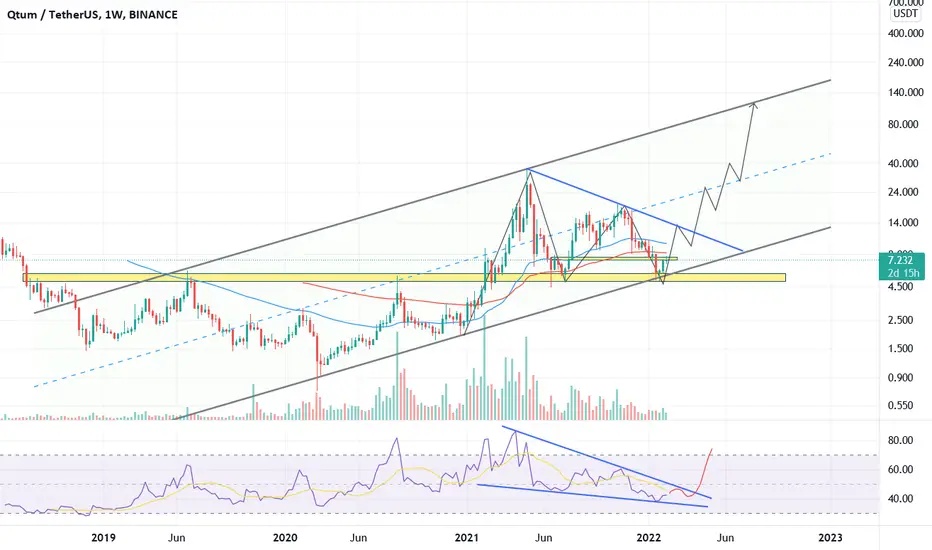
QTUM at its core (up and down at the same time...?)QTUM has been trading inside this channel since the market drop in May 2021. It is now trading near one of its support zones. Over the next few weeks, QTUM will approach its long-term resistance (black line) which it has tested and failed to break over the past few months. This has resulted in the pair trading below the 100 and 200 day MA. It is overall bearish in the short-term until it can prove otherwise.
QTUM's long-term support is currently holding and this idea is that the price could rise and break out of its resistance pushing toward the top of the channel. However, if this support does not hold (most likely due to a breakdown in the price of BTC) it could test the second support at ~5.46 which may be an even stronger entry point with a good return.
Please note I am not a financial advisor and this is not financial advice. All ideas are for educational purposes only! :)

QTUM on trend line | Jan 1, 2022Price just hit the trend line and static support at the same time
This is a support area which you can consider as a buy zone
The price moves in a triangle
Qtum next move can be like this
So this is an opportunity but use stop loss, in case this support area broke
Consider Bitcoin situation before or during your investments
QTUM bullish ideaCan it be bullish ?
Maybe yes, it has dropped 44% in the last 30 days .
If BTC does not fall, QTUM should be hoped for .
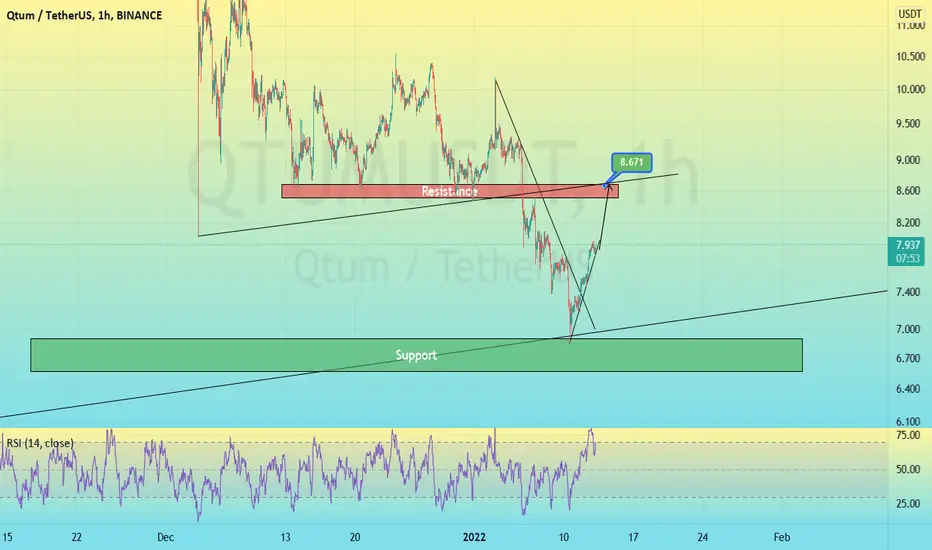
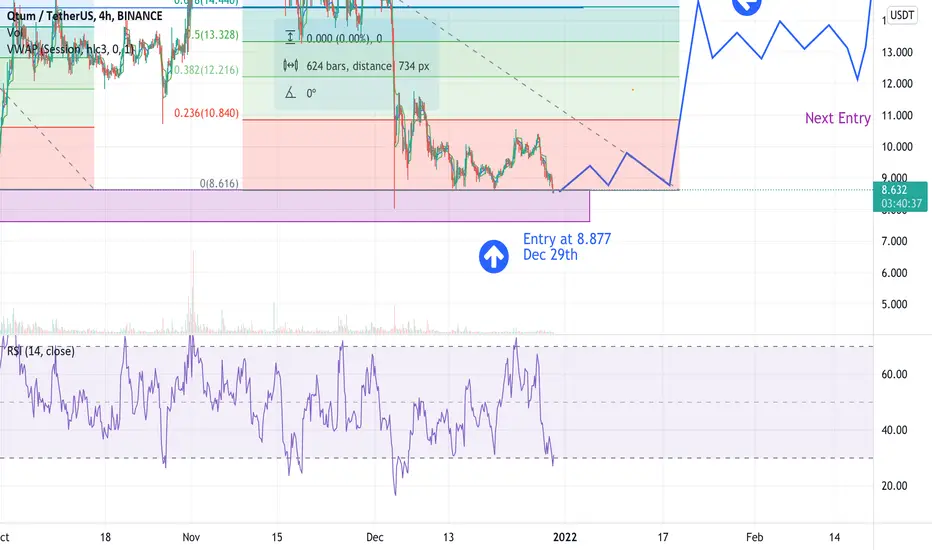
2 ideas for entry and exit on QTUMBased on technical analysis there are two nearby zones of entry and exit. Fibonacci retracement at level 0.618 seems to be a good target zone for the QTUM USDT pair. This pair seems to move in a very distinctive pattern of plateau, rise, plateau, dive and so on.
Entry 1 @ 8.877 - 8.670 (hits a major support level)
Target Exit 1 @ 14.440 (coincides with another resistance level)
Entry 2 @ 12.050
Target Exit 2 @ 18.020
These values have to be monitored as time passes and price develops.
Cheers
Quantum (QTUM) Buy ZoneQuantum (QTUM) Buy Zone
--------------------
BIAS
Mid-Term : Bullish
Long-Term : Bullish
Short term breakout confirmed, The Quantum will touch it's low once again for retest major trendline before moving up.
--------------------
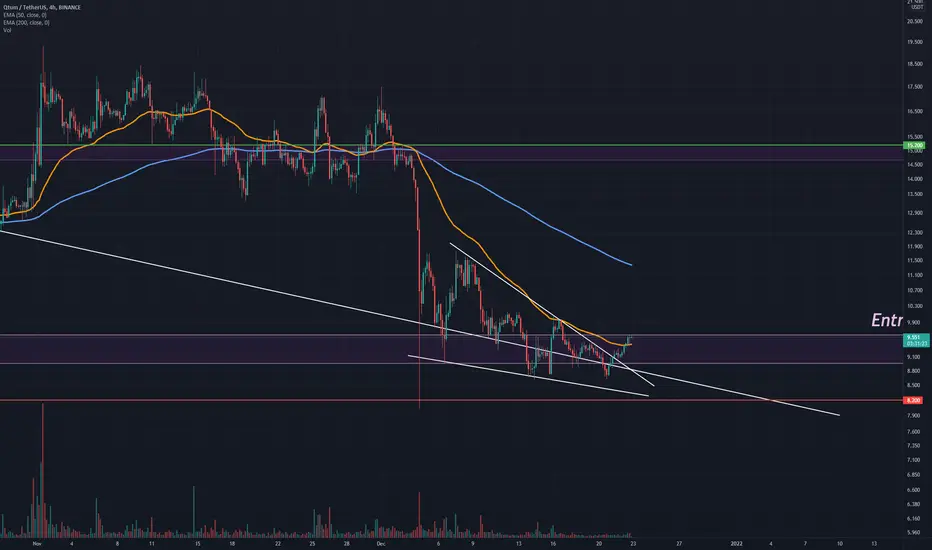
$QTUM/USDT LONG SETUP
Leverage : x3 - x5
Entry Price : 8.95 - 9.6
TP 1 : 9.78
TP 2 : 10.1
TP 3 : 10.64
TP 4 : 11.26
TP 5 : 12.18
TP 6 : 12.949
TP 7 : 14.135
TP 8 : 15.2
Stop Loss : 8.2
*Maximum 3% of Portfolio.
*Unload 12.5% at each TP. Whenever TP 2 hits, Move stop loss to entry.
--------------------
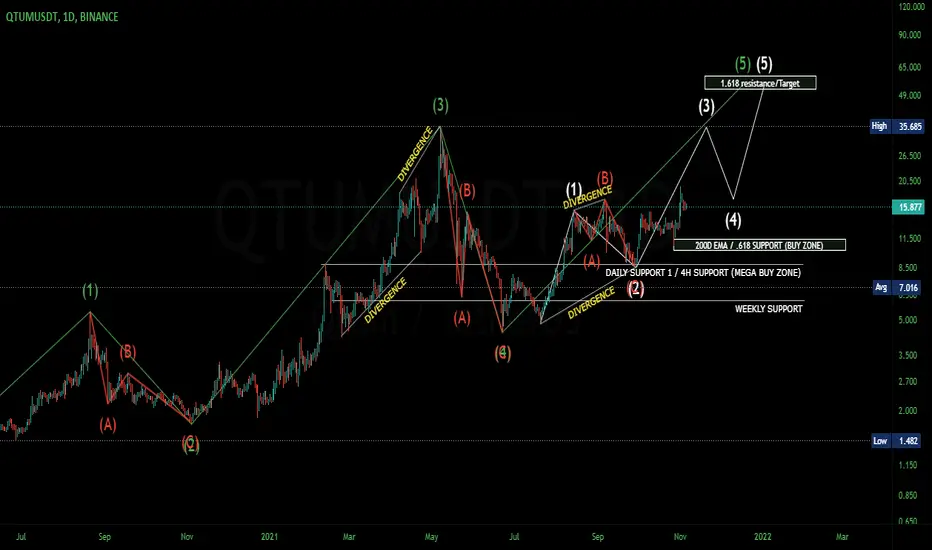
BUYING QTUM HERE FOR POTENTIAL 600%+ GAINSGood day fellow traders. Today we will be looking at the Trading pair QTUM/USDT picking up from were we left off.
In our last/original QTUM idea, We identified potetial buy zones and support areas to cop some tokens for long-term gains
Price has met our Mega buy zone area and we could have seen the end of the wave 2 correction.
Also in line with the Ascending trendline we formed on the start of the smaller degree wave 1(white), its a good area to add to your qtum bag.
You can set some orders below on any of the white horizontal supports and try your luck.
Target for wave 3 is previous ATH as the first target
Global target for wave 5 is $51-$60 as the 2nd target.
As always feedback is appreciated.
Original idea linked below.

QTUM NEW ATH APPROACHING 😜Looking at the Chart, Qtum is in its third Impulsive Wave of the shorter wave count, and in its 5th wave of its longer wave count.
Each with a Target of the 1.618 Fib Resistance around $57 taking us to new ATH's by December/January
A break of the Weekly support would signify break in Market structure and a bear market.
Apply Risk Management.