QTUM/USDT – Make or Break? Testing the Edge of Accumulation?🧠 Overview:
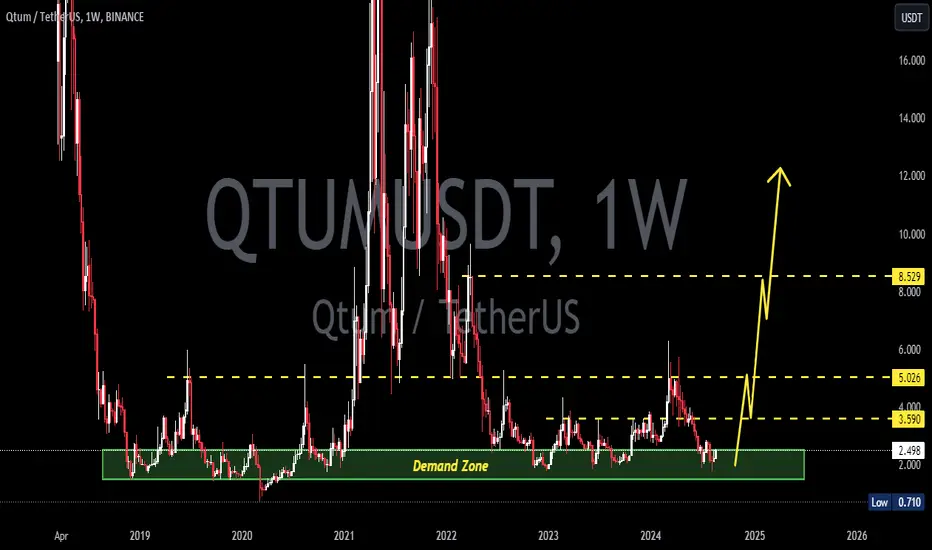
After going through a volatile multi-year cycle, QTUM is now back at one of the most critical historical support zones. This demand area has acted as a strong reversal point multiple times since 2020 and is once again being tested as price consolidates near the bottom of its macro range.
---
📉 Price Structure & Key Levels:
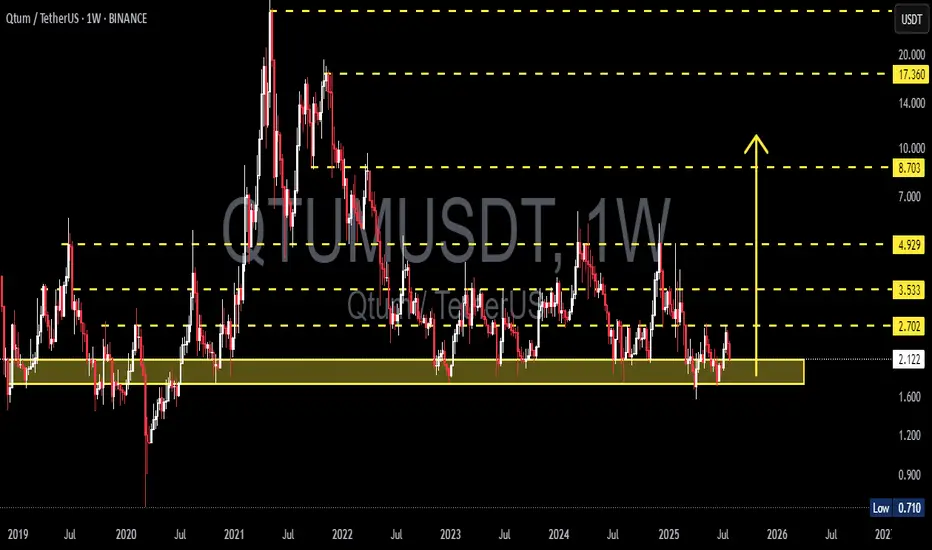
📍 Major Support Zone (1.70 – 2.10 USDT):
A proven accumulation zone based on multiple long wicks and price rejections in the past.
This is where smart money tends to accumulate during market uncertainty.
📍 Layered Resistance Levels (Bullish Targets):
2.70 USDT → Initial breakout validation
3.53 USDT → Mid-range resistance
4.93 USDT → Key structural level
8.70 USDT → Mid-term breakout target
17.36 USDT → Peak from previous macro cycle
---
🧩 Current Pattern: "Sideways Accumulation Range"
QTUM is clearly in a range-bound accumulation phase, with tight price action within a key support area. Historically, such patterns often precede large impulsive moves, especially when accompanied by volume surges and breakouts from structure.
> ⚠️ Important Note: Sideways movement at historical support, combined with increasing accumulation volume, often leads to a breakout into the markup phase.
---
📈 Bullish Scenario: Potential Upside Momentum
Trigger: A confirmed breakout and weekly candle close above 2.70 USDT.
Additional Confirmation: Strong bullish candle with increased volume.
Targets:
3.53 USDT (local resistance)
4.93 USDT (mid-range structural level)
8.70 USDT (swing target)
17.36 USDT (macro cycle high)
🎯 High reward-to-risk potential if entries are made near support with a stop-loss under 1.70 USDT.
---
📉 Bearish Scenario: Breakdown Risk
Trigger: Weekly candle closes below 1.70 USDT.
Implication: Breakdown from long-term demand zone.
Downside Targets:
1.20 USDT → Minor horizontal support
0.71 USDT → Historical all-time low
Warning Sign: High volume breakdown = likely sign of institutional selloff or panic exit.
---
📊 Strategic Summary:
> QTUM is at a pivotal crossroads.
The 1.70 – 2.10 USDT range is a decisive area.
A bullish breakout could spark a major recovery rally,
while a breakdown may lead to a deeper capitulation.
This is a “calm before the storm” situation. Traders should monitor closely as the next few weekly candles could define the trend for the rest of 2025.
#QTUMUSDT #QTUM #CryptoAnalysis #AltcoinSetup #TechnicalAnalysis #AccumulationPhase #SupportAndResistance #BreakoutPlay #CryptoBreakout
Qtumusdtanalysis
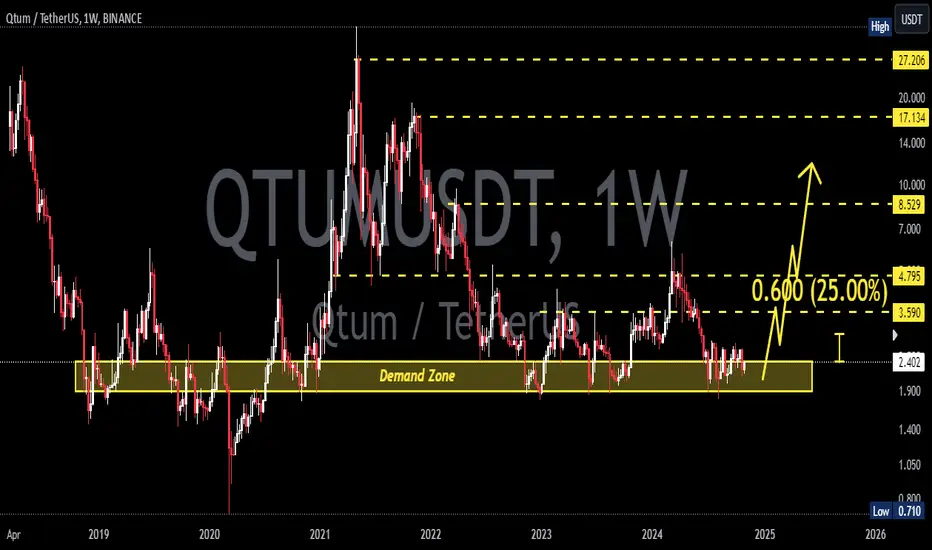
QTUMUSDT 1W AnalysisQTUM ~ 1W Analysis
#QTUM Buy back gradually from here with a short term target of at least 20%+ from this support.
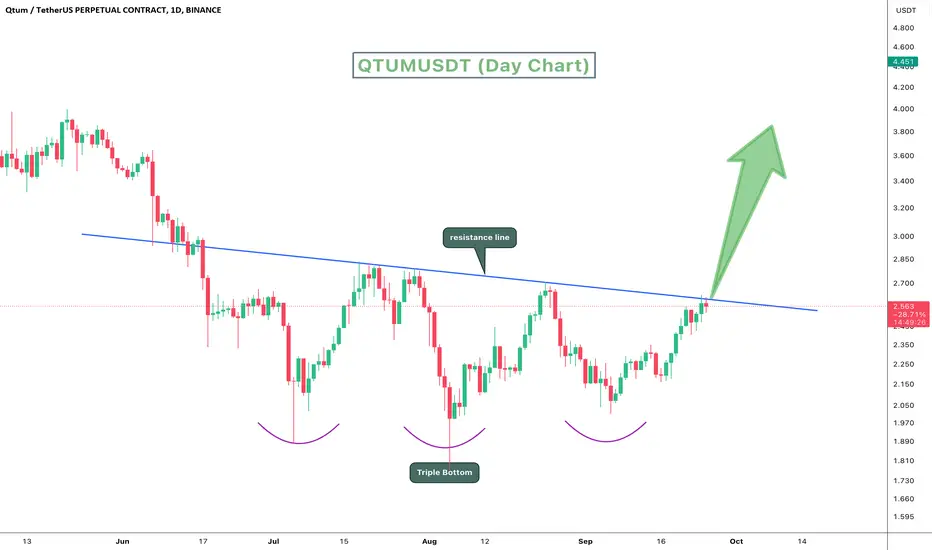
QTUMUSDT 1D AnalysisQTUM ~ 1D Analysis
#QTUM Buy after successfully penetrating this resistant line with a short -term target of at least 10%+ from here.

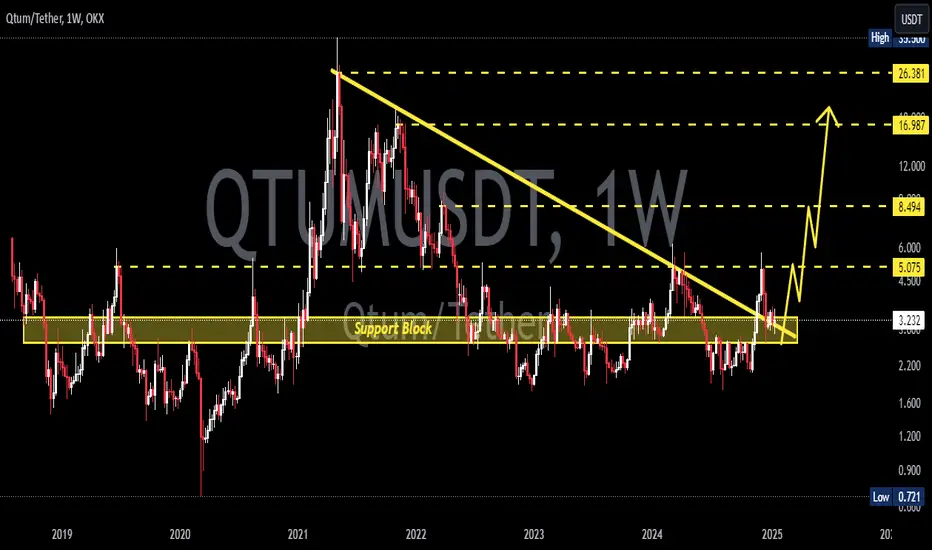
QTUMUSDT 1WQTUM ~ 1W Analysis
#QTUM If you still have a Conviction on this coin, maybe this support you can consider to start buying again from here.
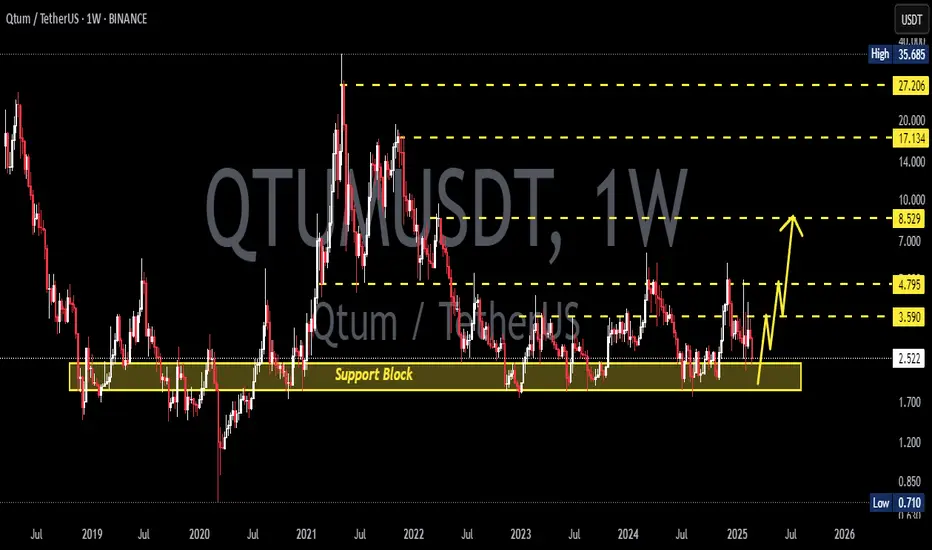
QTUMUSDT 1WQTUM ~ 1W
#QTUM If you still have Conviction on this coin,. This support block would be a very good buying place for now,. With a minimum target of 20%++
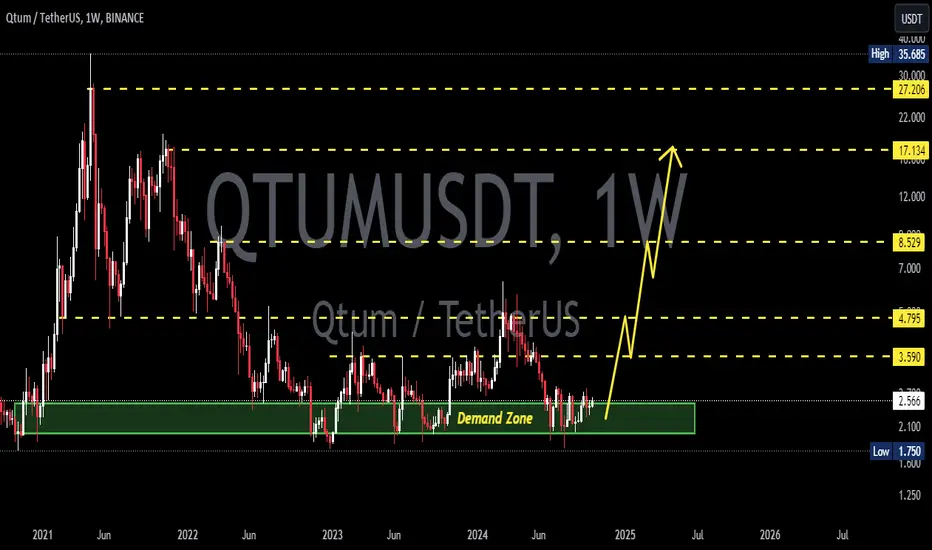
QTUMUSDTQTUM ~ 1W
#QTUM So far it continues to maintain this support Block. If you still have Conviction on this coin,. this support block will be a very good buy so far.
QTUMUSDTQTUM ~ 1W
#QTUM A very interesting demand zone at the moment. we think 20%+ in the short term is not too bad for this $Coin.
QTUMUSDT Triple Bottom.QTUMUSDT Technical analysis update.
QTUM has formed a triple bottom on the daily chart and is currently trading below the neckline resistance. Once a breakout is confirmed on the daily chart, we could see a strong bullish move in QTUM.
Buy level: After Breakout.
QTUMUSDTQTUM ~ 1W
#QTUM A very interesting demand zone at the moment. we think 20%+ in the short term is not too bad for this $Coin.
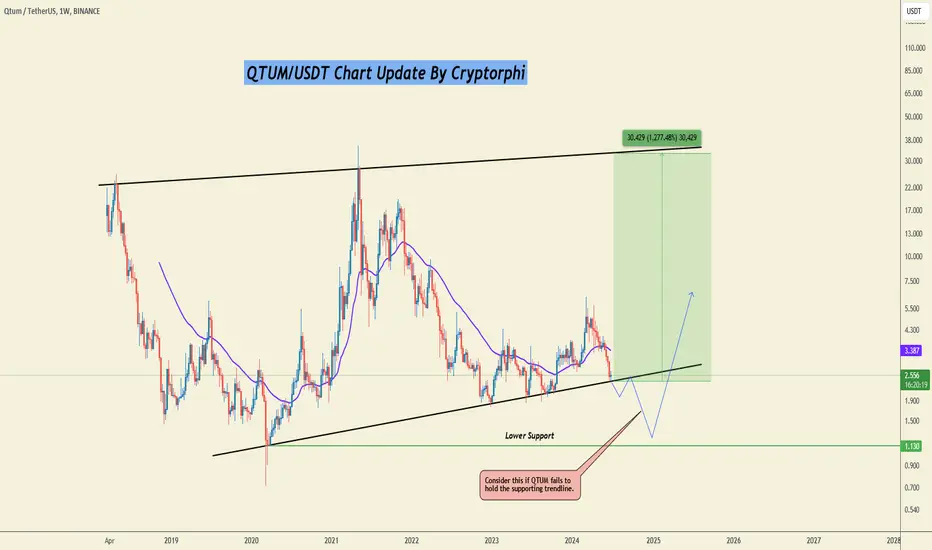
QTUM/USDT Weekly Update!Hello everyone, I’m Cryptorphic.
For the past seven years, I’ve been sharing insightful charts and analysis.
Follow me for:
~ Unbiased analyses on trending altcoins.
~ Identifying altcoins with 10x-50x potential.
~ Futures trade setups.
~ Daily updates on Bitcoin and Ethereum.
~ High time frame (HTF) market bottom and top calls.
~ Short-term market movements.
~ Charts supported by critical fundamentals.
Now, let’s dive into this chart analysis:
QTUM is holding the supporting trendline at $2.5. This is a crucial juncture for QTUM to determine whether it will continue the downtrend or make a rebound from the current support level.
Key Observations:
~ Primary Support: $2.5.
~ Lower Support: $1.11.
~ Primary Resistance: 50 SMA at $3.15.
~ Long-term Target: $27-$30.
~ Bearish Move: Breakdown below the primary support.
~ Bullish Move: Price holding the primary support and rebounding above the 50 SMA.
The price speculation is in a higher time frame and for educational purposes only. Please do not consider it for scalp trading and futures trading.
DYOR. NFA.
Please hit the like button to support my content and share your thoughts in the comment section. Feel free to request any chart analysis you’d like to see!
Thank you!
#PEACE
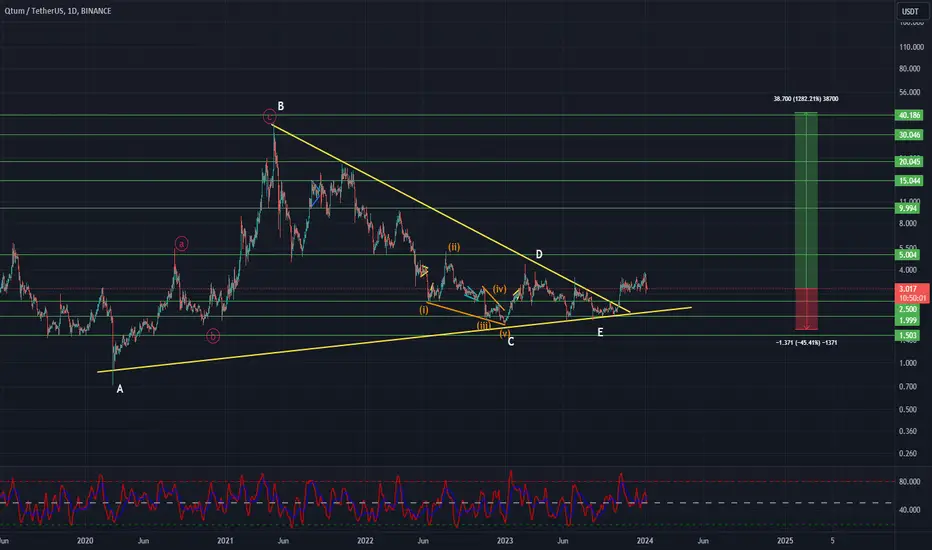
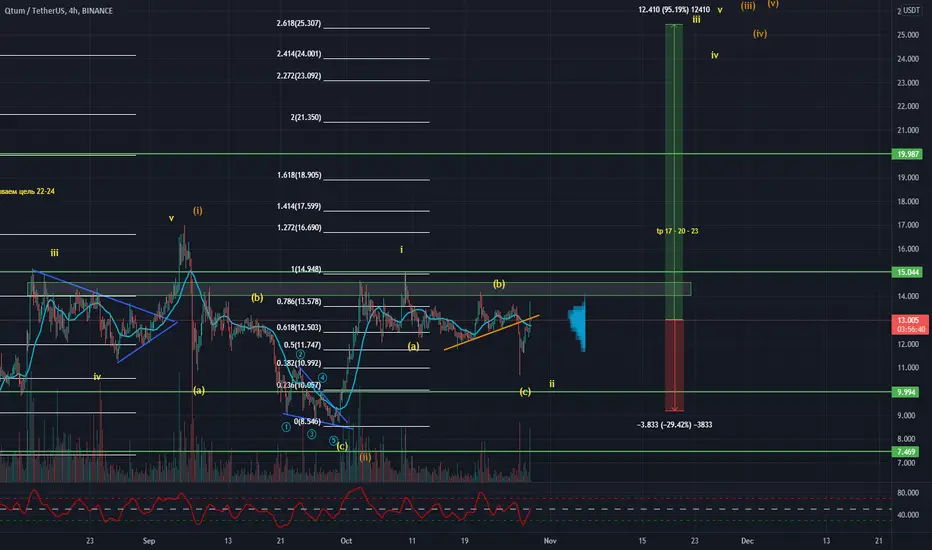
QTUMUSDT Elliott Waves Analysis (Investment Idea)Hello friends.
Please support my work by clicking the LIKE button👍(If you liked). Also i will appreciate for ur activity. Thank you!
Everything on the chart.
Main(investment) target zone: 40 - 50$
Targets: 10 - 20 - 40
Cancellation of setup - consolidation under ~1.6
RR: 1 to ~30
risk is justified
Good luck everyone!
Follow me on TRADINGView, if you don't want to miss my next analysis or signals.
It's not financial advice.
Dont Forget, always make your own research before to trade my ideas!
Open to any questions and suggestions
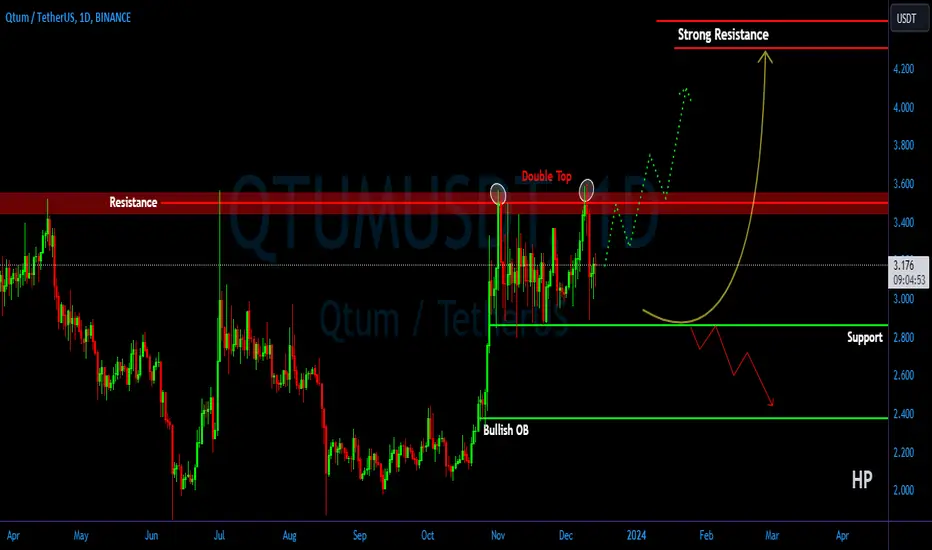
QTUM/USDT Double top keep on eye! Could Break the resistance ??💎 QTUM has been a notable focus in the financial market, consistently encountering challenges at a key resistance area. In recent days, QTUM again attempted to break through this resistance but was met with a substantial bearish rejection.
💎 Currently positioned at the range support area, QTUM needs to demonstrate a strong bounce to revisit and potentially break through the resistance. A successful breach of this resistance, probability could lead QTUM towards a significant resistance area.
💎 However, if QTUM fails to respond positively at the support level, meaning it doesn't rebound and instead breaks below this support, it could confirm a double top pattern. This pattern's validation would point to a bearish trajectory for QTUM, with the target likely set in the Bullish OB area.
QTUM/USDT Crucial area. Need to Break for continue Upward Move 💎 QTUM has indeed garnered our attention. In its current trajectory, QTUM has effectively breached the supply zone, with a confirmed retesting phase already under its belt. Notably, following a strategic retest at the demand zone, QTUM experienced a sharp rebound, propelling it towards an upward path and bringing it to a pivotal supply zone.
💎 For a genuine breakout confirmation, QTUM needs to overcome the $2.7 supply barrier and secure a position above it. Achieving this could set the stage for QTUM to sustain a robust upward journey, smoothly reaching more substantial levels, and probability targeting the major supply zone or even the bearish OB.
💎 However, there's a contingency to keep in mind. Should QTUM struggle to break through the supply threshold, it might retract to the $2.350 demand zone to regather strength for another upward attempt.
💎 If QTUM retraces to the demand zone and fails to uphold its stance, leading to a breakdown, a bearish undertone could take hold. Under these circumstances, QTUM might lose momentum, possibly initiating a downward spiral, revisiting the foundational support levels in a more precarious position.

QTUM and the 1600 Risk to rewards Opportunity Hi Everyone;
today we have one of the best risk to reward Investment opportunity
it is more than 1600 times the risk and the chart is look very promising.
I expect breaking the previous bear market key point will clear the way to the final target

QTUMUSDT buying signal crypto analysisMarket in our way to white BC buying area after formation of white sequence (III) RR: 3:1

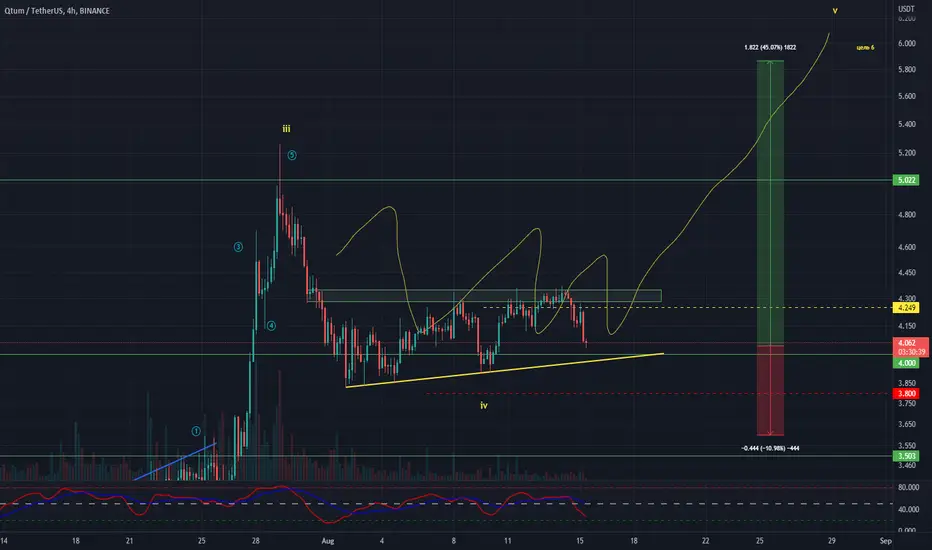
QTUMUSDT Analysis (Local Vision)Hello friends.
Please support my work by clicking the LIKE button👍(If you liked). Also i will appreciate for ur activity. Thank you!
Everything on the chart.
Entry: market and lower
Target zone: 5.5 - 6
after first target reached move ur stop to breakeven
Stop: ~3.6 (depending of ur risk). ALWAYS follow ur RM .
Risk/Reward: 1 to 4.5
risk is justified
Good luck everyone!
Follow me on TRADINGView, if you don't want to miss my next analysis or signals.
It's not financial advice.
Dont Forget, always make your own research before to trade my ideas!
Open to any questions and suggestions.
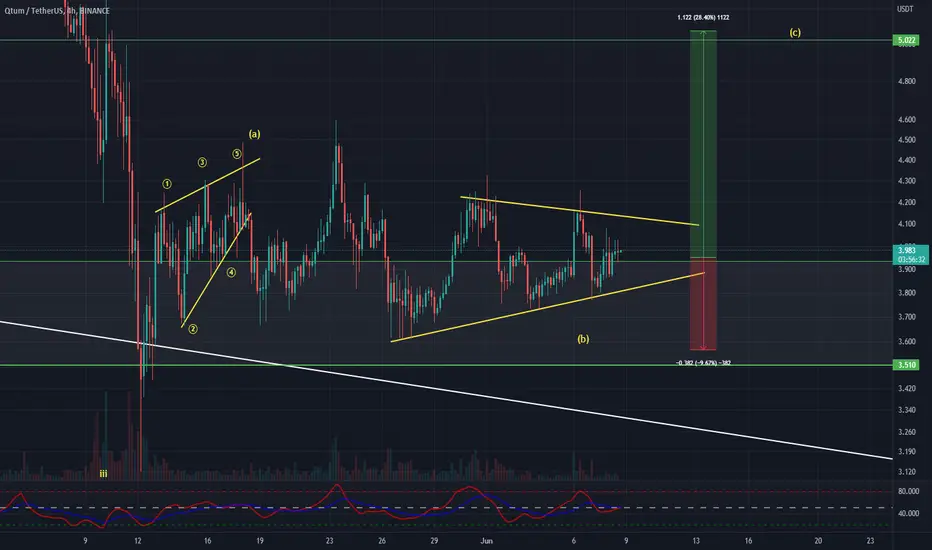
QTUMUSDT Analysis (Local Vision)Hello friends.
Please support my work by clicking the LIKE button👍(If you liked). Also i will appreciate for ur activity. Thank you!
Everything on the chart.
Entry: market and lower
Target zone: 4.8 - 5.2
after first target reached move ur stop to breakeven
Stop: ~3.5 (depending of ur risk). ALWAYS follow ur RM .
Risk/Reward: 1 to 3
risk is justified
Good luck everyone!
Follow me on TRADINGView, if you don't want to miss my next analysis or signals.
It's not financial advice.
Dont Forget, always make your own research before to trade my ideas!
Open to any questions and suggestions.
QTUM/USDT DAILY UPDATE Hi guys, This is CryptoMojo, One of the most active trading view authors and fastest-growing communities.
Do consider following me for the latest updates and Long /Short calls on almost every exchange.
I post short mid and long-term trade setups too.
Let’s get to the chart!
I have tried my best to bring the best possible outcome in this chart, Do not consider it as an
According to this 2days chart, BICO is making this descending triangle .
Entry range:- CMP and more up to $6
Target:- 100%
SL:- If any daily candle close below $5
This chart is likely to help you in making better trade decisions, if it did do consider upvoting this chart.
Would also love to know your charts and views in the comment section.
Thank you

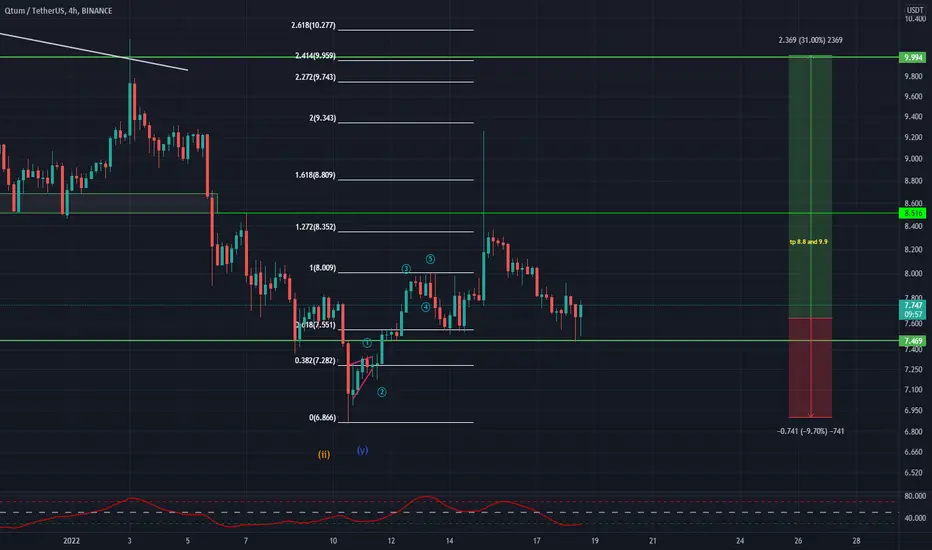
QTUMUSDT Analysis (LOCAL VISION)Hello friends.
Please support my work by clicking the LIKE button👍(If you liked). Also i will appreciate for ur activity. Thank you!
Everything on the chart.
Entry: market and lower
Target: 8.8 and 9.9
after first target reached move ur stop to breakeven
Stop: under 6.9 (depending of ur risk). ALWAYS follow ur RM .
Risk/Reward: 1 to 3
risk is justified
Good luck everyone!
Follow me on TRADINGView, if you don't want to miss my next analysis or signals.
It's not financial advice.
Dont Forget, always make your own research before to trade my ideas!
Open to any questions and suggestions.
Qtum is acting well , dont sell now !
Since 15 august is consolidating
We have a bullish market overall.
Another bullish wave is about to start for Qtum.
Right now we tested EMA50, so expecting bounce from here.
The RSI mostly at 50 maybe will reinforce the price upwards.
if u already in, add bags now n sell targets
This all means that QTUMUSDT remains strong.
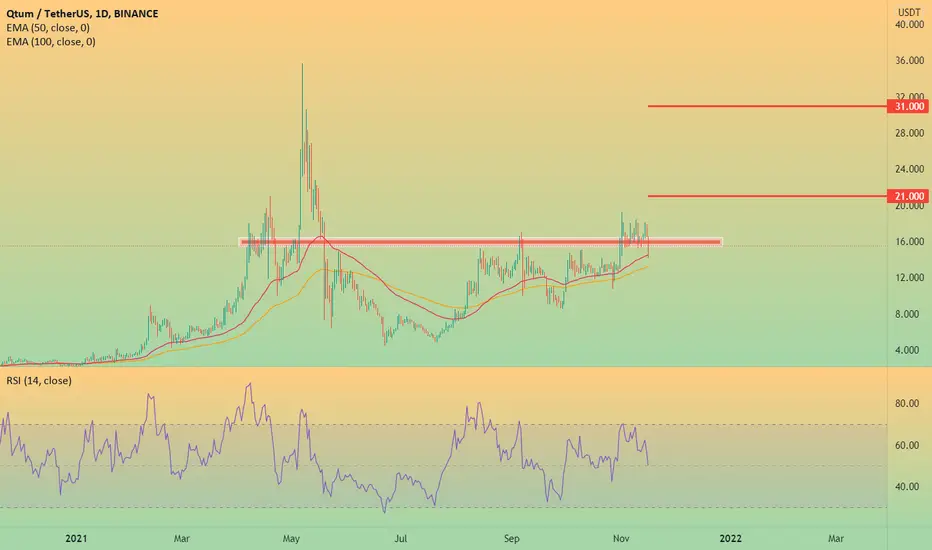
QTUMUSDT AnalysisHello friends.
Please support my work by clicking the LIKE button(If you liked).Thank you!
Everything on the chart.
open pos: market and lower
target: 16 - 20 - 23
after first target reached move ur stop to breakeven
stop: ~9.2(depending of ur risk). ALWAYS follow ur RM .
risk/reward 1 to 3
risk is justified
Good luck everyone!
Follow me on TRADINGView, if you don't want to miss my next analysis or signals.
It's not financial advice.
Dont Forget, always make your own research before to trade my ideas!
Will be very APPRECIATE FOR UR DONAT/coins :)
Open to your questions or suggestions(Looking for investors!).
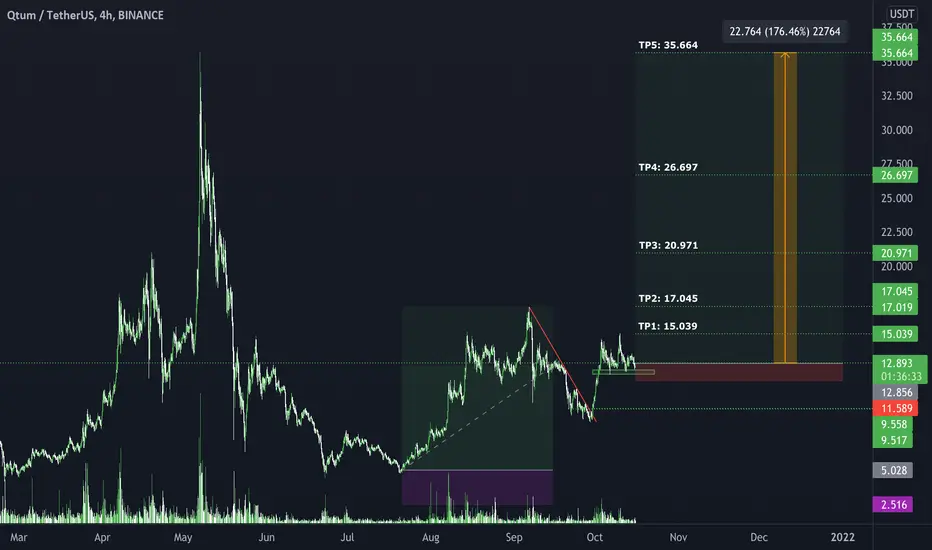
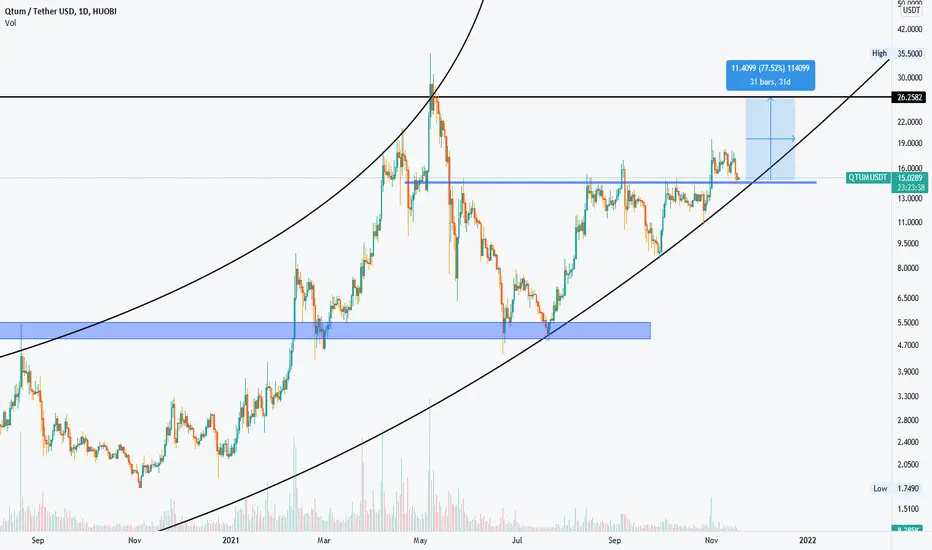
QTUMUSDT Bullish | Strong Support Zone | Morning Star FormationQTUMUSDT Bullish from Strong Support Zone | Creating Morning Star
I am expecting a 17% move could be more than that and expecting a bull run till $36 which is 177%
Entry: 12.856
TP1: 15.039
TP2: 17.045
TP3: 20.971
TP4: 26.697
TP5: 35.664
SL: 11.589
Net ROI: 170% - 177%
Trade Risk: 9.86%
Duration: 3 Months
NOTE: Do your own analysis. Spot trading only. Take a low risk. I will not be responsible for any loss.