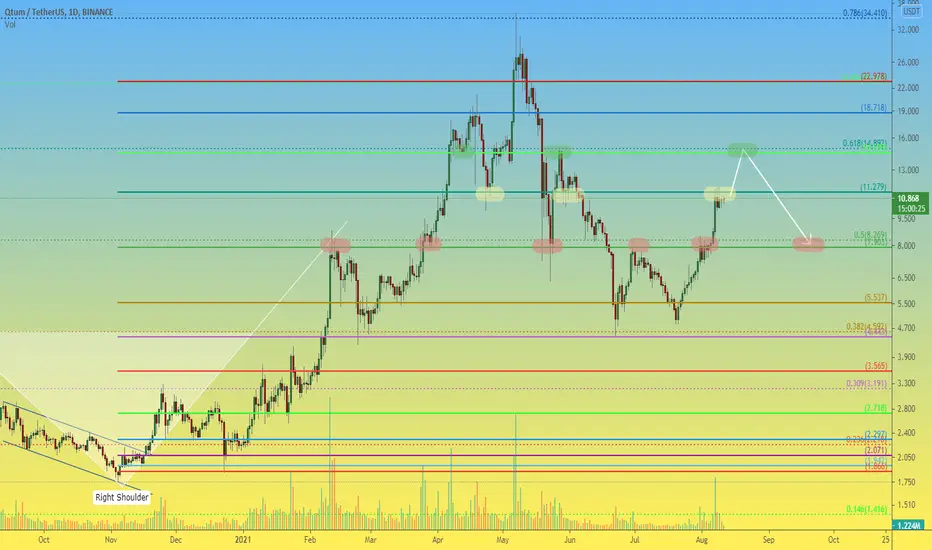
QTUM 1D We expect continued growthLet's start with the fact that we made the previous idea of the QTUMUSDT pair exactly 6 months ago.
Just look how it worked perfectly!
S uch an idea at least deserves: a like from you, a medal for labor and efforts from tradingview and a Donate from someone who earned thanks to our ideas)
Such a clear development of the idea is due to the fact that the QTUMUSD trading pair moves very technically from one price range to another. We have depicted the main ones on the graph.
Recently, when the QTUM price was about to break through the strong mirror level around $8 , we saw this intention of buyers in advance. As a result, we made a modest +30% trade within our experimental demonstration "Trade Marathon"
By the way, earlier we often published the statistics of our Trade Marathon, then the fall of the market and the summer period discouraged people from trading. But we did not stop the Marathon for a day and confidently moved towards the goal with the previously announced strategy ..!)
What do you think, is it worth again publishing an idea with the statistics of the trade marathon? Please write in the comments!
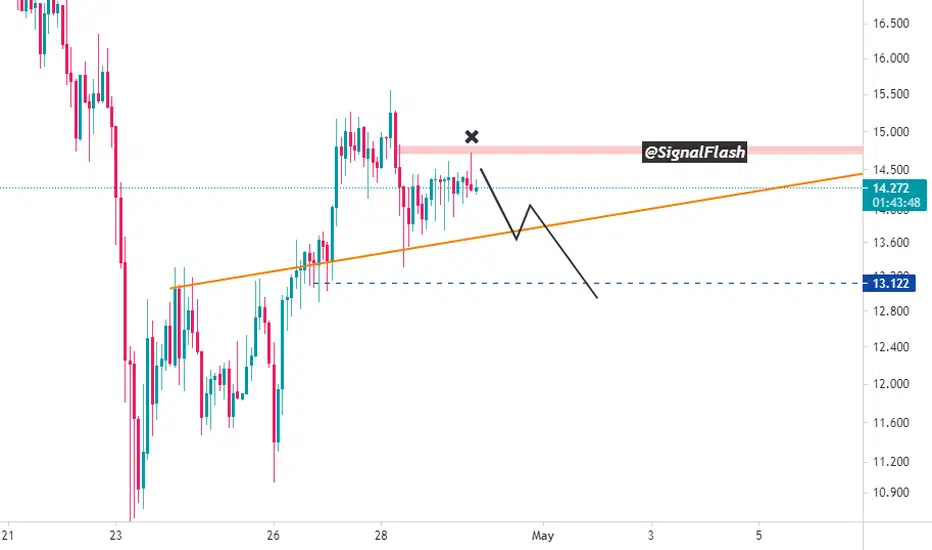
Today, the price of QTUMUSDT is consolidating under another liquid zone on the way to further upward movement. There may even be a minimal correction. However, we believe that the growth of the QTUMUSD price will continue in the near future, at least up to the price range of $14.50-14.90
_______________________________
Since 2016, we have been analyzing and trading the cryptocurrency market.
We transform our knowledge, trading moods and experience into ideas. Each "like under the idea" boosts the level of our happiness by 0.05% . If we help you to be calmer and richer — help us to be happier :)
Qtumusdtanalysis
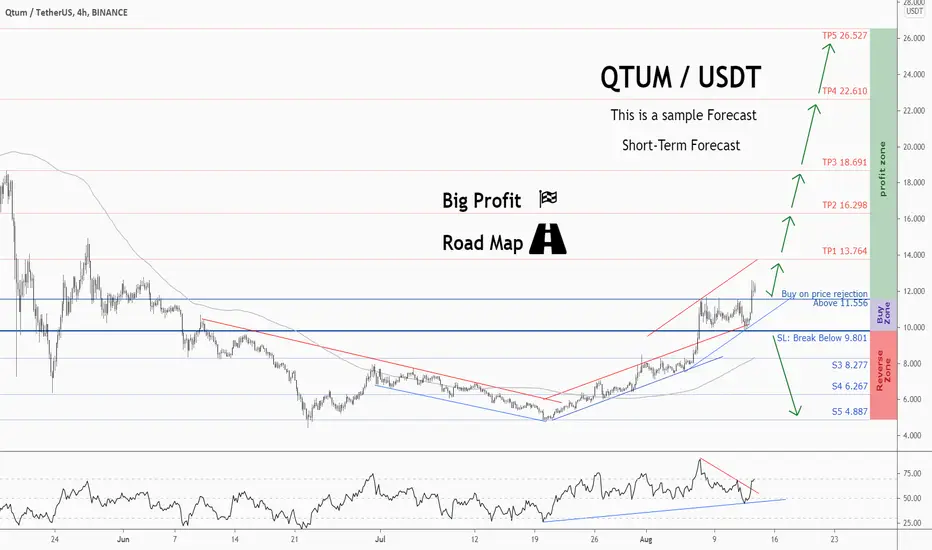
💡Don't miss the great buy opportunity in QTUMUSDTrading suggestion:
". There is a possibility of temporary retracement to the suggested support line (11.556).
. if so, traders can set orders based on Price Action and expect to reach short-term targets."
Technical analysis:
. QTUMUSD is in an uptrend, and the continuation of the uptrend is expected.
. The price is above the 21-Day WEMA, which acts as a dynamic support.
. The RSI is at 70.
Take Profits:
TP1= @ 13.764
TP2= @ 16.298
TP3= @ 18.691
TP4= @ 22.610
TP5= @ 26.527
SL= Break below S2
❤️ If you find this helpful and want more FREE forecasts in TradingView
. . . . . Please show your support back,
. . . . . . . . Hit the 👍 LIKE button,
. . . . . . . . . . Drop some feedback below in the comment!
❤️ Your support is very much 🙏 appreciated! ❤️
💎 Want us to help you become a better Forex / Crypto trader ?
Now, It's your turn !
Be sure to leave a comment; let us know how you see this opportunity and forecast.
Trade well, ❤️
ForecastCity English Support Team ❤️
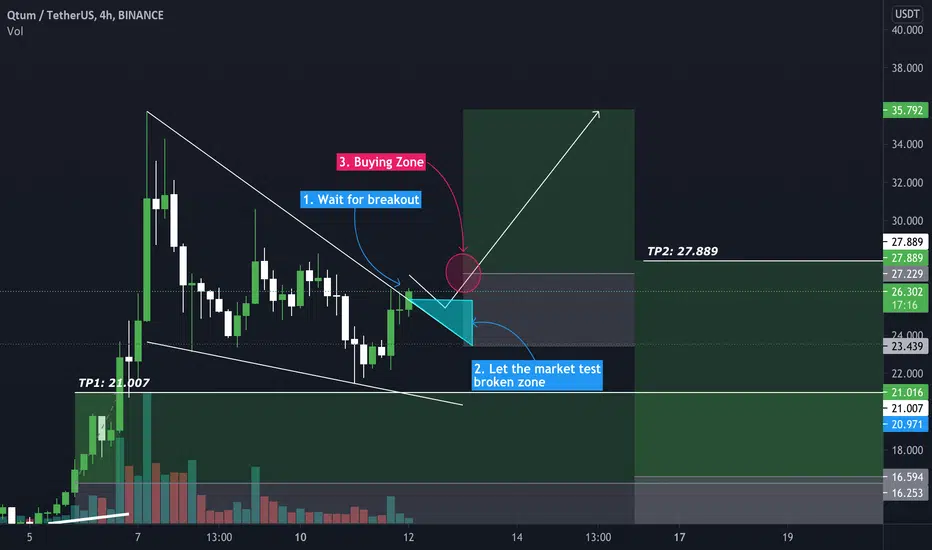
QTUMUSDT Falling Wedge Bullish BreakoutQTUMUSDT Falling Wedge Bullish Breakout
We have seen that QTUMUSDT has created ATH at level 35.66 and then came the correction phase. In the correction process, QTUMUSDT has created a falling wedge pattern and now being broken.
We may have a very profitable trade if the setup is validated.
NOTE: DO YOUR OWN ANALYSIS, DO PROPER RISK AND MONEY MANAGEMENT. SPOT TRADING ONLY.
Filling the supply area and waiting for the fallAfter collecting the stops and Sell orders (red box), you should think more about falling
If the red box penetrates, both at this time and the lower time, the downside view will change and a new analysis will have to be presented after further investigation.
At 15 minutes, you can see that we did not have a quick return after the fall, and it remained in the side range and the supply area (red box) was collected
Do not forget to like and follow to see more analysis
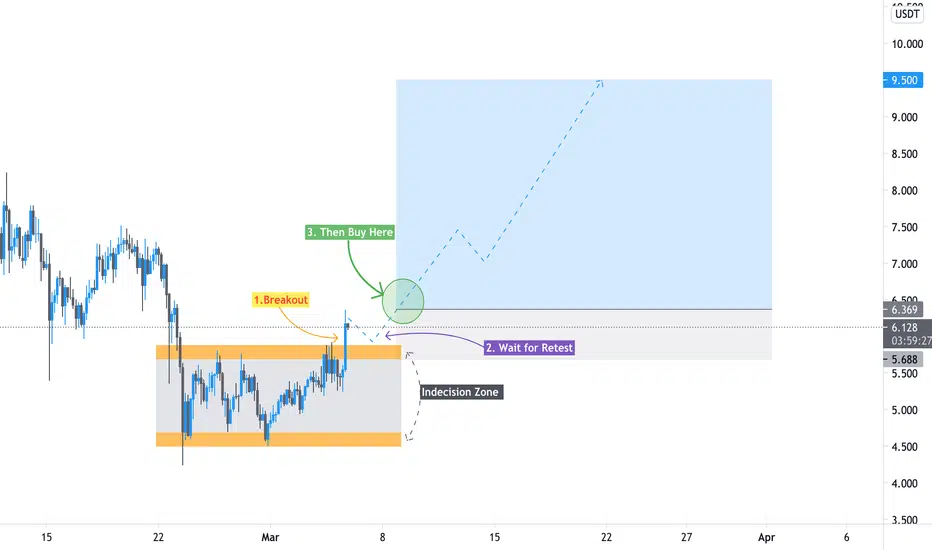
QTUMUSDT Bullish BreakoutQTUMUSDT Bullish Breakout. Now we need to wait for the Retest.
All the details have been drawn in the chart.
Happy Trading.