QTUM/USDT – Make or Break? Testing the Edge of Accumulation?🧠 Overview:
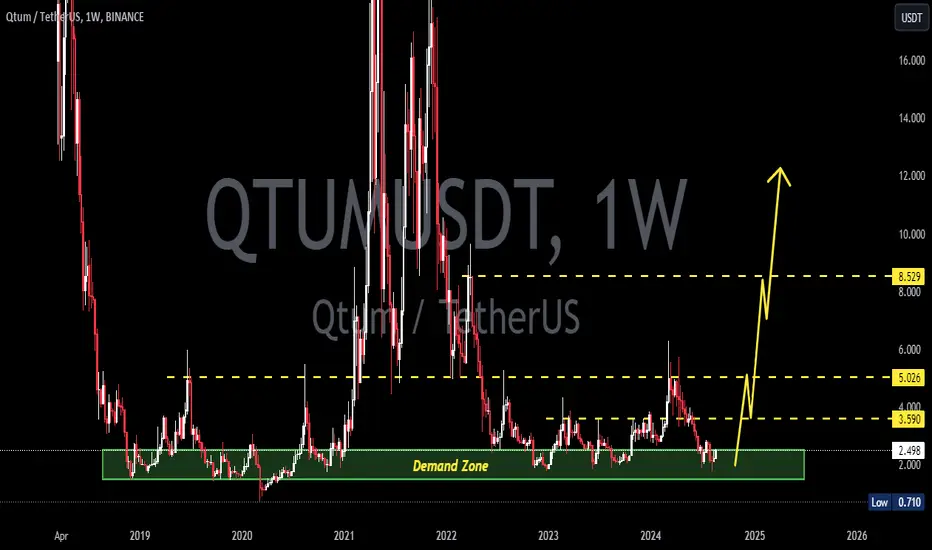
After going through a volatile multi-year cycle, QTUM is now back at one of the most critical historical support zones. This demand area has acted as a strong reversal point multiple times since 2020 and is once again being tested as price consolidates near the bottom of its macro range.
---
📉 Price Structure & Key Levels:
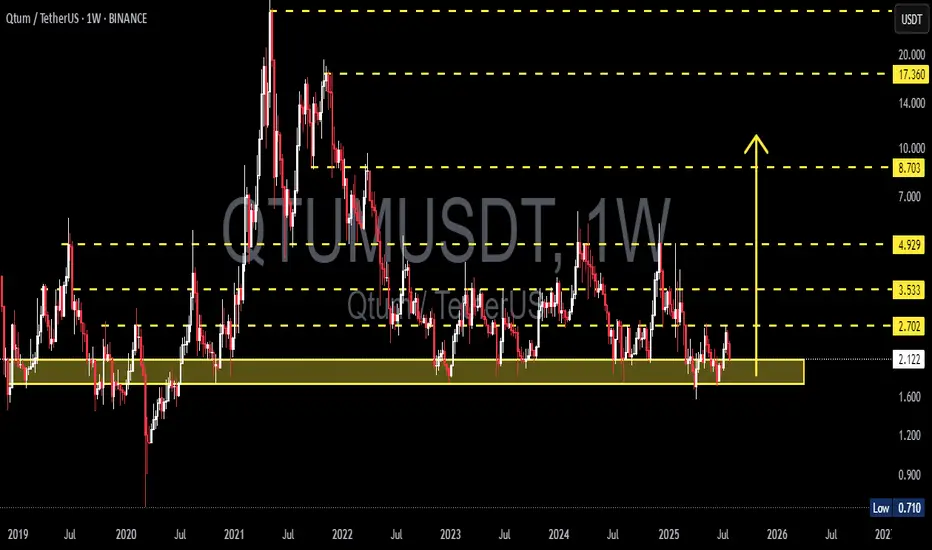
📍 Major Support Zone (1.70 – 2.10 USDT):
A proven accumulation zone based on multiple long wicks and price rejections in the past.
This is where smart money tends to accumulate during market uncertainty.
📍 Layered Resistance Levels (Bullish Targets):
2.70 USDT → Initial breakout validation
3.53 USDT → Mid-range resistance
4.93 USDT → Key structural level
8.70 USDT → Mid-term breakout target
17.36 USDT → Peak from previous macro cycle
---
🧩 Current Pattern: "Sideways Accumulation Range"
QTUM is clearly in a range-bound accumulation phase, with tight price action within a key support area. Historically, such patterns often precede large impulsive moves, especially when accompanied by volume surges and breakouts from structure.
> ⚠️ Important Note: Sideways movement at historical support, combined with increasing accumulation volume, often leads to a breakout into the markup phase.
---
📈 Bullish Scenario: Potential Upside Momentum
Trigger: A confirmed breakout and weekly candle close above 2.70 USDT.
Additional Confirmation: Strong bullish candle with increased volume.
Targets:
3.53 USDT (local resistance)
4.93 USDT (mid-range structural level)
8.70 USDT (swing target)
17.36 USDT (macro cycle high)
🎯 High reward-to-risk potential if entries are made near support with a stop-loss under 1.70 USDT.
---
📉 Bearish Scenario: Breakdown Risk
Trigger: Weekly candle closes below 1.70 USDT.
Implication: Breakdown from long-term demand zone.
Downside Targets:
1.20 USDT → Minor horizontal support
0.71 USDT → Historical all-time low
Warning Sign: High volume breakdown = likely sign of institutional selloff or panic exit.
---
📊 Strategic Summary:
> QTUM is at a pivotal crossroads.
The 1.70 – 2.10 USDT range is a decisive area.
A bullish breakout could spark a major recovery rally,
while a breakdown may lead to a deeper capitulation.
This is a “calm before the storm” situation. Traders should monitor closely as the next few weekly candles could define the trend for the rest of 2025.
#QTUMUSDT #QTUM #CryptoAnalysis #AltcoinSetup #TechnicalAnalysis #AccumulationPhase #SupportAndResistance #BreakoutPlay #CryptoBreakout
Qtumusdtlong
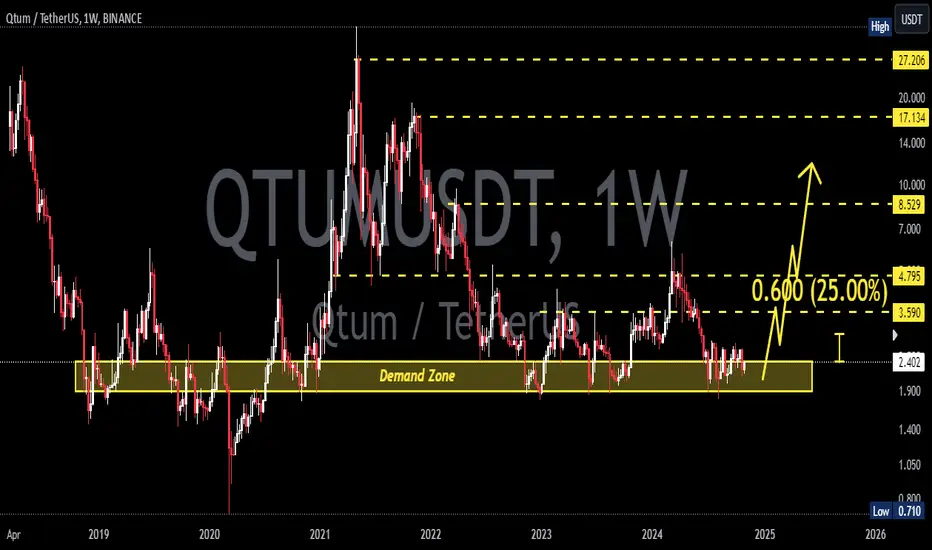
QTUMUSDT 1W AnalysisQTUM ~ 1W Analysis
#QTUM Buy back gradually from here with a short term target of at least 20%+ from this support.
#QTUM/USDT#QTUM
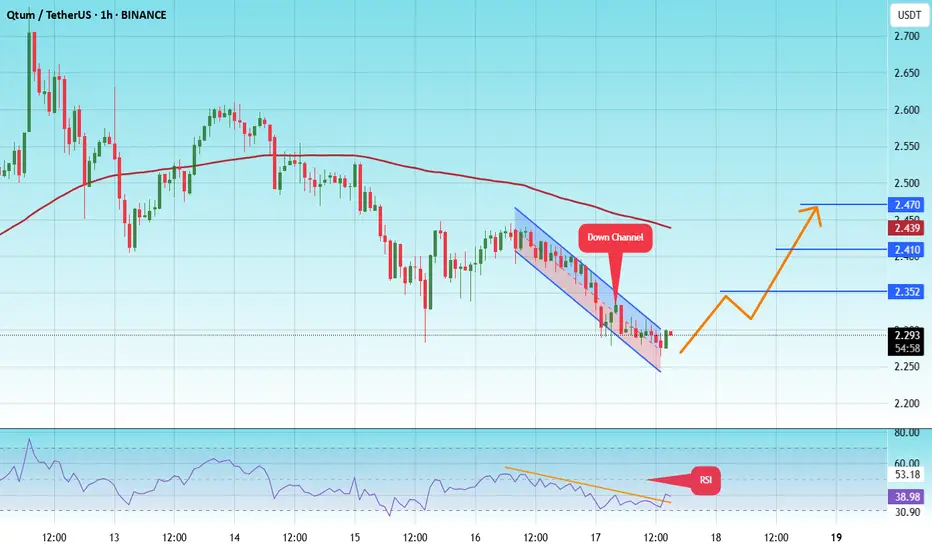
The price is moving within a descending channel on the 1-hour frame and is expected to break and continue upward.
We have a trend to stabilize above the 100 moving average once again.
We have a downtrend on the RSI indicator that supports the upward move with a breakout.
We have a support area at the lower limit of the channel at 2.25, acting as strong support from which the price can rebound.
Entry price: 2.30
First target: 2.35
Second target: 2.41
Third target: 2.47
QTUMUSDT 1D AnalysisQTUM ~ 1D Analysis
#QTUM Buy after successfully penetrating this resistant line with a short -term target of at least 10%+ from here.

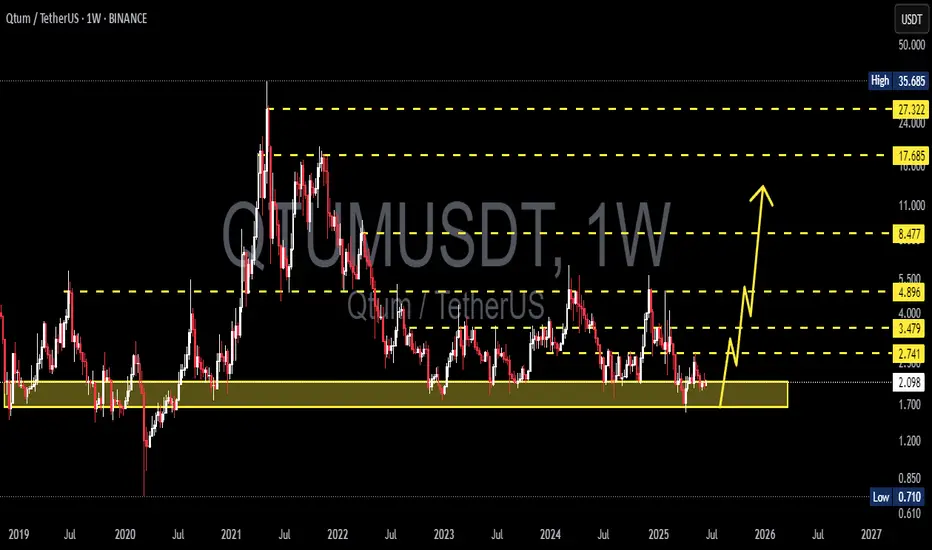
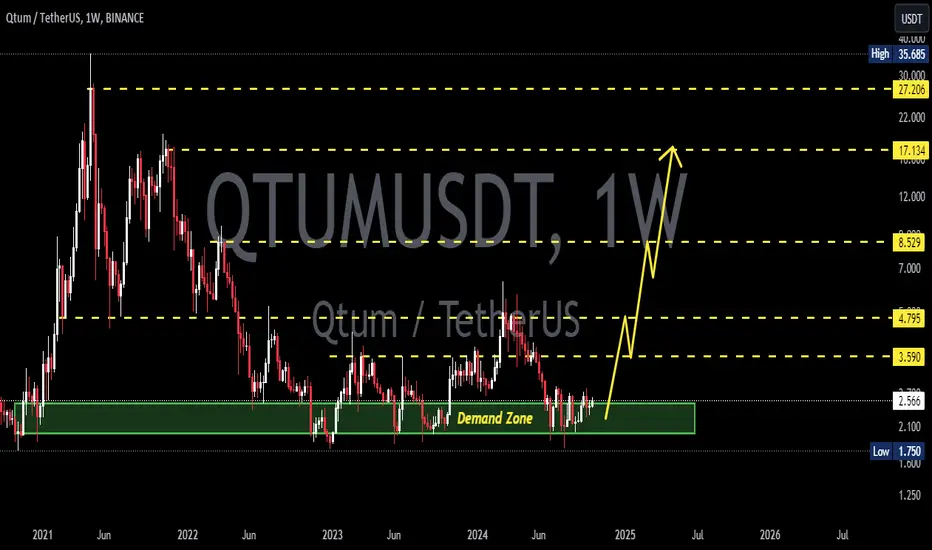
QTUMUSDT 1WQTUM ~ 1W Analysis
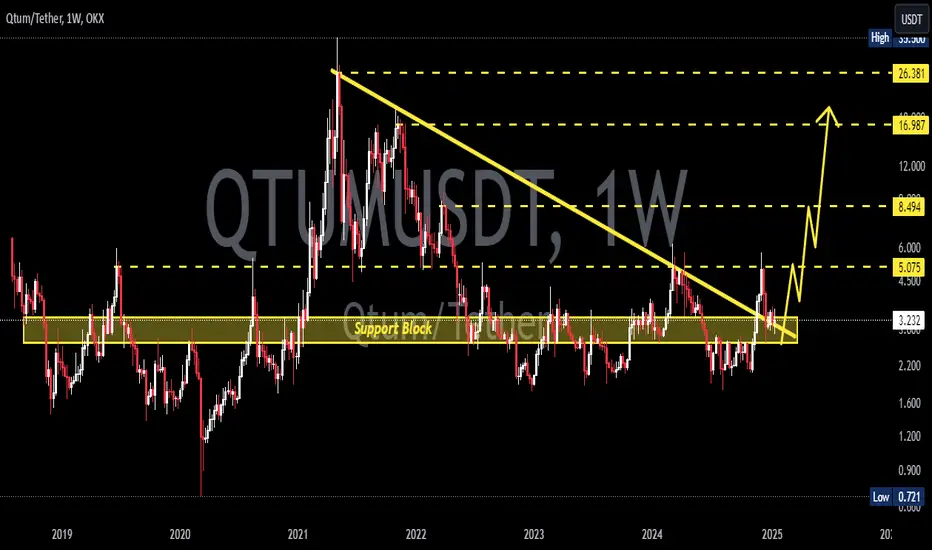
#QTUM If you still have a Conviction on this coin, maybe this support you can consider to start buying again from here.
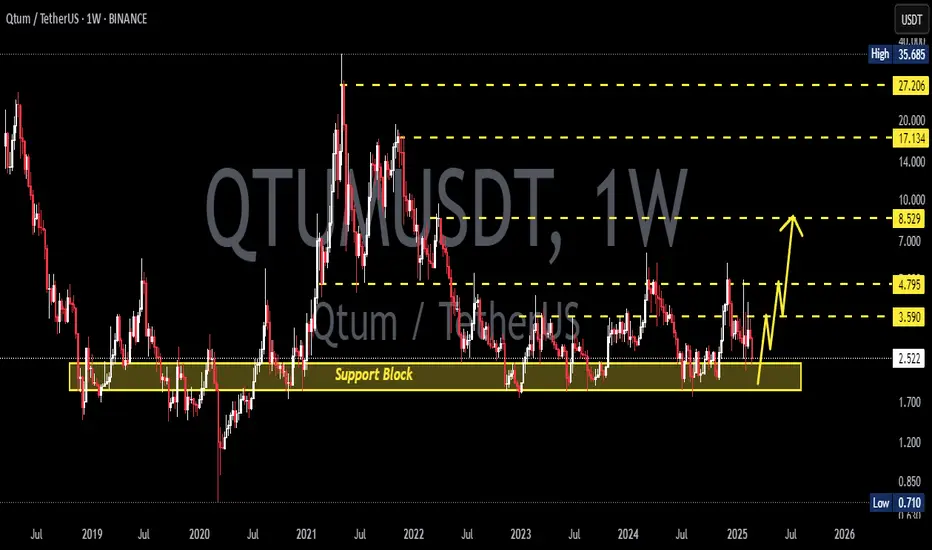
QTUMUSDT 1WQTUM ~ 1W
#QTUM If you still have Conviction on this coin,. This support block would be a very good buying place for now,. With a minimum target of 20%++
QTUMUSDTQTUM ~ 1W
#QTUM So far it continues to maintain this support Block. If you still have Conviction on this coin,. this support block will be a very good buy so far.
QTUMUSDTQTUM ~ 1W
#QTUM A very interesting demand zone at the moment. we think 20%+ in the short term is not too bad for this $Coin.
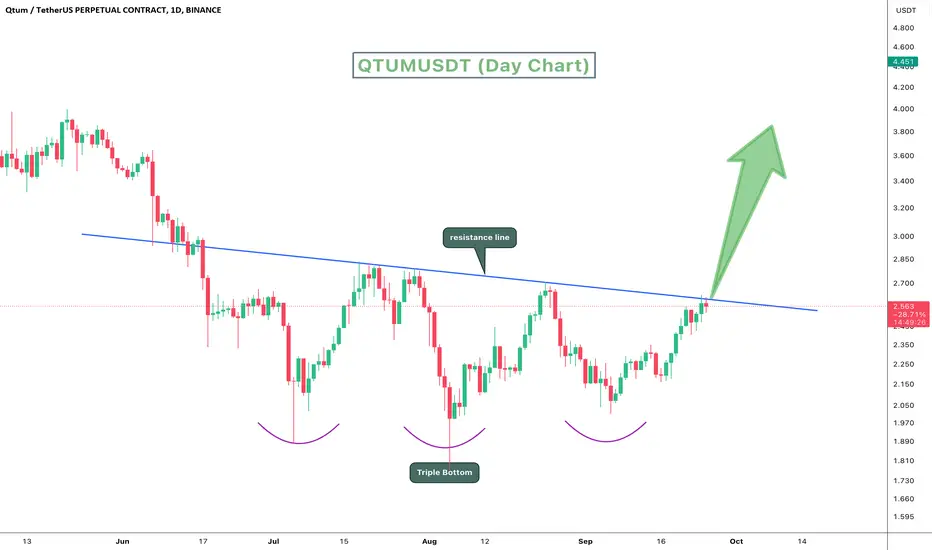
QTUMUSDT Triple Bottom.QTUMUSDT Technical analysis update.
QTUM has formed a triple bottom on the daily chart and is currently trading below the neckline resistance. Once a breakout is confirmed on the daily chart, we could see a strong bullish move in QTUM.
Buy level: After Breakout.
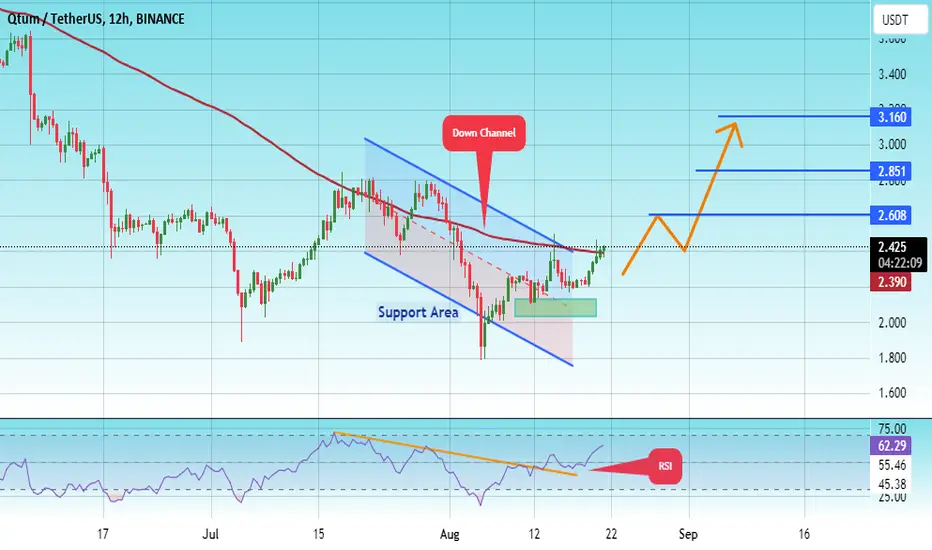
#QTUM/USDT#QTUM
The price is moving in a descending channel on the 12-hour frame and is sticking to it very well and is expected to break it upwards
We have a bounce from a major support area in green at 2.05
We have a downtrend on the RSI indicator that was broken upwards which supports the rise
We have a trend to stabilize above the 100 moving average which supports the rise
Entry price 2.28
First target 2.60
Second target 2.85
Third target 3.16
QTUMUSDTQTUM ~ 1W
#QTUM A very interesting demand zone at the moment. we think 20%+ in the short term is not too bad for this $Coin.
QTUM/USDT Weekly Update!Hello everyone, I’m Cryptorphic.
For the past seven years, I’ve been sharing insightful charts and analysis.
Follow me for:
~ Unbiased analyses on trending altcoins.
~ Identifying altcoins with 10x-50x potential.
~ Futures trade setups.
~ Daily updates on Bitcoin and Ethereum.
~ High time frame (HTF) market bottom and top calls.
~ Short-term market movements.
~ Charts supported by critical fundamentals.
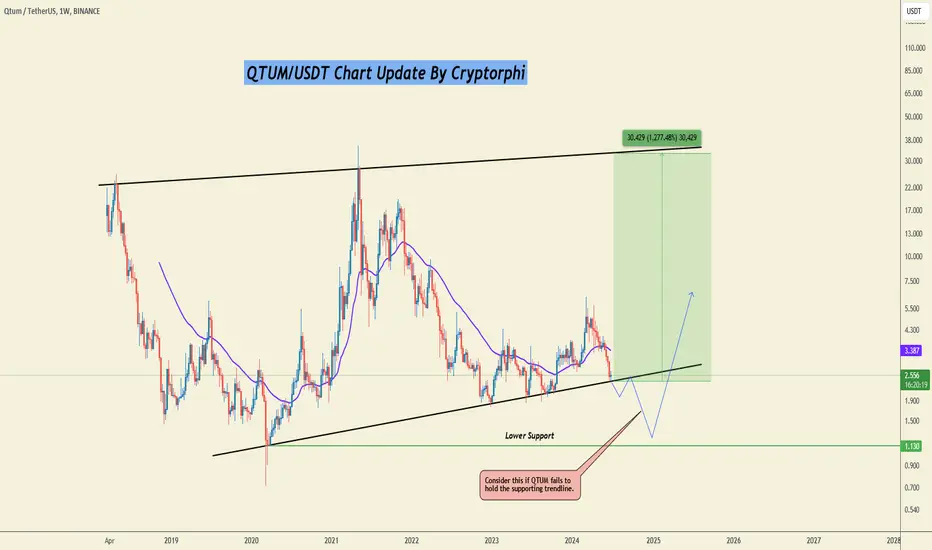
Now, let’s dive into this chart analysis:
QTUM is holding the supporting trendline at $2.5. This is a crucial juncture for QTUM to determine whether it will continue the downtrend or make a rebound from the current support level.
Key Observations:
~ Primary Support: $2.5.
~ Lower Support: $1.11.
~ Primary Resistance: 50 SMA at $3.15.
~ Long-term Target: $27-$30.
~ Bearish Move: Breakdown below the primary support.
~ Bullish Move: Price holding the primary support and rebounding above the 50 SMA.
The price speculation is in a higher time frame and for educational purposes only. Please do not consider it for scalp trading and futures trading.
DYOR. NFA.
Please hit the like button to support my content and share your thoughts in the comment section. Feel free to request any chart analysis you’d like to see!
Thank you!
#PEACE
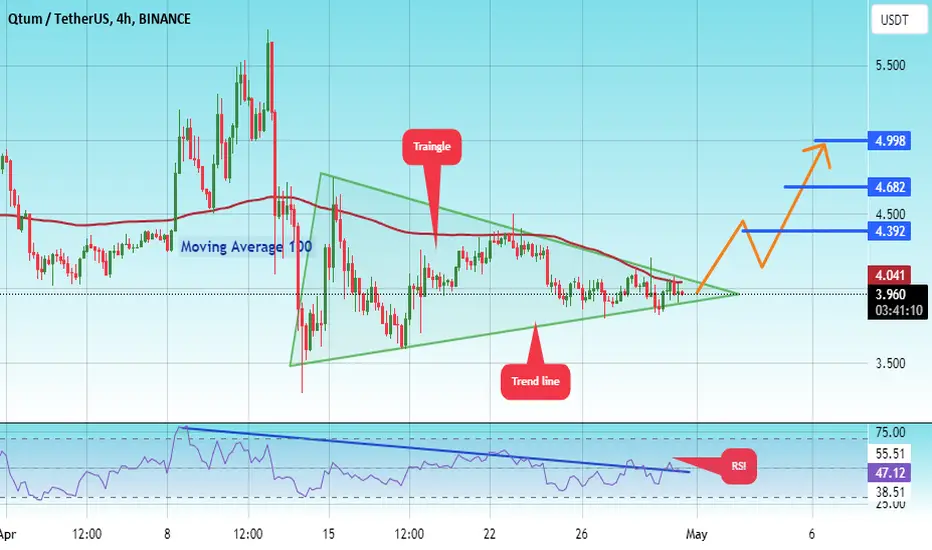
#QTUM/USDT#QTUM
The price is moving in a bearish channel on the 4-hour frame and sticking to it well
The price rebounded well from the lower border of the triangle at the green support level of 3.80
We have a tendency to stabilize above the Moving Average 100
We are oversold on the RSI indicator and we have a downtrend that is expected to break higher to support the rise
Entry price is 4.00
The first goal is 4.40
Second goal 4.68
The third goal is 5.00
#QTUMUSDT#QTUM
The price has been moving in a descending triangle since July 2023
The downtrend was breached
And the Moving Average 100 exceeded
Current price 3.70
First goal 4.395
Second goal 5.320

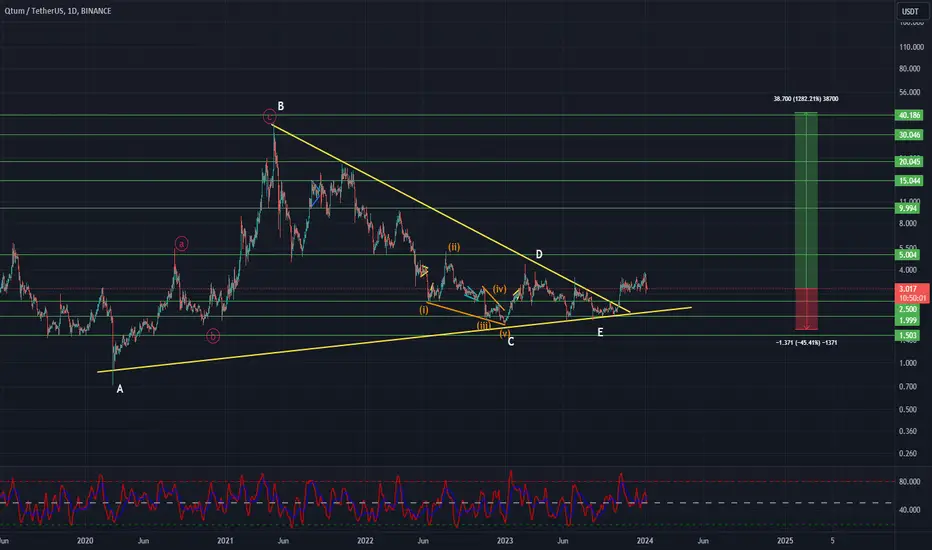
QTUMUSDT Elliott Waves Analysis (Investment Idea)Hello friends.
Please support my work by clicking the LIKE button👍(If you liked). Also i will appreciate for ur activity. Thank you!
Everything on the chart.
Main(investment) target zone: 40 - 50$
Targets: 10 - 20 - 40
Cancellation of setup - consolidation under ~1.6
RR: 1 to ~30
risk is justified
Good luck everyone!
Follow me on TRADINGView, if you don't want to miss my next analysis or signals.
It's not financial advice.
Dont Forget, always make your own research before to trade my ideas!
Open to any questions and suggestions
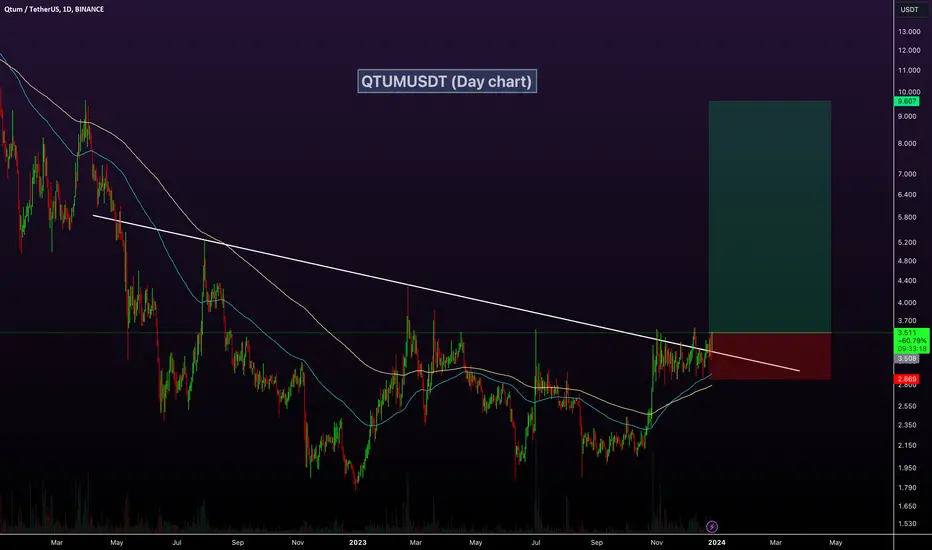
QTUMUSDT Good Potential!QTUMUSDT Technical Analysis Update
QTUMUSDT price breaks its major resistance line after 480 days of a ranging market.
This is a good bullish signal for QTUM.
Buy zone : Below $3.52
Stop loss : $2.85
Take Profit 1: $4.20
Take Profit 2: $5.40
Take Profit 3: $9.60
Regards
Hexa

QTUM/USDT upward momentum? 👀 🚀QTUM Today Analysis💎 Paradisers, focus on the potential opportunity with #QTUMUSDT, as it's currently maintaining key support levels, suggesting a likely upward trajectory.
💎 Historically, #QTUM has a pattern of following a descending trendline. Currently, with strong momentum above the support level of $2.889, there's a substantial chance for a bullish movement. If this upward trend continues, It is set to target resistance levels at $3.547, and might even push further to challenge the higher resistance at $4.325.
💎 While some newcomers may consider panic entries, the sage Paradisers know that timing is crucial in capitalizing on this scenario. Identifying the most favorable entry points during this expected rise is essential, along with being cautious about entering at the market's peak.
💎 Additionally, be ready for a possible bullish rebound from the bullish Order Block (OB) of $2.425. The presence of a Fair Value Gap (FVG) further reinforces the bullish scenario of #QTUM. However, a drop below this level could raise concerns about the sustainability of the bullish trend.
💎 In this fluid and ever-changing market, strategic foresight and intelligent decision-making are paramount. Crafting a comprehensive trading strategy that encompasses effective money management and a deep understanding of support and resistance levels is key to achieving successful trading outcomes. 🌴💰

QTUM and the 1600 Risk to rewards Opportunity Hi Everyone;
today we have one of the best risk to reward Investment opportunity
it is more than 1600 times the risk and the chart is look very promising.
I expect breaking the previous bear market key point will clear the way to the final target

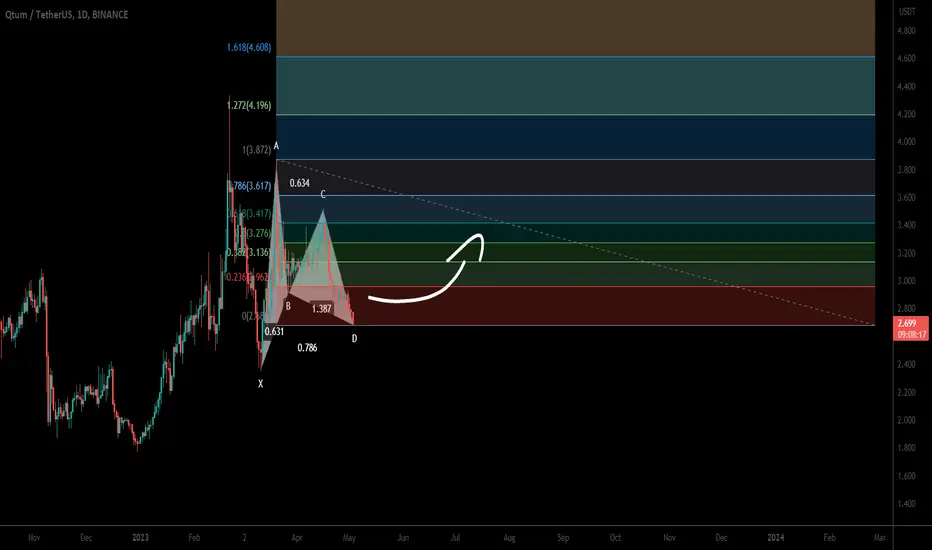
QTUM formed bullish Gartley for upto 53.50% pumpHi dear friends, hope you are well and welcome to the new trade setup of QTUM coin with US Dollar pair.
Previously we caught 55% pump of QTUM as below:
Now on a daily time frame, QTUM has almost formed another bullish Gartley for the next price reversal.
Note: Above idea is for educational purpose only. It is advised to diversify and strictly follow the stop loss, and don't get stuck with trade
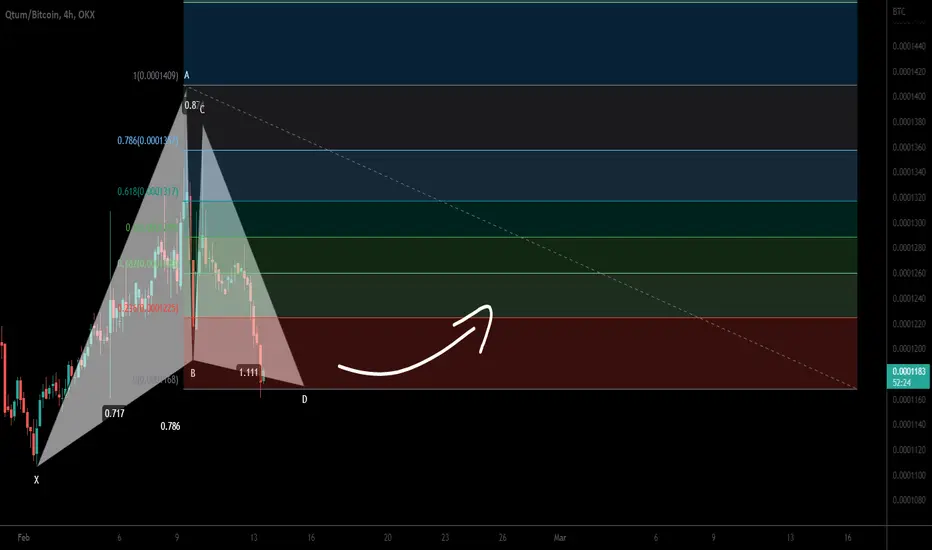
QTUM formed bullish Gartley for upto 22.505 pumpHi dear friends, hope you are well and welcome to the new trade setup of QTUM coin with BTC pair.
Previously we caught a very powerful pump of QTUM, as below:
Now on a 4-hr time frame, QTUM has formed a bullish Gartley move for another price reversal.
Note: Above idea is for educational purpose only. It is advised to diversify and strictly follow the stop loss, and don't get stuck with trade
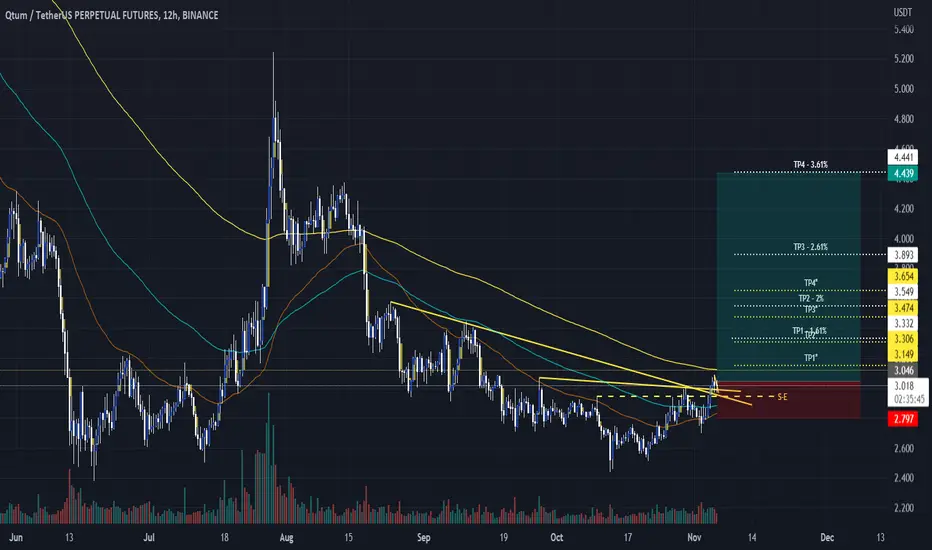
QTUM/USDT - LONG 12 TF----- Welcome, dear followers! -----
- Here is my trading methodology. I trade with a normal system and analysis of resistance and support, as well as price reversal patterns.
- For the record, I do not place a stop loss within my trades. So that I only risk 1.5% of my total capital in order to support the loss due to a price reversal against me.
- If a price reversed against my expectation and touched the drawn line r3, then I transferred targets to the entry point and waited for the price to close at it with a loss equal to almost zero.
- Today's deal is shown in the chart, and here are the entry and exit points below.
-- Support me with numbers and follow up on my account for other deals in the future. Thank you for coming to this part. --
-------------------------------------------------------
⚡️⚡️ #QTUM/USDT ⚡️⚡️
Client: My-Binance Futures
Trade Type: Breakout (Long)
Leverage: Cross (3X)
Entry Targets:
1) 3.046 - 100.0%
Take-Profit Targets:
1) 3.149 - 12.5%
2) 3.306 - 12.5%
3) 3.332 - 12.5%
4) 3.474 - 12.5%
5) 3.549 - 12.5%
6) 3.654 - 12.5%
7) 3.893 - 12.5%
8) 4.441 - 12.5%
Trailing Configuration:
Entry: Percentage (0.2%)
Take-Profit: Percentage (0.25%)
Stop: Breakeven -
Trigger: Target (2)
QTUMUSDT buying signal crypto analysisMarket in our way to white BC buying area after formation of white sequence (III) RR: 3:1
