$QTUM Jaw-Dropping Bullish Blast Shakes the Charts!BINANCE:QTUMUSDT
Price Levels (as marked on the chart):
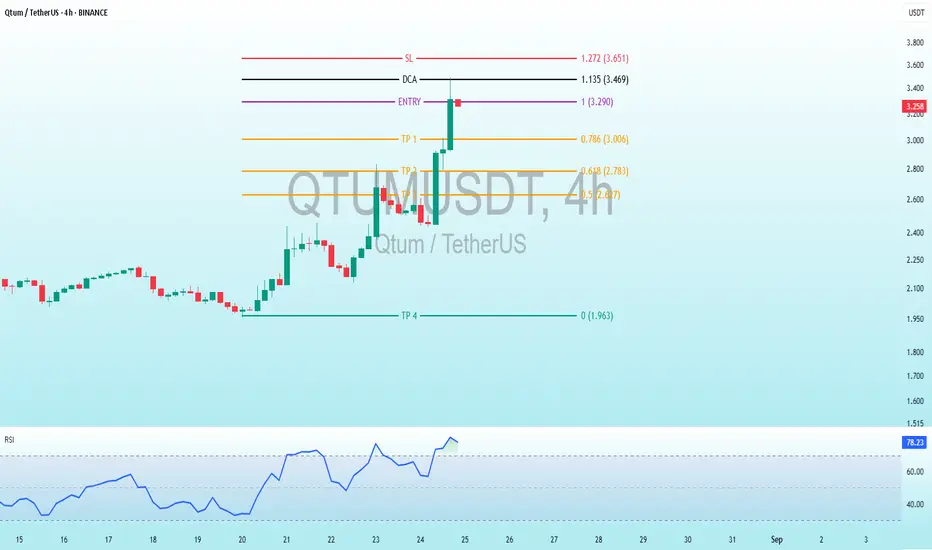
SL (Stop Loss): 1.272 (3.651)
DCA (Dollar Cost Averaging): 1.135 (3.469)
Entry: 1.3 (3.290 - 3.270)
TP1 (Take Profit 1): 0.786 (3.006)
TP2 (Take Profit 2): 0.618 (2.783)
TP3 (Take Profit 3): 0.5 (2.627)
TP4 (Take Profit 4): 0.1963
Current Price: Approximately 3.290 - 3.270 (based on the right-side price scale)
RSI (Relative Strength Index): Shown at the bottom, indicating momentum. The RSI has recently risen to 79 - 78 , suggesting strong bullish momentum and potential overbought conditions.
Key Levels
The price has risen above the Entry level (1.3) and is currently below the DCA (1.135) and SL (1.272) levels when adjusted for the price scale (3.290 is above 3.270 entry). This indicates the trade is in profit, and the stop-loss has not been triggered.
It has surpassed TP1 (0.786) and is approaching TP2 (0.618) on the adjusted scale. The take-profit levels seem misaligned with the current price range, suggesting a possible scaling issue or typo in the chart annotations.
Support and Resistance: The sharp rise indicates strong buying pressure. The previous resistance around 2.90 (entry) has been broken, and the next resistance could be near the DCA level (3.469) if the uptrend continues.
RSI Analysis
The RSI at the bottom shows a significant upward trend, moving from a neutral region (around 50) to 79 - 78, indicating strong bullish momentum and potential overbought conditions as it nears 80.
The recent spike aligns with the price surge, confirming robust market interest, but the high RSI suggests a possible pullback or consolidation soon.
Trading Strategy Insights
Entry and Exit Points: The chart suggests a trading plan with an entry at 1 (3.290), a stop-loss at 1.272 (3.865), and take-profit levels (TP1 to TP4). The price has exceeded TP1, indicating profitability. However, the TP levels (e.g., 0.1963 for TP4) seem inconsistent with the current price range and may need correction.
Risk Management: The SL at 3.651 is above the current price (3.290 - 3.270), meaning the trade is secure. Adjusting the stop-loss to break even or above TP1 could lock in gains.
Potential Next Steps: If the uptrend persists, TP2 (2.783) is the next target. The high RSI (79 - 78) suggests caution for a potential reversal or pause, so traders should consider taking profits or waiting for confirmation.