Have a coffeeThe Coffee and the dollar
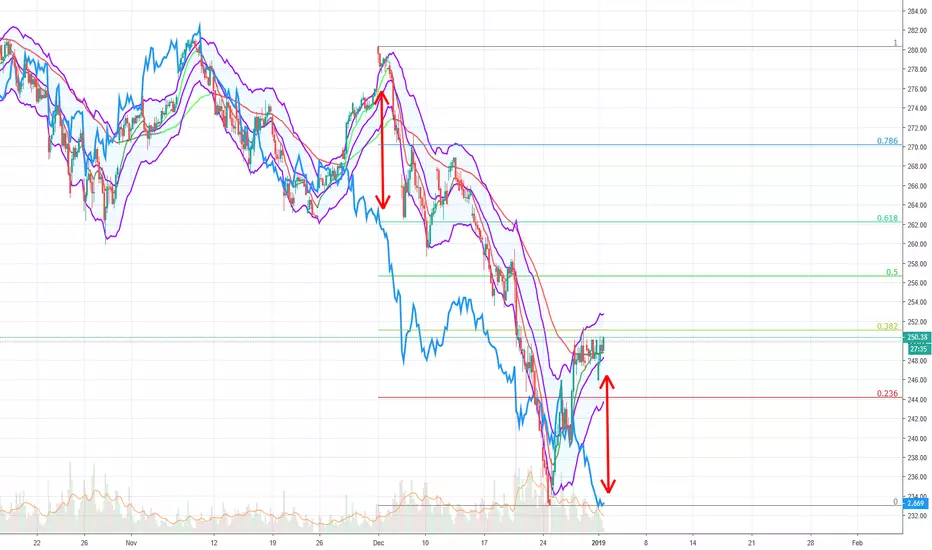
The price is above a key support zone, between approximately 96.4 and around 95, it fails to recover because exports are in sharp decline as the currencies of the exporting countries are affected by this devaluation against majors like the US dollar, tending to limit sales so as not to lose too much. All of this, has caused exports fall from the country that produces the most (Vietnam) by almost 40% compared to January (customs data published in the session on Friday). So this is a commodity that is particularly affected by the weight of the US dollar: the USD should continue to strengthen during 2019 (especially the second half), it is likely that coffee will continue to remain weak (except for sudden changes in the supply/demand ratio ). Now technically, however, it could be a good entry into this area (97) with a short-term target towards 104. A closure below 95, will ensure that the descent continues until new period lows.
Rates

TWO is a good REIT to considerI like this name because of its massive dividend yield. This isn't uncommon in REITs, but TWO carries one of the larger yields in the industry. Their financial statements are healthy and the primary risk here is the state of interest rates in the US. My harmonic analysis shows two sin waves: a red and a pink. The red represents a macro trend wave and until the FED raised rates incessantly in 2018 this curve fit well to the price action. However, we can see that the trend was disobeyed mid to late 2018, something I attribute almost entirely to the interest rate risk every investor was fretting about at the time. REITs were hit hard during this period. The pink wave represents a mico-trend and still fits very well with the price action. Rates have cooled significantly since their 2018 highs, and so I believe this ticker has room to the upside. This is a long term play, so if you don't intend to store this capital for 3+ years then avoid this name as the volatility for day trading and options plays is relatively non-existent. However, with a 10+ year horizon one can capture an outstanding dividend yield while adding to positions at the troughs of the sinusoidal pattern. Doing this successfully will likely bolster dividend yields with capital gains.
The primary risk here is that US interest rates are still near historic lows. Unless the FED sees need to continue quantitative easing the path of least resistance is up. This bodes ill for REITs and could invalidate the $5 trading range I've highlighted. Until then, however, I see no reason why this name would deviate from its historic price pattern.
As always, scale in near the lows.

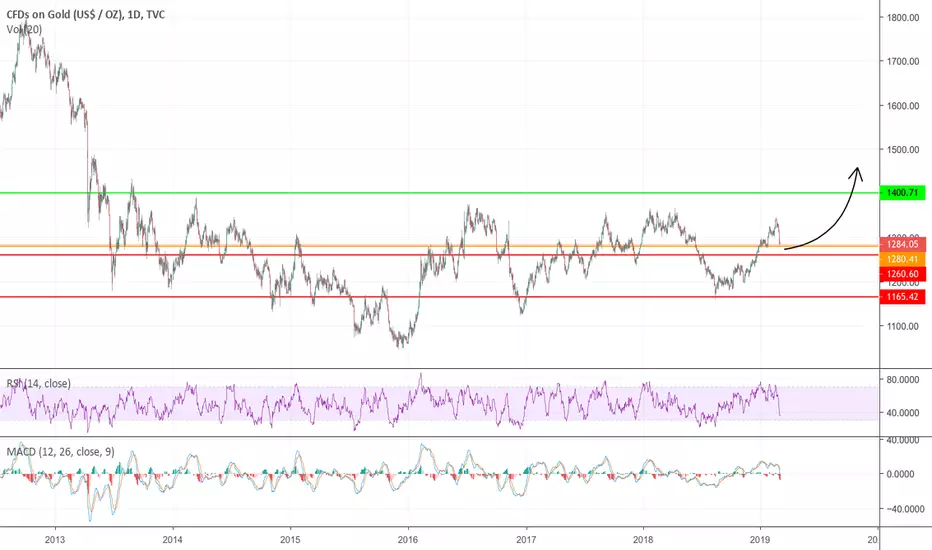
Gold: still safe (BUY)Up and Down
The price having started going upward to test the resistance placed in area $ 1350 has created a series of sales which brought it back down again, with a retest of the static support located at 1280 $. Both technically and fundamentally the scenario has not changed: the trend remains bullish and would be invalidated in the medium term only if the static holder at $ 1265 is violated downwards, and there was a daily closing below it.
Technical and fundamental
From a technical point of view, the main EMAs are open upwards (uptrend) and the ichimoku cloud is supporting the price, obviously taking tf into consideration from the daily up. From a fundamental point of view, the uncertainty that revolves around the Fed and its monetary policy in 2019, expected softer than expected, is doing devalue the US dollar, which in the coming weeks / months, will be the crucial factor that will bring this commodity to test the area of about $ 1400 by the end of the first half of 2019.
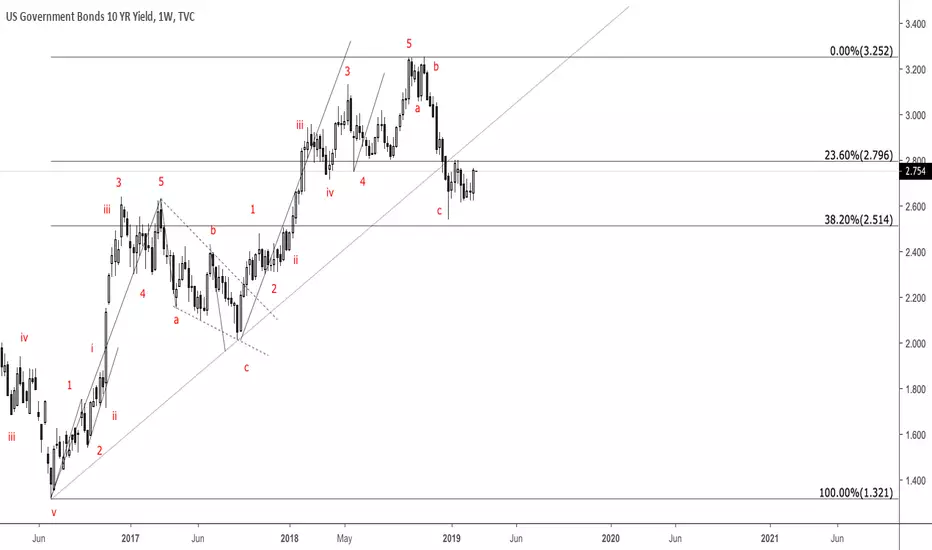
US10s finding support?Market is currently around a number of support levels ranging from 2.796% and 2.514%
=> This area is going to be very difficult to break because it also includes the uptrend which started from July 2016.
Here it is worth pointing out that the market has seen the leg lower via the ABC count. Consildation has kicked in for a lengthy period of time and we are set to begin trading more dollar strength.
Watch for signs of a base forming here, the setup weakens below 2.51%.
Thanks and good luck
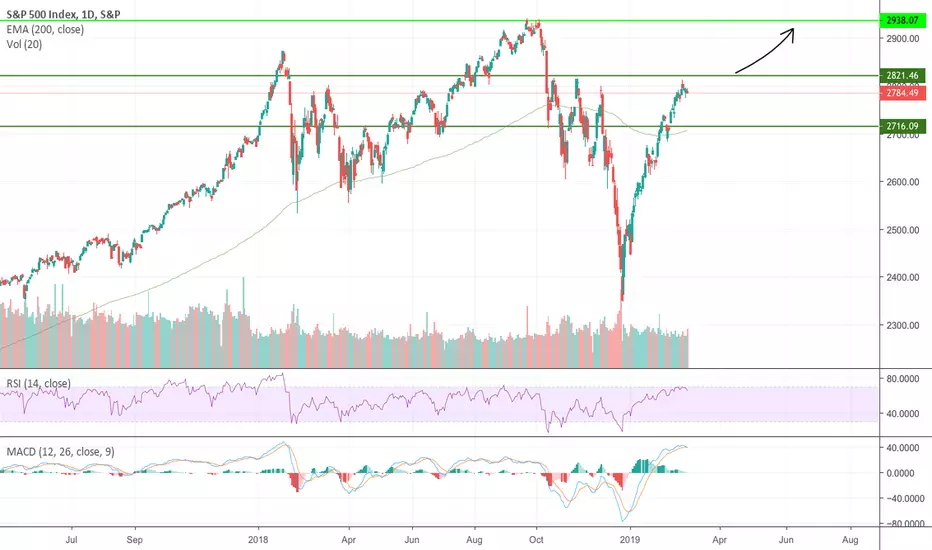
Make American stock market rise again Something is moving
American index are still in this uptrend that we have exploited in past sessions by positioning ourselves on a long trade. So far, the SP500 price is reaching its resistance area around 2820 points: from here it is very likely that an important retracement can start if the price does not breach this key level and confirm its breakdown.
Toward the highest (?)
If the static resistance does not yield, SP500 will try to retest the dynamic support identified by the EMA20 on weekly periods, passing around the area near the 2715 points; if the rise in the indexes should continue, the target that SP500 will point will be in the 2936 area, toward the highest historical price. In any case we will wait to reach the 2820 points before entering the market.
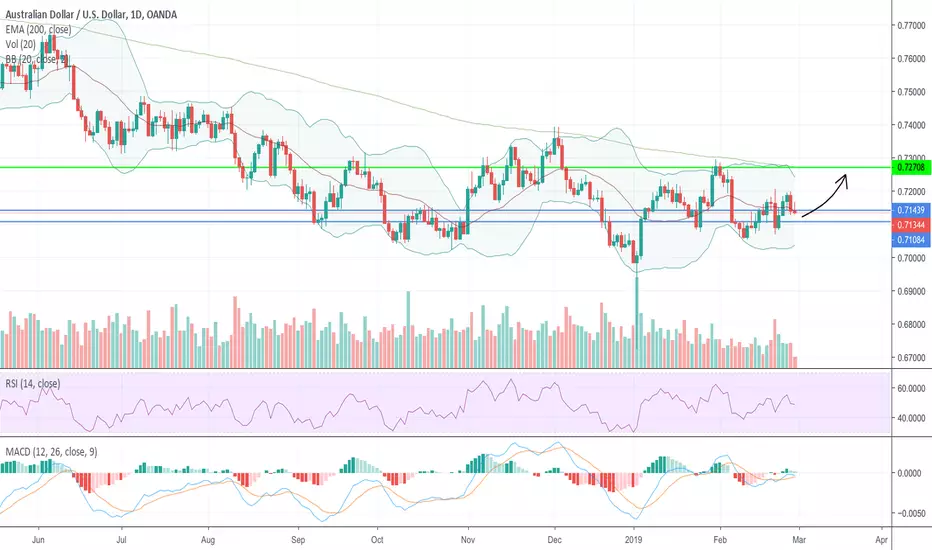
The game of Aud/UsdPrice movementIn
In yesterday's session price is returning near a key support zone. In fact, at 0.7144 we find the dynamic support identified by the EMA2O daily, while at 0.7108 is located the 76.8% of the Fibonacci retracement: this area should not yield but, because of the macroeconomic scenario that has been configured, it should bounce the price towards a target around the resistance identified by the EMA200 daily at 0.727; if it were broken upwards, the trend will continue until the next static resistance ( 0.733 )
Fed & Powell
The Fed, which will not raise rates in the very short term, and therefore with a softening of monetary policy, the dollar should continue to lose strength until Powell's signals of change arrive.
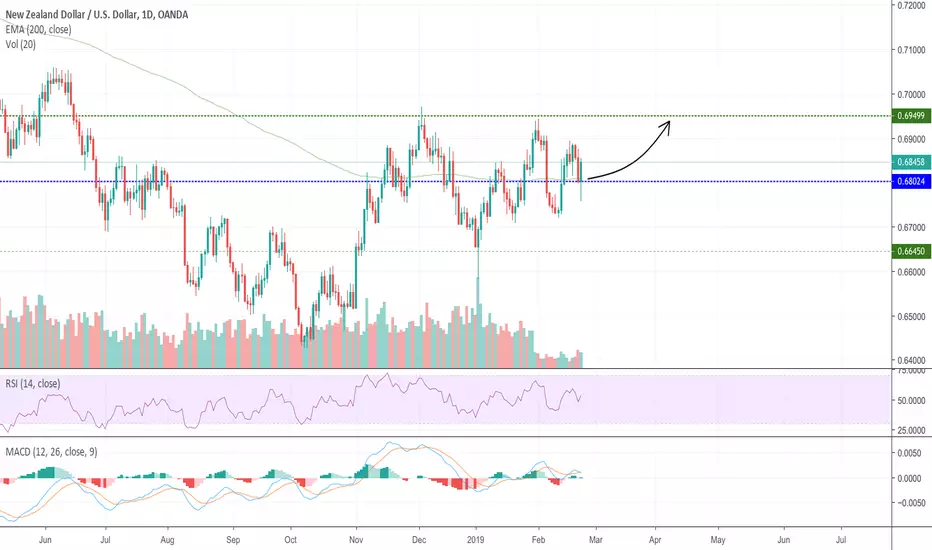
NZD/USD: nice and easy trade Technical Analysis
The price is back to test the main dynamic support on daily TF, or the EMA200 periods that passes about 0.68. A few millimeters higher there is another key support, the static one identified by 61.8% of the Fibonacci retracement: a price rebound would make a bullish scenario for investors.
Macroeconomic Analysis
This scenario is also confirmed in the fundamental, as it is very probable that until the end of March/April the US dollar may suffer devaluations following the decision of the Fed: the restrictive monetary policy that they announced at the beginning of 2018 will stop until a clear improvement in the US economy will not be noticed.
Our target
The first target we expect to achieve is the one in area 0.695, where is located the resistance identified by 50% of the Fibonacci retracement.
Hang Seng: it's time tu rise The price
The price is back above the EMA200 on daily time frame after 9 months of downtrend. In fact, since the index has scored new absolute highs above 33000 points, the price has started to fall until the support around 24500 points and from here it has restarted.
Technical analysis
Technically the price is now above the new dynamic support (identified by the EMA200) and from the static one formed by 38.2% of the Fibonacci retracement, respectively at the price of 27400 and 27700 points approximately: until the price remains above these levels , this index will tend to be lateral/bullish with target on the resistance placed at 30,000 points. If both supports yield, it will test again the area of 24000 points.
Our forecast
In the very short term it is very likely that the rising of price is the most valuable hypothesis, in line with the other main global indices. The returns to the bearish side is expected on the second quarter/half of 2019 when the markets will again be affected by the restrictive policies of the banks plants.

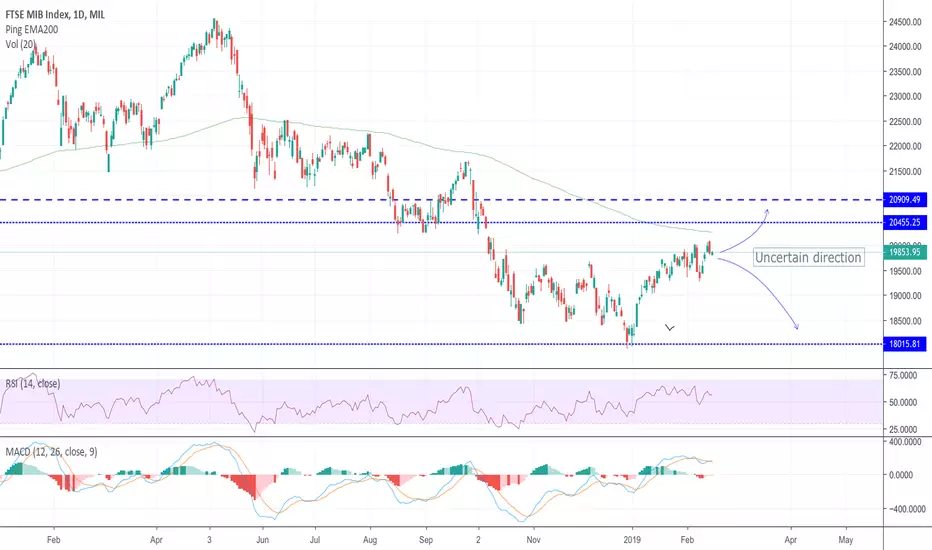
FTSEMIB: uncertain directionVery short term
In line with the other world indices, this upward trend driven by the resumption of American prices will tend to continue. The level to which it will aim in the very short term is the dynamic resistance identified by the weekly EMA200 at an altitude of 20450 points: from here it will be understood whether it will have the strength to continue towards 20900 points breaking it and confirming the upside break, or if it will be rejected by taking over of the main trend.
Short and mid term
From a technical point of view in the short/medium term, the Italian index is still bearish. The trend is confirmed even from a fundamental study: the unstable political-economic situation of our country and the growth forecasts for 2019 ( near the flat level ), with the general European situation also in the balance, it is very probable that soon we will assist to a new drop in prices and in particular on the FTSE MIB that will return to bet 18000 points.
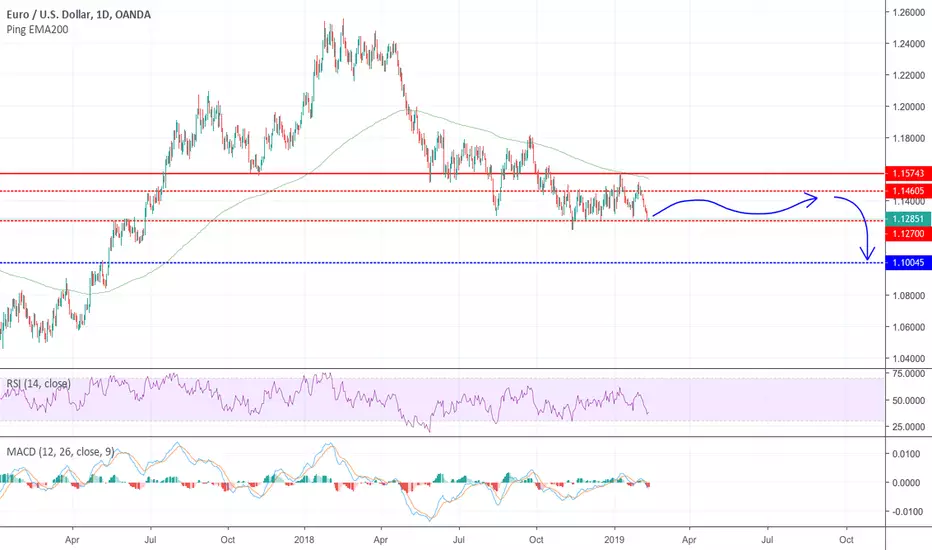
EUR/USD and the Fed !New channel
The price has once again reached a key level on a weekly time frame: at the price of 1,127 a static support has formed, which tends to bounce the price and keeping it within this channel, with resistance at 1,146.
Very short, short and medium term
The trend remains bearish in the short term, while in the medium term it continues to be strongly bearish: with the macroeconomic scenarios that have been configured, the target area is between 1.10 and 1.08, despite this we believe that this week there may be a price rebound from this area because of the conference that will be held today by the president of FED Powell, who should still reassure the market, supporting the new very short-term monetary policy that will not lead to other restrictions.
Consequences
This should result in a sale on the US dollar by investors, devaluing the USD against the other majors, and therefore also against the euro (which remains highly unstable currency and will continue to depreciate for most of 2019).
Join us for further analysis on:
Instagram : www.instagram.com
Telegram: t.me
Facebook Page: www.facebook.com
Web: www.bfcminvest.com
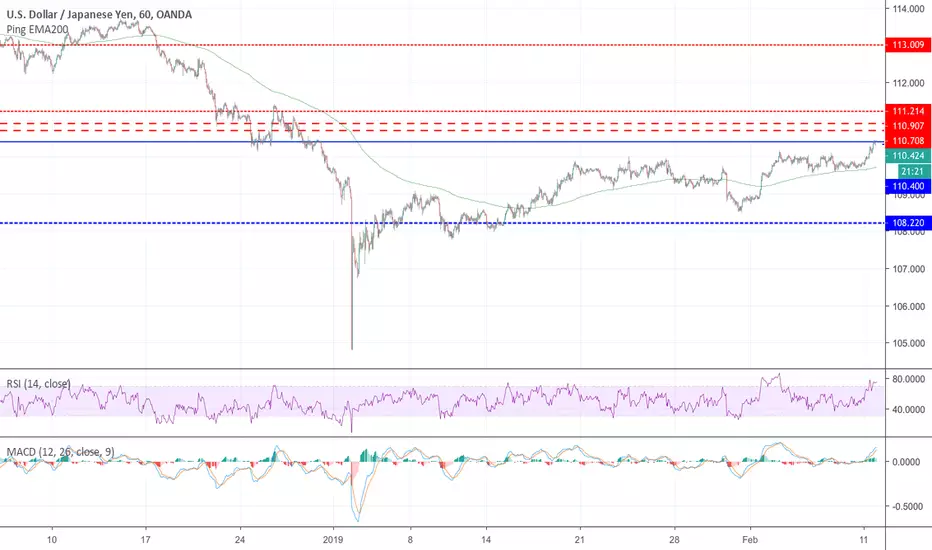
MAJOR update on USD/JPYMacroeconomic side
The price in the last sessions is continuing to maintain this lateral / bullish trend without giving too many signs of inversion, supported by a recovering dollar. This week will be essential to understand the short-term trend that will follow both the dollar and the yen: in fact, tomorrow the Fed chairman will make a conference, from which investors expect him to keep his very short-term decision unchanged (do not force the market and the US economy with further monetary restrictions). On the other hand, on Thursday, the Japanese GDP data will be published, expected positive and clearly improved compared to previous ones: this should strengthen the Japanese currency against the other majors.
The technical side
Technically there is a very strong resistance area between 110.70 and 110.90: the main EMAs (daily, weekly and monthly time frames) pass in here and the 110.90 should not be violated on the upside due to the macro-economic factors just mentioned. If this happens it is because the short-term trend has become long and the target area will become the one between 113 and 115
Join us for further analysis on:
Instagram : www.instagram.com
Telegram: t.me
Facebook Page: www.facebook.com
Web: www.bfcminvest.com
Silver is a Screaming BuyAll long-looking indicators point to silver being undervalued vs gold. Top chart shows silver candlesticks vs gold red line as percentage returns since 1998. Middle indicator is the Trader's Dynamic Index (TDI) which holds a combination of moving average, volatility and momentum trends. Bottom indicator is the infamous Gold:Silver ratio.
Silver is sitting on top of the .382 fib level support shown in the chart, which is where the current cost of production resides around $14.75/oz. Low risk, high reward - this is a perfect setup for those interested in making an inflation play going toward negative rates, QE4 and the end of the petrodollar.
% Returns Analysis: Silver below Gold -> Silver undervalued
Fibonacci Level: Strong support at cost of production near $14.75/oz
TDI: Bullish divergence in formation
Gold/Silver ratio: 83:1 -> Silver undervalued

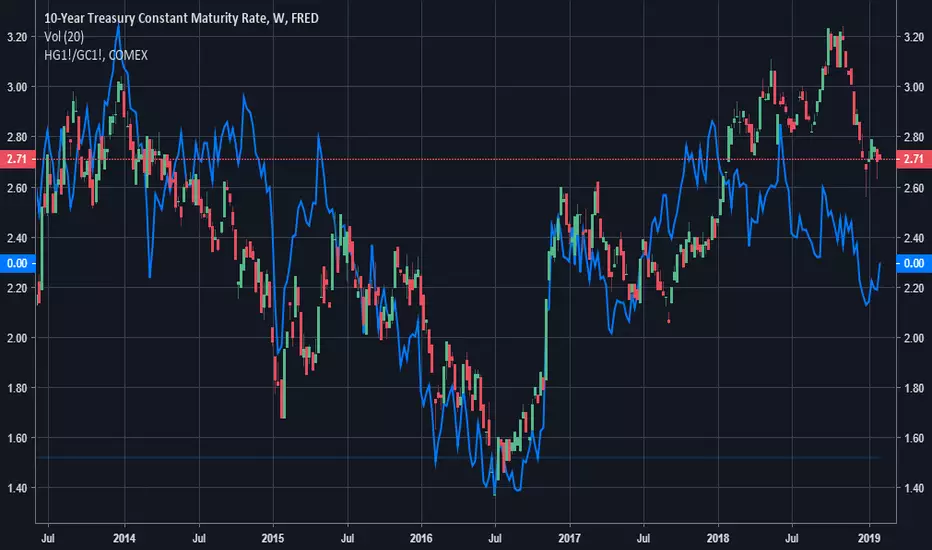
Copper / Gold ratio pointing to lower Treasury yieldsCopper / Gold ratio pointing to lower 10 year Treasury yields around 2.40%. US yields seem to high on many measures but improving CESI and too much safety bid lately can push yields even higher before the real downturn begins.
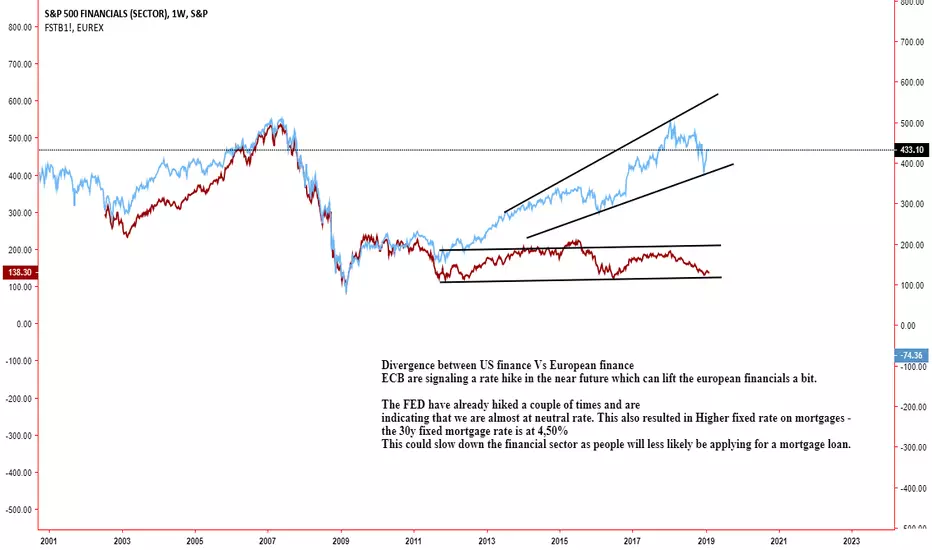
S&P financials Vs. European FinancialsComparing US financials with the EU financials.
Have DBK on the rader for a long position.
Precious Metals, the historical safe haven.
What can be said about gold and precious metals? Gold has always started out as sound money, followed by monetary expansion, devaluation, and eventual collapse. Take the Roman Empire for example, money started as solid gold coins which eventually expanded with a mixture of base metal, than became worthless. Remember when a quarter was silver, penny was copper, and the rest was a mixture of silver, copper? Now? They are worthless base metals. This trend continued throughout history. Here we are again. This read will go through some of the current economic conditions with some commentary and suggestions. So, let's start with some recent economic news:
7 out of 9 recessions since 1950 came after rate hikes.
Auto-Loan Delinquencies are higher today than the peak of 2008 recession.
Corporate Debt has doubled since the 2008 recession.
National, student, personal, and credit card debt is higher now than 2008. At Record Levels*
Germany and Italy GDP Growth Rate is -0.2, Japan GDP Growth Rate is -0.6
New Home Sales fell 19% in 2018. Existing Home Sales have fallen.
Auto-Sales are down on average 3%, up to 6% by manufacturer report.
Credit Card delinquencies are up 17% since Q1 2016.
Derivatives up more than $100 trillion since 2009.
China posted two-consecutive contraction in manufacturing.
1 in 3 Americans have less than $5,000 saved for retirement.
69% Of Americans Have Less Than $1000 In Savings
So, what's going to happen?
- The ugly truth is economic and monetary pain. Global economic weakness and contraction is here. Once the markets finally react to the toxicity of the monetary system, the central banks will react like they have in the passed with slashing interest rates, debt purchasing, and bond buying programs. But this time, resulting in the weakening or even failure of a currency. Let's go back to that monetary trend. Gold, expansion, devaluation, and than collapse. It's obvious where in the trend the monetary system is. We should expect astronomical injection of liquidity, purchasing of debts, and QE.... as a start. There are a few nations which have foreseen this and have been buying gold like never before. So, if they can foresee the problem and offset their exposure to it.. why aren't you? Have you noticed that gold has made a dramatic comeback after the bear market started? Gold has broke $1300 barrier with ease, and continued upward even with the stock market gains. Regardless, the price of gold must keep up with inflation. This tells us that the smart investors are starting to pile into safe havens, regardless what the market or central banks do. The recent actions from the Fed have proven that the stock market is indeed a bubble. The 0% interest rates fueled the bubble, the interest rate hikes popped the bubble. We saw proof of this:
*Dec 21st, 2015 - (Dow 17,700) - Interest hiked, Dow fell 2,060 points until the Fed calmed markets by stopping rate hikes until after elections.
*Feb 2018 - Dow fell 2,244 points.
*Sept-Dec 2018 - Dow fell from 26,828 to 21,792 a drop of 5,036 points.
*Feb 2018 - Fed announces pause in rate hikes, Dow jumps 400-points.
As you can see, the Fed and interest rates have a direct impact on the stock market. Rising interest rates have put Emerging Markets in a tough spot, as 2018 saw EM Currencies drop anywhere from 20-50%. Recession is on the horizon, even in Europe. The fear is that the ECB will be powerless to calm any financial turmoil as ECB interest rates are already negative and QE is still being implemented. In the US, the Fed will slash rates to 0% immediately, followed by QE, but, this time the dollar will take a severe hit.
--------------------------------------------------------------------------------------------------
What to do from here?
You see the storm far off and it's growing as well as coming towards you but where you stand, it's relatively calm. The problem is complacency in the calm or believing the storm is long away from hitting. But, storms are variable and can move any direction and gain speed. So, why not acknowledge the problem and prepare now? Now that gold is not $2,000+/oz. Why not look into gold mining stocks that are up 8-25% since November? Start putting more into precious metals and less into stocks, forex, and crypto. 15%-20% of your portfolio is not enough. Stocks, currencies, crypto can drop 90% in less than a year, but precious metals will always have value. Ask yourself how long it took for the Dow to reach 26,600 points and then ask yourself how long it took to drop 4,000 points? Take a moment to think about that. 10-years to grow to 26,000 vs 4-months to fall 5,036, where is the stability in that? This isn't a case of "eventually it will happen", it's already begun. The gains and drops are volatility that has set in.
Gold Price Targets: North of $2,000 / OZ. Realistic, 3-5
Is Cryptocurrency a good investment?
No. It is now commonly known as digital fools gold. Without internet, you can't access or spend it. It has no value, its another form of fiat. As long as the people believe crypto is worth something, it has "value" but based on its current price, investors and traders are realizing its true worth. Worthless. Nothing. Nada.
What are some good mining stocks?
BTG - WRN - ASM - AUY - GLD, most of these stocks are up anywhere from 10%-20% (1-Week to 3-Month). Compare that to stock market, which are down on average 20%.
What stage are we at and when could this happen?
We're Q1 of 2007, heading into Q2. Remember, Q2 is where all the trouble began when rates adjusted.
--------------------------------------------------------------------------------------------------
In conclusion.
The numbers are out there, you can see it all for yourself. It doesn't take an expert to see the numbers are bad and the financials are toxic. It just takes effort and interest. If we take all of our financial news from major financial news organizations (stars with C and the other with B), then we're not going to see it until after it hits. Just remember, their "experts" said there was no recession coming and this were great. A recession isn't official acknowledged until its already here. What stage are we at and when could this happen? We're Q1 of 2007, heading into Q2. Remember, Q2 is where all the trouble began.

Is this an opportunity on USD/CAD ?The price has invalidated the uptrend in the very short term, going to break down the level placed at 1.317, that was a static support that should have rebounded the price and continue the long trend. After Powell’s words, investors continued to sell the US dollar, making it weaken against all the majors.
The Fed has been clear: at this moment it is difficult to think about further increases in interest rates, as the US economy is responding well at these levels (2.25 / 2.50%). At least for the entire first half of 2019 it will be difficult for him to return to his steps.
The market will be hostile to a strengthening of the US currency.
This pair is particularly uncertain because the Bank of Canada also does not intend to change its monetary policy, so it is very likely that it will continue to proceed sideways for the next few months in the channel between the support at 1,298 and resistance at 1.33.
It is advisable to remain flat until the fundamentals change or one of the two levels mentioned above is broken.
It should be noted that on a daily tf, the price has reached the dynamic support identified by the EMA200, which seems to have held: it could be a good opportunity to enter the market from here with target the level of minor importance placed at 1.326 with a “buy“ order.

Business Cycle vs G3 Govt Bond YieldsBusiness cycle points to lower long term government bond yields. US 10 year yields seem to be the most at risk.
LONG LT BONDS & Bond proxies
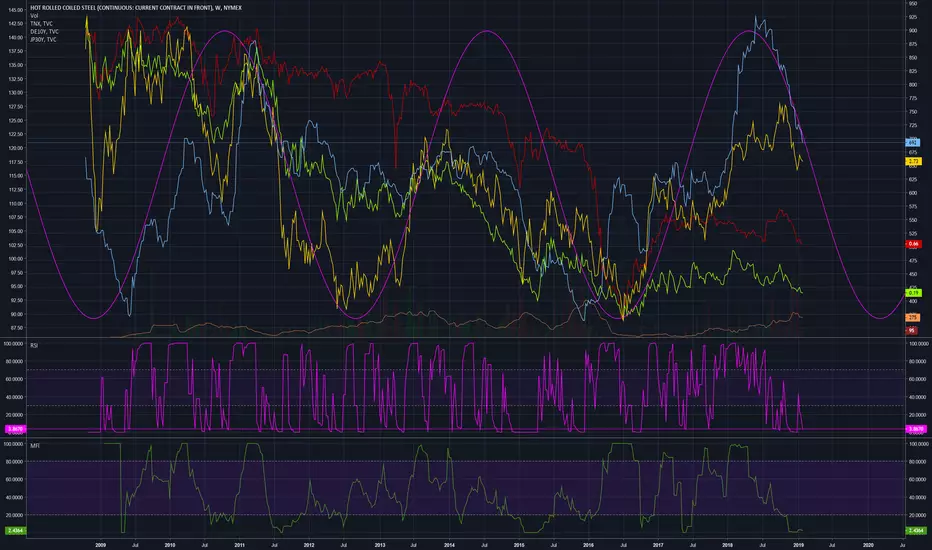
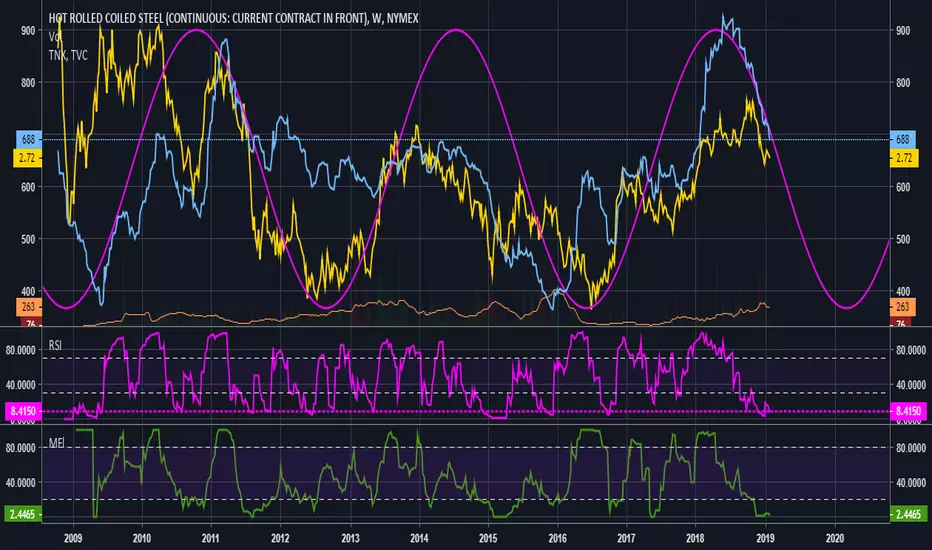
Business Cycle points to more downside in Steel and Rates Business cycle has turned down again as depicted by steel prices and long term treasury yields. Last time, it was Chinese money printing that kick started the cycle again. This time Chinese are still slow to inject meaningful liquidity to the system. Once they get going, it takes 9-12 months for the economy to feel the real impetus. Hence, business cycle is likely to put pressure on rates and risk assets at least until the end of 2019.
LONG TLT and SHORT Steel Companies
EUR/USD and Mario Draghi ?! Ready to fall !The trend is bearish in the short and medium term, while in the very short it remains lateral. With the last conference of the ECB governor, the investors have been surprised by a sudden change of vision by Draghi, who said that as early as the first quarter of 2019 could start to issue money at 0 interest rate in favor of the banking system since the European economic situation is getting worse. Neither deposit rates and interest rates will be increased.
The main trend is now bearish in daily and weekly time frame, the price continues to move under the EMA 20 periods, and under the bearish ichimoku cloud, for the static level for a trend inversion (at 1.15) seems to be too strong to be passed in the short term, the price is rejected since the end of September.
The target, at this point, if Draghi confirmed the hypotheses declared in the conference on January 24th, would be in the support zone between 1.10 and 1.08.

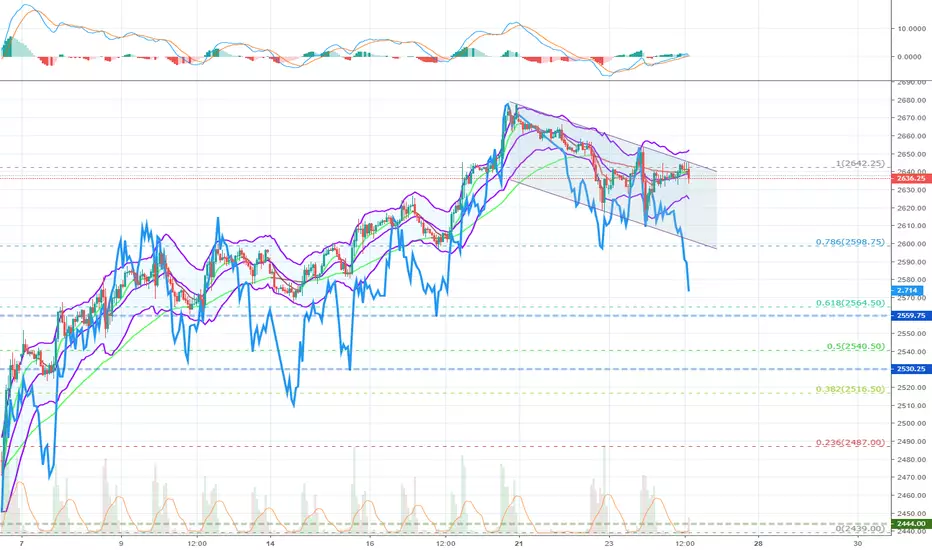
Spoos in a bullflagIndexes entered the bullflag pattern.
At the open we should see a clear signal what will happen.
As of writing this post, the US10Y is falling and diverging a from stocks a little.

New Year's MadnessLooking at ES1! and all the PPT interventions can make one wonder how to invest in a sick market such as this one. It is hard indeed, better stay put.
The night has brought us a slump in equities but at the open the magic buyer appeared and bought... EVERYTHING carrying the market towards green numbers.
Meanwhile, rates seperated from equities, and judging by who is right most of the time we can hope for another slump in equities coming soon. Volume is showing weakness in this correction trend in SPX and we can see higher volume on some selling pressure.
I stay bearish and hope that the market forces can defeat all the political agenda standing behind the 10-years-long debt-fueled false "recovery" thus ending the Fed project which was doomed to fail since the very beginning. Trump is panicking and acts like Enron's CEO. He only wants to boost stock market and nothing more. He will do whatever the bankers say to keep markets from falling because he knows he will lose the job if it falls another 20%. I guess he may even back off from the idea of building a wall so that there would be no government shutdown - just to keep investors happy. Will the markets win? It is hard to tell. IMHO the only thing which can keep it from going down is Fed's statements. This is ridiculous.
All hail the market Gods!
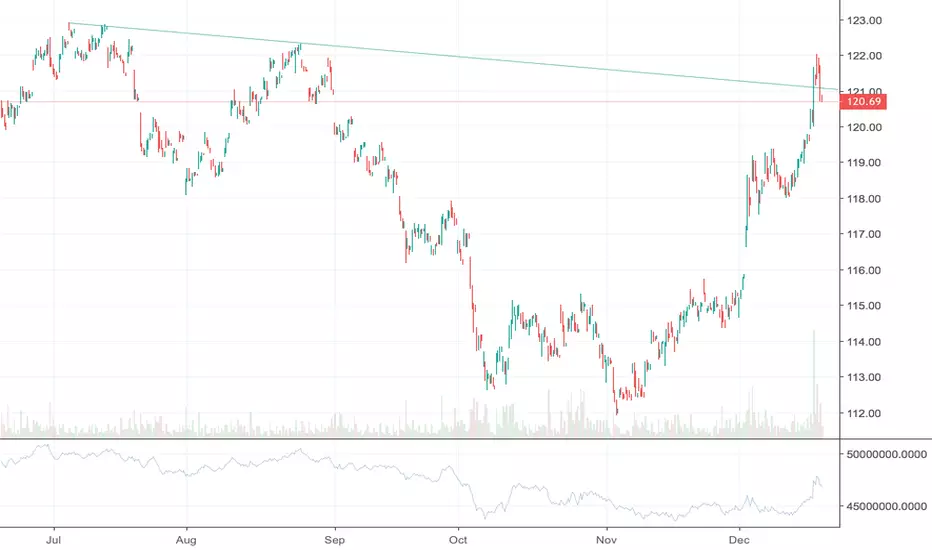
Blowoff Top in TLTDespite continuing equity market weakness today, TLT had a reversal on it's daily candle (not shown). Looking at the resistance line shows that it was violated, but only briefly before racing back below, indicating a reversal of direction. Should easily come back down to around $119 and potentially $116 as a more aggressive target. Could even indicate a reprieve from equity market weakness for a short period. If you don't want to go short or buy puts, you can also buy TBF the short 20+ treasury ETF.