Markets embrace the Higher-for-Longer themeIt has been a big week of central bank policy announcements. While central banks in the US, UK, Switzerland, and Japan left key policy rates unchanged, the trajectory ahead remains vastly different. These central bank announcements were accompanied by a significant upward breakout in bond yields. Interestingly most of the increase in yields has been driven by higher real yields rather than breakeven inflation signifying a tightening of conditions. The bond markets appear to be acknowledging that until recession hits, yields are likely to keep rising.
Connecting the dots
The current stance of monetary policy continues to remain restrictive. The Fed’s dot plot, which the US central bank uses to signal its outlook for the path of interest rates, shows the median year-end projection for the federal funds rate at 5.6%. The dot plot of rate projections shows policymakers (12 of the 19 policymakers) still foresee one more rate hike this year. Furthermore, the 2024 and 2025 rate projections notched up by 50Bps, a signal the Fed expects rates to stay higher for longer.
The key surprise was the upgrade in growth and unemployment projections beyond 2023, suggesting a more optimistic outlook on the economy. The Fed’s caution is justified amidst the prevailing headwinds – higher oil prices, the resumption of student loan payments, the United Auto Workers strike, and a potential government shutdown.
Quantitative tightening continues on autopilot, with the Fed continuing to shrink its balance sheet by $95 billion per month. Risk assets such as equities, credit struggled this week as US yields continued to grind higher. The correction in risk assets remains supportive for the US dollar.
A hawkish pause by the Bank of England
In sharp contrast to the US, economic data has weakened across the board in the UK, with the exception of wage growth. The weakness in labour markets is likely to feed through into lower wages as discussed here. After 14 straights rate hikes, the weaker economic backdrop in the UK coupled with falling inflation influenced the Bank of England’s (BOE) decision to keep rates on hold at 5.25%. The Monetary Policy Committee (MPC) was keen to stress that interest rates are likely to stay at current levels for an extended period and only if there was evidence of persistent inflation pressures would further tightening in policy be required.
By the next meeting in November, we expect economic conditions to move in the MPC’s favour and wage growth to have eased materially. As inflation declines, the rise in real interest rates is likely to drag the economy lower without the MPC having to raise interest rates further. That said, the MPC is unlikely to start cutting rates until this time next year and even then, we only expect to see a gradual decline in rates.
Bank of Japan maintains a dovish stance
Having just tweaked Yield Curve Control (YCC) at its prior Monetary Policy Meeting (MPM) on 28 July, the Bank of Japan decided to keep its ultra easy monetary settings unchanged. The BOJ expects inflation to decelerate and said core inflation has been around 3% owing to pass-through price increases. Governor Ueda confirmed that only if inflation accompanied by the wages goal was in sight would the BOJ consider an end to YCC and a rate shift.
With its loose monetary policy, the BOJ has been an outlier among major central banks like the Fed, ECB and BOE which have all been hiking interest rates. That policy divergence has been a key driver of the yen’s weakness. While headline inflation in Japan has been declining, core inflation has remained persistently higher. The BOJ meeting confirmed that there is still some time before the BOJ exits from negative interest rate policy which is likely to keep the Yen under pressure. The developments in US Monetary Policy feeding into a stronger US dollar are also likely to exert further downside pressure on the Yen.
This year global investors have taken note that Japanese stocks are benefitting from the weaker Yen, relatively cheaper valuations and a long-waited return of inflation. Japanese companies are also becoming more receptive to corporate reform and shareholder engagement.
Adopting a hedged Japanese exposure
Taking a hedged exposure to dividend paying Japanese equities would be a prudent approach amidst the weaker yen. This goes to a point we often make - currency changes do not need to impact your foreign return, and you can target that local market return by hedging your currency risk. A hedged Japanese dividend paying equity exposure could enable an investor to hedge their exposure to the Yen.
This material is prepared by WisdomTree and its affiliates and is not intended to be relied upon as a forecast, research or investment advice, and is not a recommendation, offer or solicitation to buy or sell any securities or to adopt any investment strategy. The opinions expressed are as of the date of production and may change as subsequent conditions vary. The information and opinions contained in this material are derived from proprietary and non-proprietary sources. As such, no warranty of accuracy or reliability is given and no responsibility arising in any other way for errors and omissions (including responsibility to any person by reason of negligence) is accepted by WisdomTree, nor any affiliate, nor any of their officers, employees or agents. Reliance upon information in this material is at the sole discretion of the reader. Past performance is not a reliable indicator of future performance.
Rates

GOLD - Positive real rates is negative for GoldThe attractiveness of Gold is tarnished
When cash instruments yield a positive rate of return
More and more people are getting on board of higher interest rates
(Dimon, Santelli)
But u can see the Gold price has been inversely correlating with the rate of return for decades.
It's bull run in the 2000's along with the commodity bull , coincided with real rates trending to less than zero. Gold Topped a few months prior to that negative reading in 2012!
The current triple top that has been in place for he past 3 years , seems to be in danger of breaking down if rates continue up the next few years.
The key level to watch is last year's lows in October around $1611
Which I believe is a distinct reality if rates head up to 7%

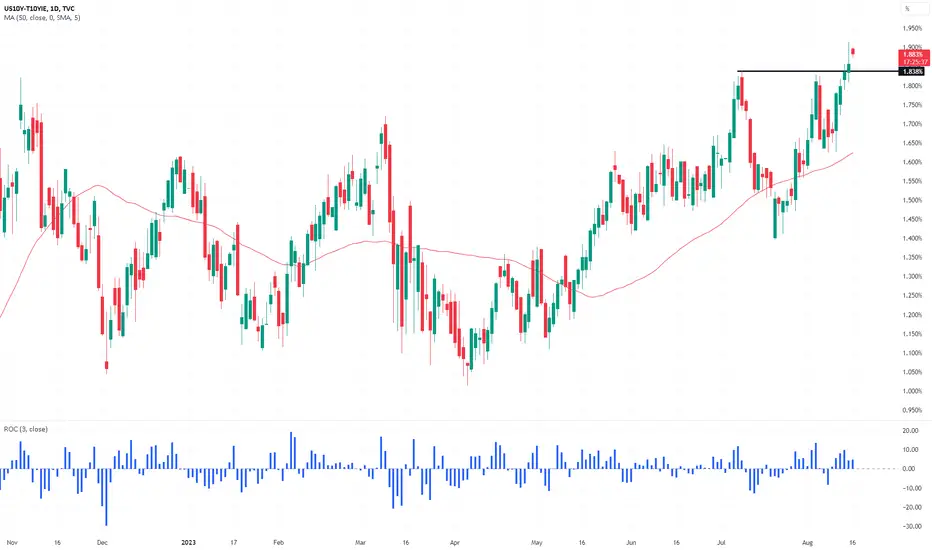
US 10 Year Yield - hitting resistanceYields Surging on the long end. Hitting resistance.
Will this level hold and give the equity markets a breather to bounce?
If this continues to surge you will see a massive selloff in equities at some point as the bond market is pricing in entrenched inflation.

Banks Across Europe Pause for Breath after Mammoth Rate Hike RunHello guys, my idea on EURGBP is that we are overall in a uptrend and due to the pause for breath after the mammoth rate hike run the trend might reverse or continue little higher before we expect a reversal to the downside.. trade safe. James ❤

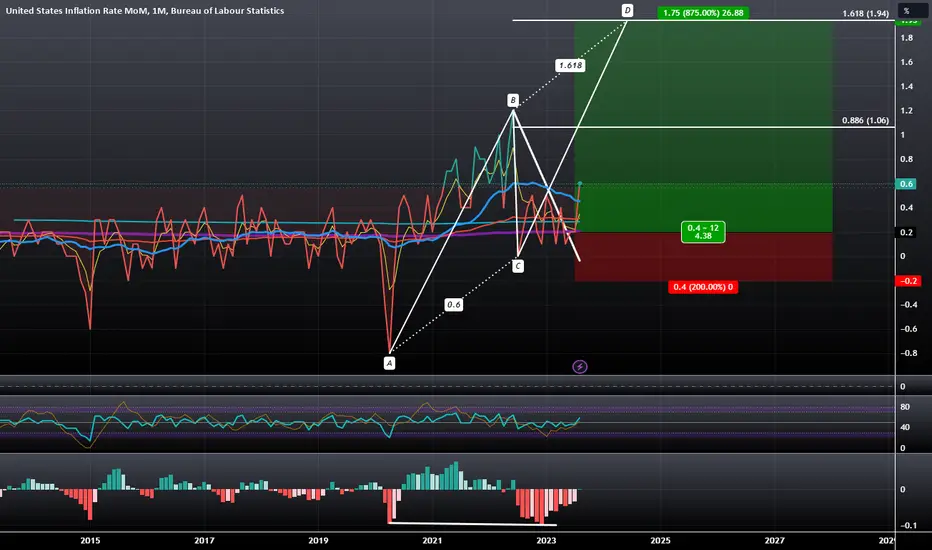
Month on Month US Inflation Harmonically Set to Rise to 1.94%This is a followup to this year-on-year inflation chart idea posted back in June 2022:
The YoY US Inflation rate has been on a trend of going down since it tested the 1.414 PCZ of the Bearish Butterfly above, but recently we have seen the MoM rate slow its descent and form a bottoming pattern with MACD Hidden Bullish Divergence at the 200-Month SMA and now we can see that the MACD has crossed positively as the inflation rate has broken out of its recent range. This harmonically puts it into position where we will likely see it at least hit the 0.886 retrace to complete a small bat pattern, but it could go out of control and go as high as the 1.618 Fibonacci Extension area all the way at about 1.94%.
One reason I suspect for the sudden stop of the inflationary decline is due to the Fed not raising rates high enough, fast enough, and then keeping them the same for the last few months. It would also seem that the year-on-year inflation rate is setting up for a similar rise, showing Hidden Bullish Divergence at the Moving Averages and likely one that will result in it going to test higher highs to around its 1.414-1.618 PCZ once area once more before ultimately crashing back down from these highs once the Fed starts to go heavy on rate hikes again. Though the timeframe may be shorter than how it is presented on the chart, I do still suspect we will have action resembling what is projected on the chart below until the Fed starts rising rates aggressively again:
This does not mean I think stocks will go up, that the dominance of the dollar will go down, or even that I think the consumer credit situation will improve. Instead, I think the rise in inflation will be fueled by energy, import, and export costs, and that this will be very bad for: Stocks, Consumers, REITs, and Banks overall, and that the Bond Yields will continue to rise at an accelerated rate.
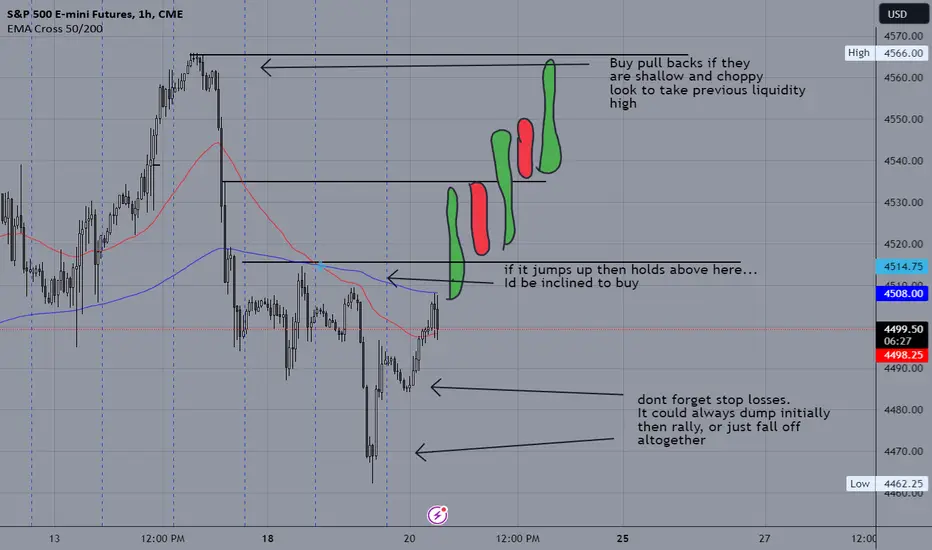
ES FOMC INTEREST RATE IDEA (LEAKED FROM *SMART MONEY*)bullish idea, there's lots of space to the upside and plenty of orders to take off the initial news burst. as long as we move up follow the plan. if we move down, and only if you are not already in a position, i'd take smaller longs and add later only if it comes back to the initial idea.
if price falls to the depths of hell, well, fine. just short the first pull back and come off break even for the day and wrap it up no hard feelings. keep it easy guys it aint stressful for real.
delete this message after you read it they are watching your activity nvm this message will self destruct
USDJPY: Thoughts and AnalysisToday's focus: USDJPY
Pattern – Ascending Triangle Pattern
Support – 146.50 - 144.75
Resistance – 147.92
Thanks for checking out today's update. Today, we have run over USDJPY, breaking down the overall price picture, levels, and patterns and incorporating moving average and RSI into the analysis.
The USDSJPY continues to be locked up in a bullish continuation pattern. If we see a break above this pattern, we are interested in how buyers handle being back into a supply and resistance area. An area that stopped the last main rally. On top of that, the RSI is also showing lower highs as price has made higher highs. This could be a sign of divergence, but we will continue to watch if buyers can make a higher breakout.
If we see a break lower, we will look to 146.50 and 144.75 as potential support areas.
Heads up: BOJ policy rate and policy statement are due on Friday.
Have a great day and good trading.

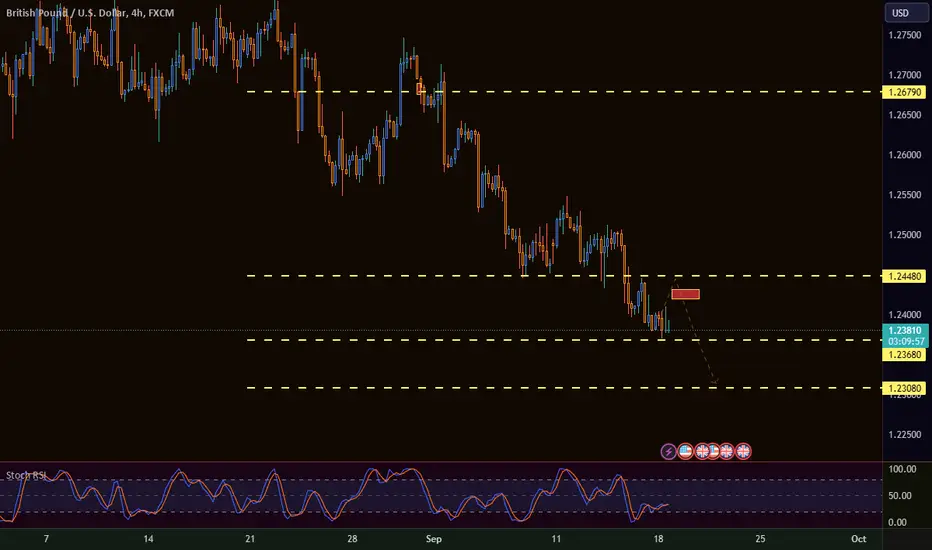
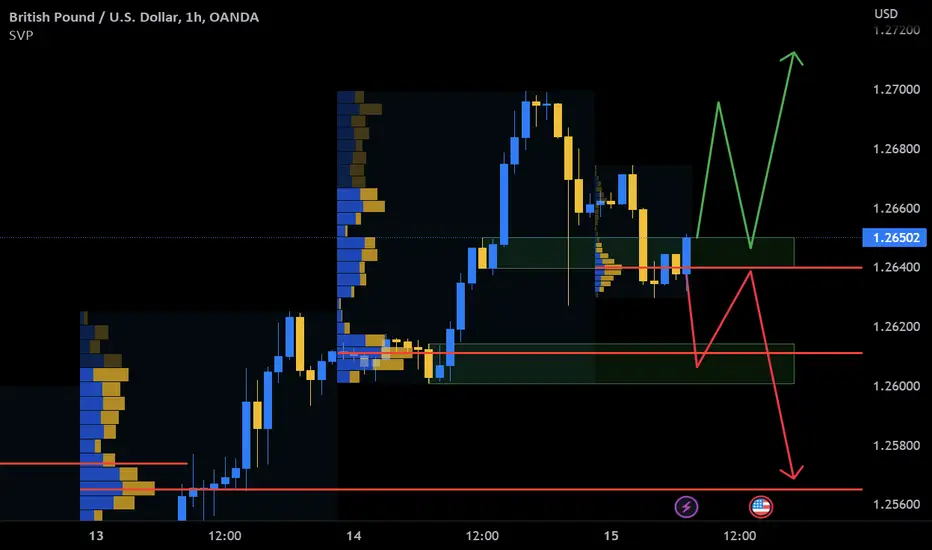
GBP/USD Forecast: Analyzing the Future OutlookOver the course of the past two weeks, the GBPUSD currency pair experienced a pronounced decline, breaching the pivotal monthly support at 1.2448. Notably, there was a subsequent rally to retest this critical level during the Friday session of the preceding week, following the initial breach observed on Thursday. In the upcoming trading week, our strategic outlook is anchored on the potential for a price resurgence, with an aim to revisit and validate the 1.2448 level before anticipating a subsequent descent, as indicated by the directional arrow.
China is going to do something different this timeChina will print, there is no way around it, at the same time the dollar will fall, I do not know how they will pull that rabbit out of the hat but they will, China will get richer while the street americans get stiffed by tough financial conditions and high rates as it is right now, chinese money is going to push-up the SP500, SP500 at this time and place is a global market, not only american anylonger... does not matter how financial condition will get strict in america, international big and smart money will get in anyway, It is a new world order...
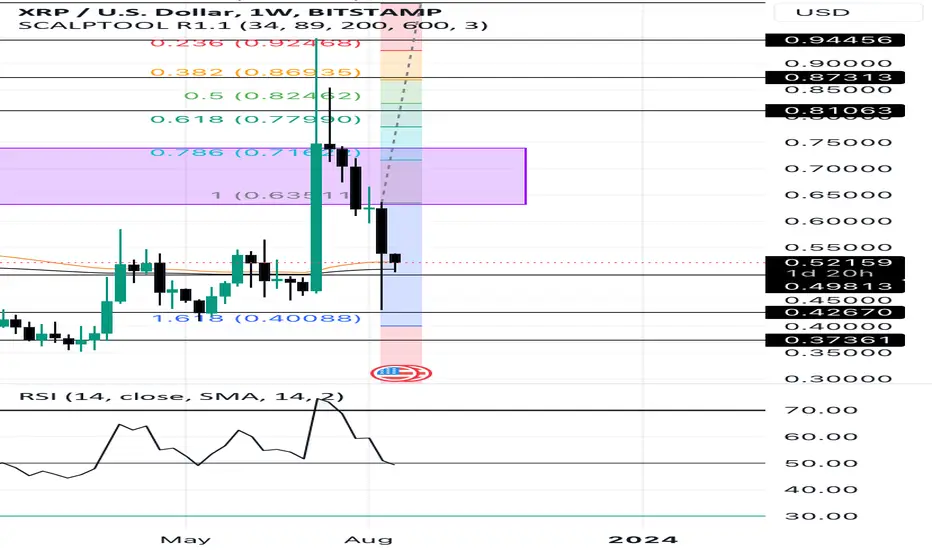
XRP Rocket? I believe xrp will settle here, buy to $1 and sell back off towards the .37 range
My Entry: 0.523
SL: 0.48418
TP1: 0.55
TP2: 0.6
TP3: 0.69
TP4: 0.73
TP5: 0.79
TP6.: 0.85
TP7: 0.9
TP8: 0.93
TP9: 0.95
TP10: 0.97
TP11: 1
A gold traders’ playbook: how gold could trade into year-endGold has been shunned by investors, but many are now questioning if the yellow metal is nearing an inflection point, for a potential turn, or should we position for further downside.
With US growth likely at a peak and as good as it gets, gold longs partly flushed out, positioning paired back and sentiment as bearish as we’ve seen for years, could we be seeing a low?
Tactically, I feel it is too early to see a resumption of a lasting bull trend and I am in favour of selling rallies into $1925. However, I am also incredibly enthused by the resilience of gold to ‘only’ decline $100, despite rising US bond yields and a stronger USD.
Unless the investment case radically changes – which I lay out below – the risks are skewed for near-term downside, although there is a growing potential for a reversal and strong rally into year-end.
The technical set-up
Since rejecting the $1981 supply zone on 20 July the ensuing bear trend seems to have hit exhaustion, with gold shorts starting to pair back exposures – there is a risk a short covering could take price into the 38.2% fibo of the $1987 to $1884 decline at $1925, which could offer better levels to initiate swing shorts.
Trading intraday has been a challenge for many day traders as volatility has been so low – Gold’s 30-day realised volatility has fallen to 8.3% and the lowest since July 2021. We also see the 5-day average high-low trading range at $14.11; one of the lowest daily ranges for years. Traders need to adapt to these tighter ranges, and many have traded with a tighter stop and increased position size to accommodate for the low vol.
One can easily justify these sanguine conditions given the investment case for the bulls has been lacking. For gold to reverse higher these dynamics need to shift. Notably:
• The opportunity cost of being overweight gold – market players can get a 5.44% risk-free yield in US 6-month T-bills. Gold has no yield, so in a rising rate environment, gold can often face headwinds.
• There is a similar dynamic in the bond market where US 10y-year ‘real’ rates have risen to 2% - again, there is an opportunity cost of holding a yield-less asset.
• Gold has been a poor hedge – with cross-asset volatility at such low levels and equity markets recently performing so strongly the need to hedge risk in the portfolio has been reduced. However, funds have favoured the USD to hedge potential equity drawdown given its deep inverse correlation with S&P500 futures. Gold has a positive 30-day correlation with the US500 or NAS100.
• The USD effect - Over the past month, the USD has rallied against all G10 currencies – with US data continually coming in hot we see US Q3 GDP expectations sitting above trend at around 2.2%
• With US growth above trend, recession hedges have been unwound. We see this in interest rate pricing, with the market pairing back expectations of Fed cuts in 2024 from 160bp of cuts in June to 110bp of cuts. Traders can see the level of expected rate cuts by looking at the spread between SOFR Dec 2023 and Dec 2024 futures (TradingView code - CME:SR3Z2023-CME:SR3Z2024). Gold – another classic recession hedge – has been shunned.
Positioning
Looking beneath the surface we can see a solid flush out of bullish gold positioning – longs have been paired right back. But has positioning swung too far, and could this offer an entry to look more favourably at upside potential?
• Total (known) ETF holdings of gold sit at 90.05m – the lowest since March 2020 having fallen 18% since October 2020.
• We see gold positioning in the futures market has been reduced - net long futures positions held by managed money (in the weekly CFTC report) now sit at 29,356 contracts – having been as high as 116k net long contracts in July
• CTA (Commodity Trading Advisor – trend-following funds) accounts are max short gold futures but may need to see the price the futures prices above $1980 to start trimming this position.
• Gold 1-month option risk reversals (1-month call implied volatility – put implied volatility) sits at 0.07 – the lowest level since March. Options traders are shying away from positioning for upside movement.
Are we about to see a turn higher?
As Richmond Fed President Thomas Barkin said on 22 August, the US economy could accelerate further, which could hold big implications for Fed policy and challenge the consensus of easing growth and potential rate cuts. While we continue to watch global growth data points, we could also feasibly see US headline inflation accelerate higher in the August CPI print (released 13 Sept) from 3.2% to 3.6%. This could result in increased expectations of a November rate hike (from the Fed), which could lift the USD and real yields.
Gold would likely face another leg lower in this dynamic, but would also likely see volatility pick up and trading ranges expand – a more compelling dynamic for CFD traders
However, should inflation pick up near-term, resulting in the Fed likely to hike again, it would then accelerate the belief in lower demand and increased recession risk. It is here where expectations of interest rate cuts would increase as higher rates and a higher-for-longer stance from the Fed should accelerate the risk of recession in 2024.
If and when we see growth data points subsequently roll over, resulting in additional rate cuts priced for 2024, then gold could feasibly have a strong rally into year-end. As always, an open mind to changes in economics and the subsequent investment case for gold will serve traders well.

US 10-year real rates (TIPS) – the rising true cost of capital US 10YR ‘real’ rates are essentially US 10yr Treasuries adjusted for 10yr inflation expectations – TradingView users can set this up using the equation: TVC:US10Y-FRED:T10YIE.
We can see this as the true cost of capital and in effect, the higher yields rise the more this supports the USD and negatively impacts US equity valuations. The rate of change (ROC) is always important, but if US 10yr real rates head to 2% then this may accelerate the selling in the US500 and NAS100.
Yields Surging / TLT FallingThe technical weekly uptrend that yields have formed is rather astonishing.
The sheer power of this move suggests likely more upside yields. Some basic measured moves suggest a potential whopping 5.7% on the 20 year.
Imagine TLT long bond traders!
Nothing is probable but it makes you wonder if inflation is becoming more entrenched since the bond market is very forward looking.

USD Index road map with US CPI to come.Today's focus: USD Index
Pattern – Ascending Triangle
Support – 95.68
Resistance – 96.32
Today, we look at the USD index as price continues to trade rangebound after fighting back from a two-day decline. Could today’s CPI data break the deadlock and give the market some direction?
Traders will be watching to see what today’s data could do for rate rise expectations. Could a move above expectations lift price above resistance and get the current trend back on track? Or could a miss to the downside confirm an LH and break the trend, setting off fresh selling? If we see the data come in flat, this could maintain the current price range that we are seeing at the moment.
Keep an eye on today’s data when it’s released at 8:30 am EST, as it could produce some volatility if the figure comes out outside of market expectations.
Have a great day and good trading.

✨ MODIFICATION: EURUSD ✨ THE BIG PICTURE (5D)TECHNICAL ANALYSIS:
TP5 @ 1.2115 (closing ALL Buy Orders)
TP4 @ 1.17850 (shaving 25%)
TP3 @ 1.1250 (shaving 25%)
TP2 @ 1.1100 (shaving 25%)
TP1 @ 1.0933 (shaving 25%)
BLO1 @ 1.0820 ⏳
BLO2 @ 1.0800 ⏳
VIDEO TIMESTAMP:
00:00 ECB News
02:53 Where Do We Go From Here?
03:32 A Noisy Intermediate Time Frame (4H)
04:55 Key Support/Resistance Levels (4H)
06:01 Institutional Buying Targets
06:42 Safe Haven Currencies
05:52 Interest Rates and Safe Haven Currencies
08:47 Position Sizing with R:R @ 1:1
10:20 Best Buying Opportunities ⭐
11:04 The BIG PICTURE Analysis ⭐
13:28 BIG PICTURE Anticipatory Trend
16:31 Boost, Follow, Comment, Join
FUNDAMENTAL ANALYSIS:
During today's EUR News trading session, the EURUSD initially tried to rally or, as we call it, exhibited a false positive. Still, the market gave back gains as the European Central Bank raised its key interest rates as anticipated by 25 basis points up from 3.50% to 3.75%. So, considering this, where is Price Action going from here?
Since April 02, 2023, @ 18:00, it's been a very noisy range. This range is our current price curve analysis. It lands between the Pivot Low of 1.0788 and the Pivot High of 1.1095 and, therefore, places Support @ 1.0945 and Resistance @ 1.1086.
Based on the 4H chart, we should be clear for a downtrend breakout if price action opens and closes below our Support Level. A breakout pattern to the downside would also mean Price Action is pulling back from its BIG PICTURE uptrend pattern. Therefore, we should find Institutional Buying Targets around 1.0820 and 1.0800.
Considering the US dollar to "safe-haven" currencies like JPY or CHF, we need to be cautious about our position sizing because this will continue to be a volatile range. We're going to have to "ride the wave" professionally.
Right now, I see a lot of short-term buying and selling opportunities until Price Action reaches its 4-hour Demand Zone around 1..0800. Once we're there, the longer-term opportunity to buy will be ours.

Levels discussed during the webinar 27th July27th July 2023
DXY: Break below 100.74 could get to 100.40 and 100 round number
NZDUSD: Buy 0.6265 SL 25 TP 50
AUDUSD: Buy 0.6845 SL 20 TP 50
USDJPY: Sell 140.35 SL 30 TP 110
GBPUSD: Buy 1.3030 SL 40 TP 100
EURUSD: Buy 1.1150 SL 30 TP 100 (hawkish ECB)
USDCHF: Break below 0.8560 big downside to 0.8380 (choppy, dependent on DXY)
USDCAD: Sell 1.3150 SL 20 TP 50
Gold: Above 1974 could trade up to 1986

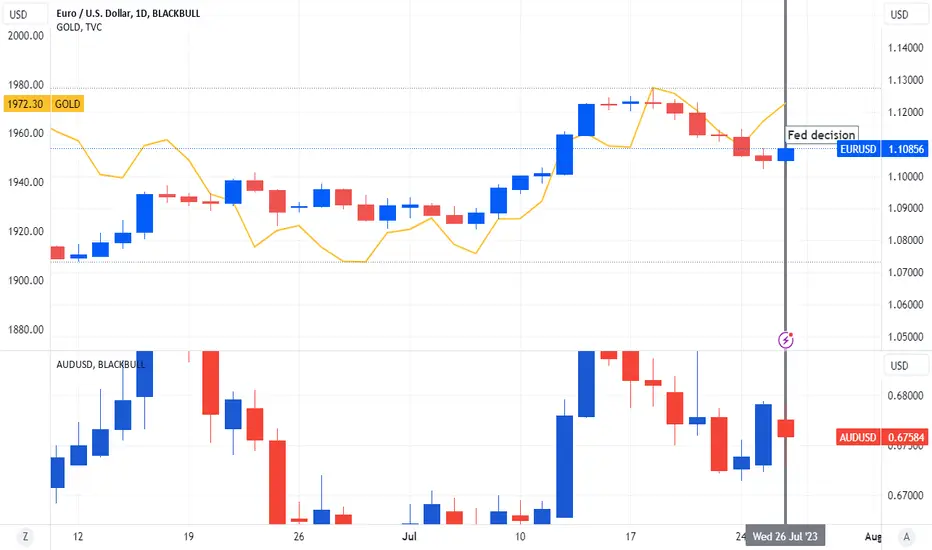
AUD Bucks Trend after Fed Hikes Rates to 22-Year High The Federal Reserve has decided to increase interest rates by 25 basis points, reaching a range of 5.25% to 5.50%, marking the highest level seen in 22 years. Market participants widely anticipated this move as the Fed resumed its tightening campaign.
In their statement, the Fed expressed a positive outlook on economic growth, acknowledging that economic activity has been expanding at a moderate pace, which is a subtle improvement from the previous characterization of "modest" growth. The focus on consumer prices remained, with the Fed emphasizing that inflation continues to be elevated, and policymakers will closely monitor the risks it poses, mirroring their assessment from the previous month.
Following the announcement of the Fed's decision, the U.S. dollar retreated across the board. This movement in the dollar contributed to a boost in gold prices and an immediate focus is now on the $1,973 minor resistance and $1,978 further above.
An exception to the general trend is the Australian dollar, which bucked the trend after data revealed that domestic inflation slowed more than expected in the second quarter. This decrease in inflation reduced pressure on the Reserve Bank of Australia to implement further policy tightening measures. The data showed that Australia's consumer price index rose by 6%, a deceleration from the 7% recorded in the first quarter and below the market's expectations of 6.2%. Consequently, the Australian dollar weakened to approximately $0.676.
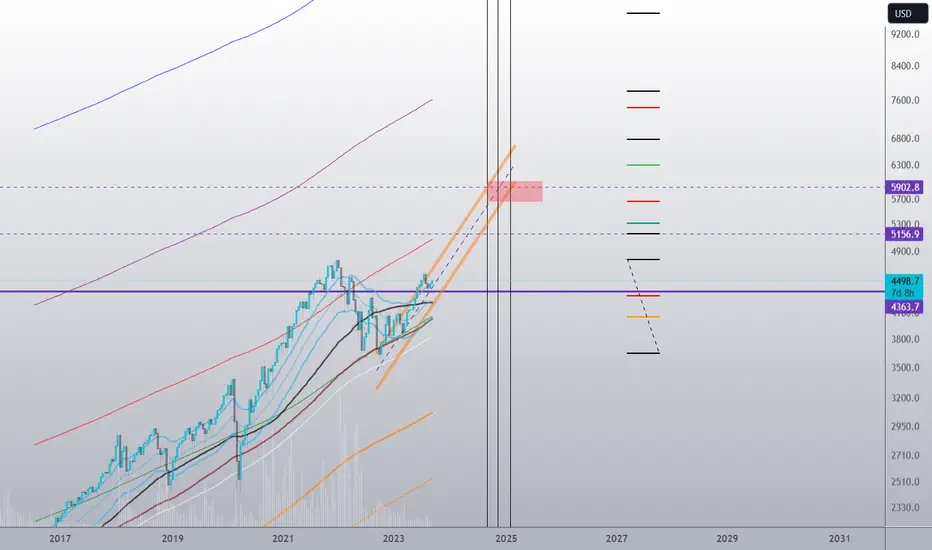
Harmonically, US Interest Rates are Headed Toward 35%The US Interest Rate chart has been trading within a Descending Broadening Wedge and has recently broken out of the wedge. The target for a pattern like this is typically back to the inception of the pattern, which in this case would be 20%; but we also have an additional variable here, and that's the Potential Logscale Harmonic Formation we've made here. If we are to treat the action of this chart as we'd treat any other chart, then we'd expect that once B gets broken, we'd get an accelerated move all the way up to the Harmonic Completion of a Bearish Shark, which would land us at the 1.13/1.618 Harmonic Confluence Zone up at around 34-35%
There have been previous instances where Harmonics have had a predictive quality over data like this, such as the accelerated liquidity exit out of the reverse repo facility, the bond yield charts on multiple occasions, and the US Inflation Rate Charts. Which can all be seen in the related ideas tab if you are skeptical of my use of Harmonic Patterns in this context.

XLRE possible BreakoutXLRE is trying to breakout of a small basing formation.
With rates surging recently one has to question a potential failure of this breakout, however if it does breakout there may be some significant momentum to the upside. Could this breakout coincide with a sudden drop in rates?

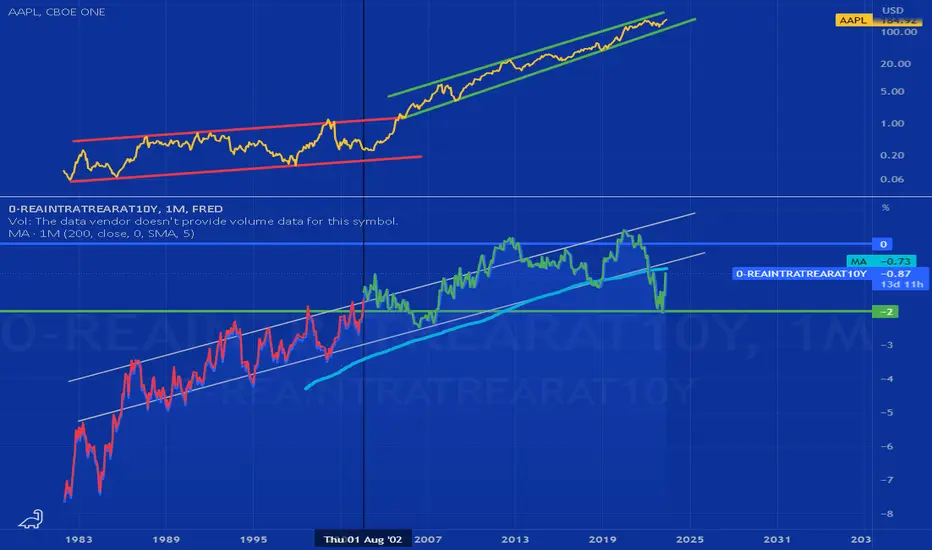
Correlation study: 10-year real interest rate vs. AAPL (1983 - )Apple share price (AAPL) plot above, inverted real rates (0-REAINTRATREARAT10Y) plot below + 1M 200ma, from 1983 to 2023.
Results:
-Strong inverse correlation with 10-year real interest rates and AAPL share price.
-Real rates < 2 % positively correlate with stronger AAPL returns.
-10-year real interest rates bounced from the 2 % level in September 2022 ... May 2023.
"‘John Bull’, says someone, ‘can stand a great deal, but he cannot stand two percent. . ."
- Walter Bagehot, 1852
GBPUSD DOUBLE SETUP BEFORE ECB RATESIn April, UK GDP grew by 0.2% m/m, recovering from the previous month's decline of -0.3% m/m. The rebound was driven by the services sector, with services expanding by 0.3% m/m and contributing 0.26 percentage points to overall GDP growth. The wholesale and retail sector, as well as the information and communication sector, made significant contributions. However, manufacturing and the health sector experienced declines. Manufacturing contracted by 0.3% m/m, with the pharmaceuticals sector playing a major role. The construction sector also declined by 0.6% m/m due to a slowdown in housing activity. Overall, UK GDP growth remains relatively stagnant, but PMI surveys indicate increased activity in April and May, especially in services, projecting a 0.3%-0.4% q/q growth rate for Q2. However, the extra bank holiday in May is expected to result in a significant contraction in GDP, potentially impacting the entire second quarter, although the effect on Bank of England policy is expected to be minimal.
Nicola, CEO Forex48 Trading Academy
USDCAD SHORT SIGNAL BEFORE FED RATESUSD/CAD faces downside pressure as the Loonie outpaces the decline in the USD Index. The pair has dropped sharply, reaching the support level of 1.3300 after encountering resistance at 1.3320. Upbeat oil prices provide support for the Canadian dollar, as investors anticipate a neutral interest rate policy from the Federal Reserve. This positive sentiment reduces fears of a US recession. Traders should monitor oil prices and the Fed's stance on rates. The Loonie's accelerated decline suggests a bearish sentiment. Overall, there is downward pressure on the USD/CAD pair, but careful analysis of economic and geopolitical factors is essential for informed trading decisions.
Nicola, CEO of Forex48 Trading Academy

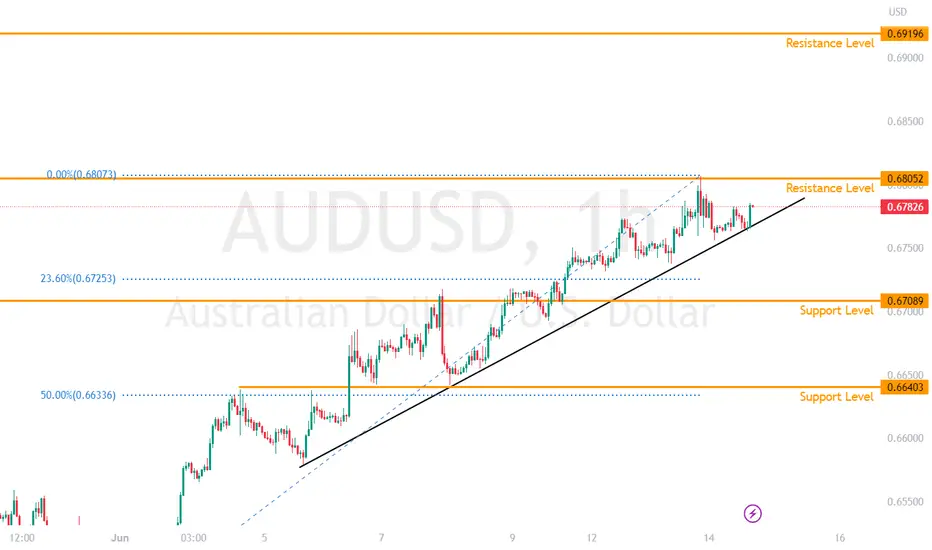
AUDUSD FOMC Prep 14th JuneThe AUDUSD approaches a key resistance at the 0.68 round number price level following a consistent climb since the start of June.
If the DXY continues to weaken, down to the key support level of 103, the AUDUSD could break above the immediate resistance level of 0.68 and rise toward the next resistance level at 0.6920.
However, the 0.68 resistance level is very crucial as the AUDUSD had previously reversed strongly from this level on the 14th April and 10th May.
A reversal could happen if the FOMC surprises markets with a rate hike.
In the more likely scenario, if the DXY weakens, look for the AUDUSD to break above the resistance level, and test the upward trendline again before continuing on to the next resistance level.