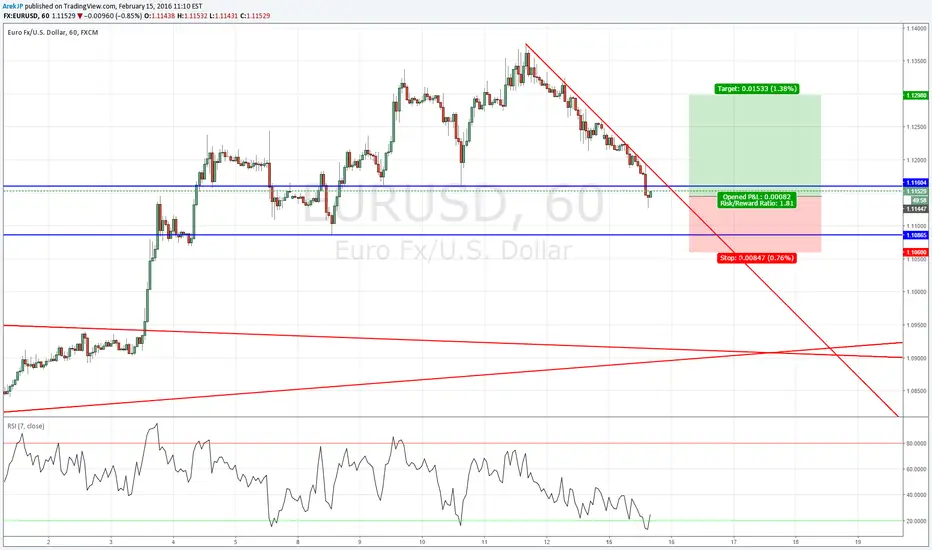
EURUSD: The Great ChartHello everyone!
Very nice long opportunity on FX:EURUSD .
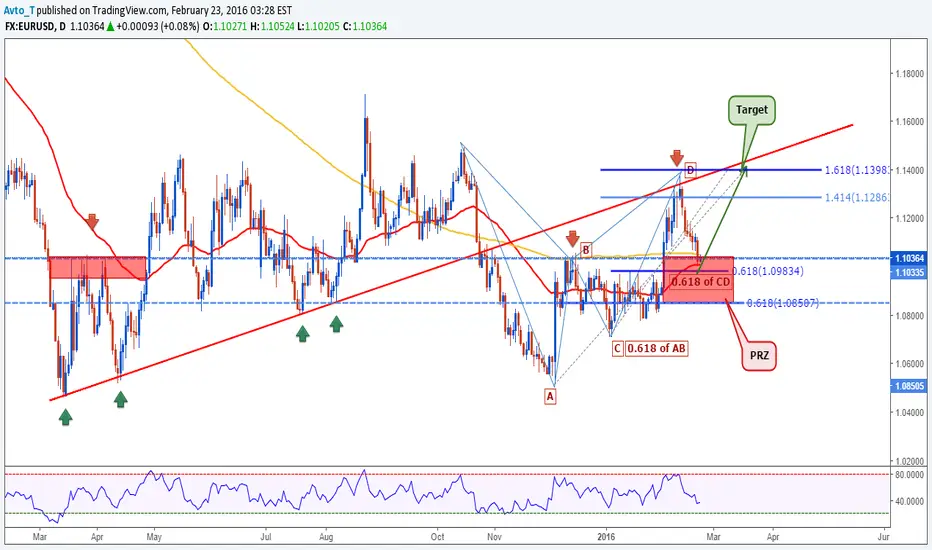
The chart says everything. So, what we have here:
1. Diagonal structure trend line, which acts like a magnet, as we see the support has become resistance @1.1330
2. 1.1330 is the completion level of bearish bat pattern and ABCD pattern.
3. we grabbed some profit from this pattern trading and the price came at B level which is a nice support for price to go long.
4. 1.1033-1.0.85 is a very nice reversal zone, where we can place our buy limit orders to go long.
5 Target will be the resistance of the trend line with the confluence of fibs 1.618.
6. If the price will not break this level and makes double top, then comes another opportunity to go short.
So, this is a brief analyses of the daily EURUSD chart.
--
www.rcpforex.com
Ratio
EG Bearish Bat Weekly, Great RR, wait to enter, PIPS PIPS PIPSHello Trading View,
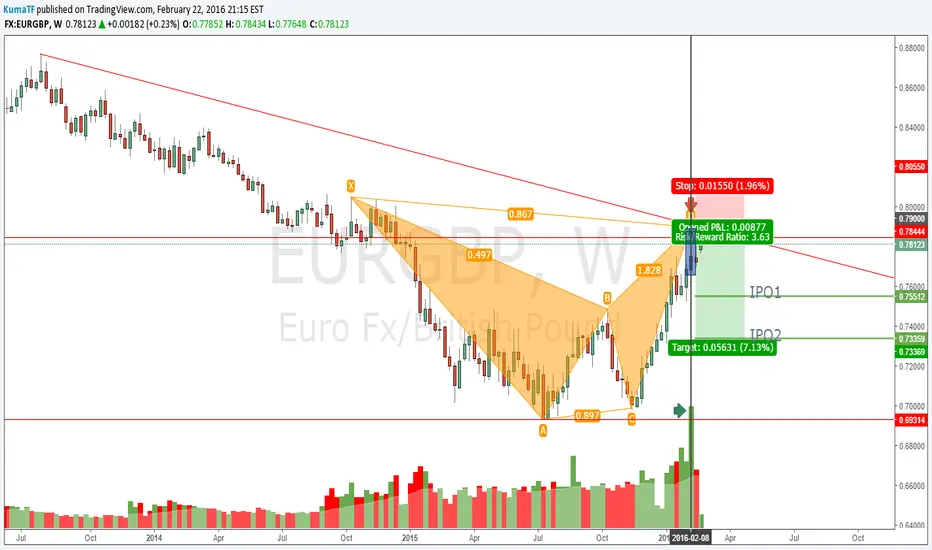
Here on the EurGBP Weekly TF we have a unique Bearish Bat that has completed.
Price action has shown all necessary reversals at the required ratios, and price in the PRZ has shown signs of confirmation of trend change.
Heres why this pattern is unique. VOLUME. The volume at point D was EXTREMELEY HIGH!!!!!! See Green arrow indicating said volume. This volume spike combined with the terminal price bar that tested the PRZ is SOLID CONFLUENCE....!@!?@>!?@>!>!!!
We have the necessary confluence of all 5 point harmonic patterns being an ABCD pattern. This pattern is an extended ABCD pattern. C point retracing 88.6% of AB, topside projection would normally be the 1.13%, but it has completed an extended pattern around the 1.618 expansion of BC. This is an extended 1.618 AB=CD pattern as defined in the Harmonic Trader : Volume 1 by Scott Carney.
Price action has retraced and beginning of this week shown a bullish gap. Expect price to fill the gap and continue to drop to the projected IPO1 and IPO2. The pound seems weak now, so Id wait for some confirmation prior to shorting. If you're aggressive short now (treating current price action as a retracement) and ride er on down.
Trade safe, trade smart.
-K
GU Long, Monthly Resistance bounce/Bullish Butterfly, Good RRHello Trading View,
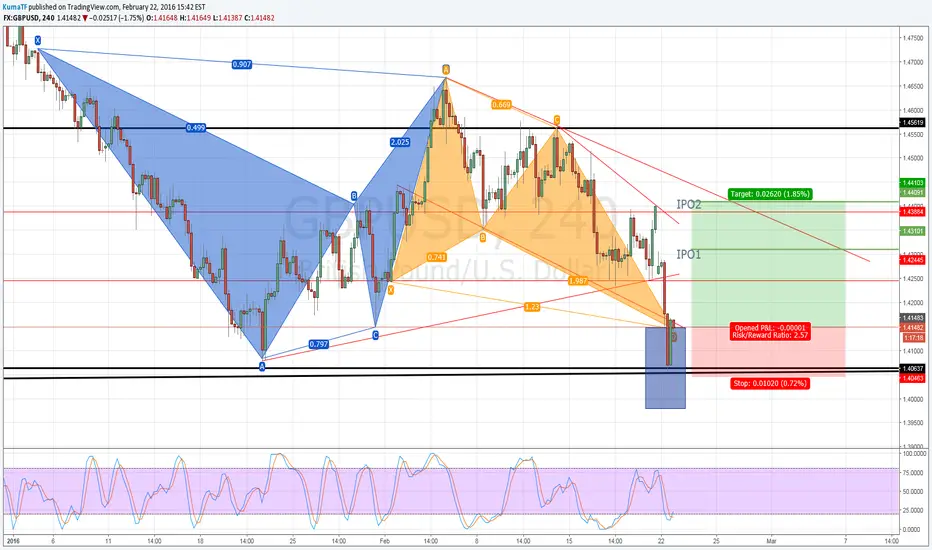
Here on GBPUSD we see bearish momentum, which stalled and bounced off an important key level off the Monthly TF.
The rejection of the key monthly support tell me that a trend change is in order.
We have the completion of the Bullish Bat 5-Point pattern, the terminal price bar has tested the majority of the PRZ and sharply pulled away, which is one confluence factor.
We also have the completion of the ABCD pattern within the C-D leg, a retracement of 50% of the impulse leg, which gives us bottomside projection of 2.0, which lands right in the middle of the PRZ.
I have 2 projected I.P.O. of the 0.382 / 0.618 retracement of the CD leg.
I.P.O. 2 is important because it could reach the bottom side of our overall trendline providing a possible swing trade.
I.P.O. = Initial Profit Objective
Trade safe, trade smart.
-K
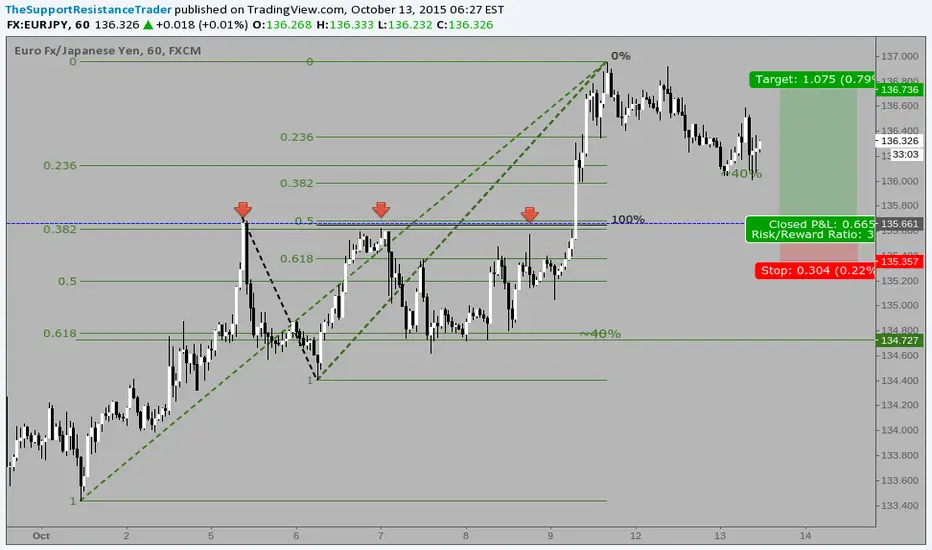
ABCD to Bearish Bat in progress, aggresive trade, good RRHello Trading View,
Here on the EuroYen, we are seeing a reversal of a bearish trend .
Price has made higher highs, and higher lows, confirming my directional bias.
Topside projection of the ABCD pattern is the 2.618 expansion of the BC leg, due to the B retracement of 0.382 of the impulse leg.
Typically you are supposed to trade this from the topside down, but if you're an aggressive trader, this might be your trade.
After completion of the ABCD pattern, we have a valid short, as price has completed a Bearish Bat.
Bat confluence due to price action reacting to all necessary ratios, and the completion of the ABCD pattern, which is essential to all 5 Point harmonic patterns.
Before pulling the trigger in the PRZ, monitor price action for the necessary confirmation to short at pattern completion.
Stop is set below the B point, as a close below would invalidate the pattern.
Trade safe, trade smart.
-K

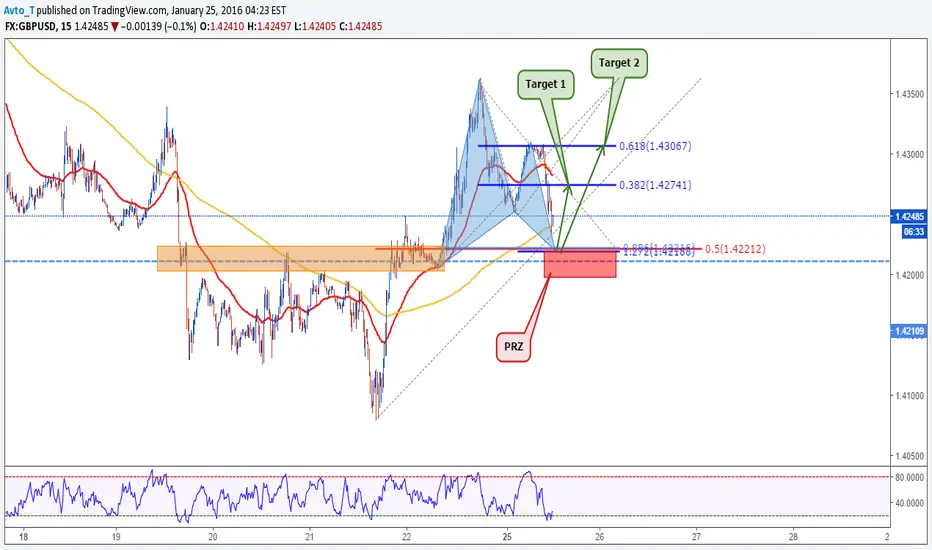
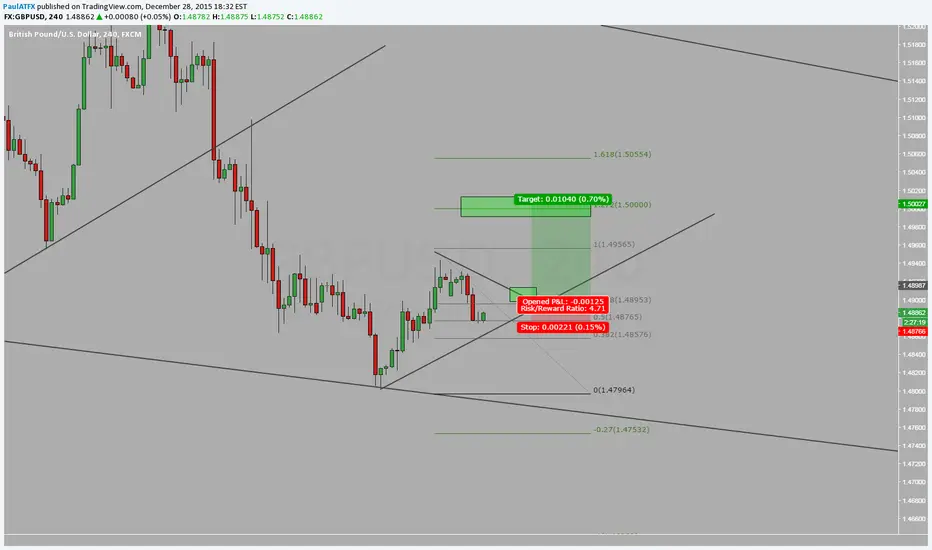
GBPUSD: Get ready for the next weekGood Sunday Traders!
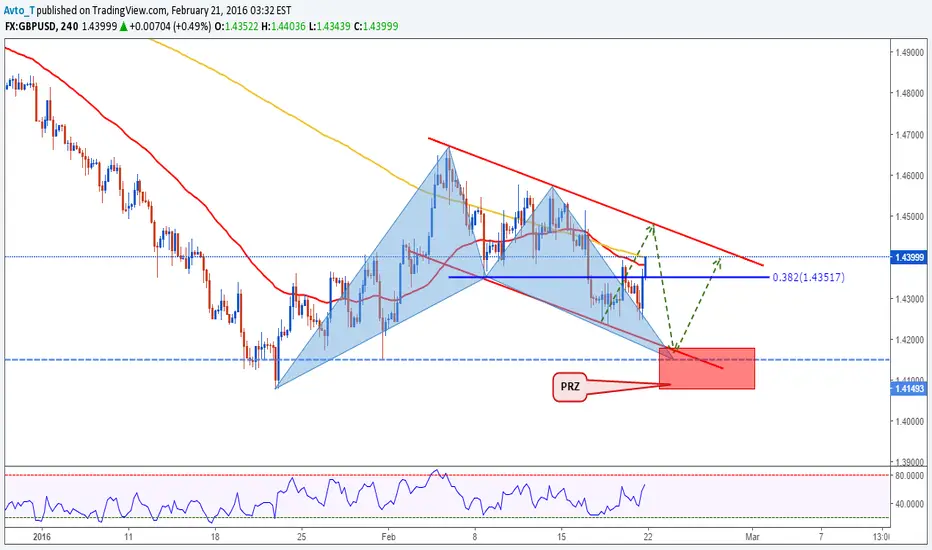
I see a very nice opportunity to get involved in FX:GBPUSD long.
So, what we have here is very nice channel and a bullish bat pattern.I am looking for the price to come around 1.4150 and then rally up. The stops should go below the PRZ and our target will be somewhere between the channel support level and fibs 0.382.
--
Avto_T
Financial Analyst
www.rcpforex.com
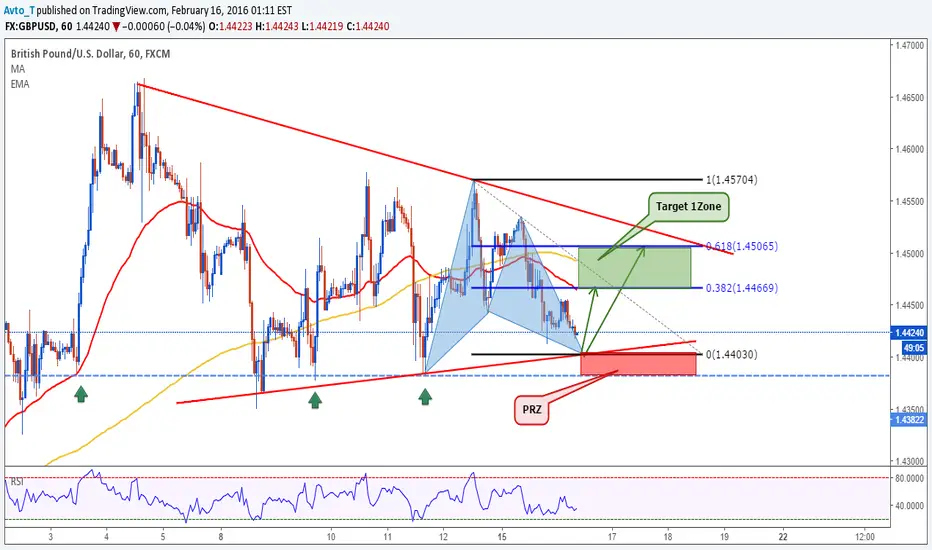
GBPUSD: Bullish Gartley in TriangleHello traders!
We have a very nice buy setup on FX:GBPUSD today.
There is a big triangle and inside the triangle bearish gartley. The entry level is @1.4403 which is the support level of triangle. Our stops go below the support 1.4382; look left for the structure. Our targets are fibs 38.2 and 61.8 zone.
Good luck
--
Avto_T
Financial Analyst
www.rcpforex.com
www.rcpforex.com
EURUSD long 1H - simple idea great RRLooking for potential SHS here, SL and TP as on chart. Lets see if it work out.
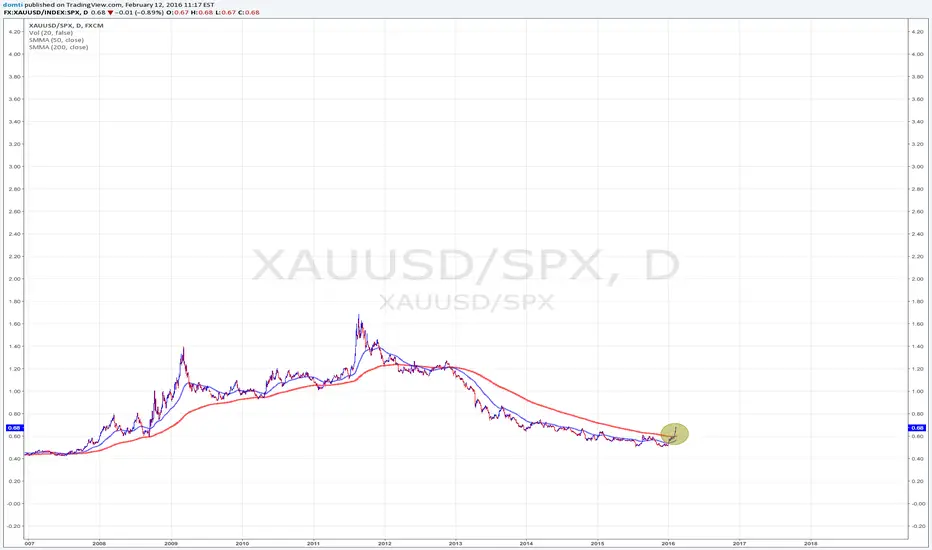
XAUUSD/SPX ratio exceeds 200 day moving averageI'm not an expert, but this is the first time since 2013, that the XAU/SPX ratio exceeds the 200 day moving average line.
GBPUSD: Harmonic LongHello everyone! We have nice opportunity to g long on FX:GBPUSD . We have a gartley pattrn with the confluence of several fibs ratios and structure support at X leg. Stops go below the PRZ and our targets are 38.2 and 61.8..
--
Avto_T
Financial Analyst
www.rcpforex.com
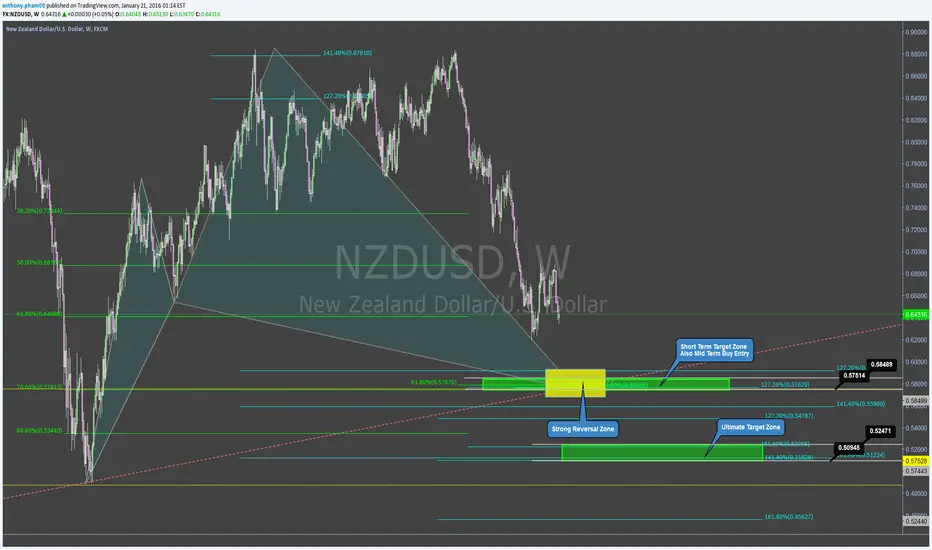
NZDUSD Weekly - Potential Kill Zones
Very Bearish outlook for KIWI Dollar but also presents a huge opportunity to capitalize on a very weak and bearish market
- Strong Ratio Confluence at the initial target zone.
- Trend Line Support/Resistance at area of confluence.
- Potential Advanced Cypher Pattern with a completion at the 78.6%
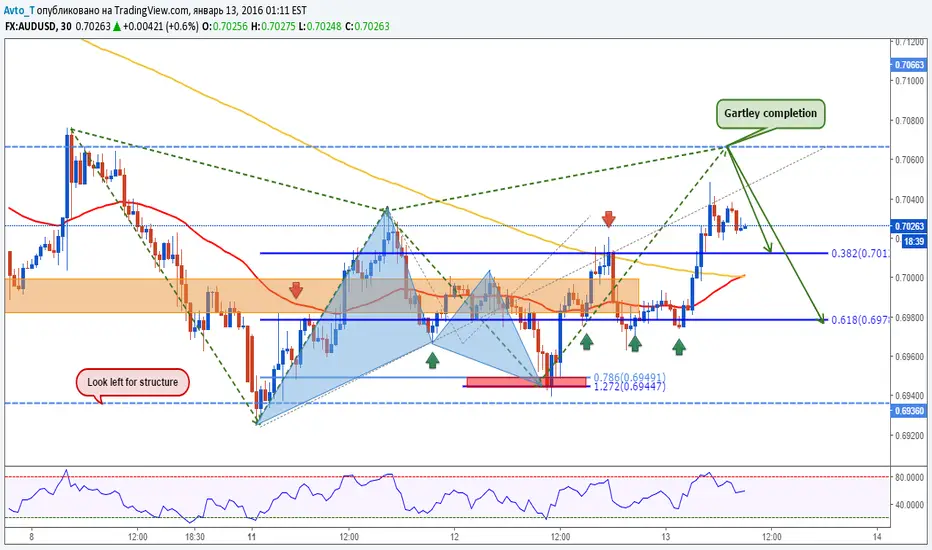
AUDUSD: Gartley is Ready Hello traders!
As I mentioned in a few words about this big gartley yesterday on FX:AUDUSD in my idea, today it is going to be completed and get ready to go short. Our targets are located on very nice key levels and stops should go above the X leg 0.7077.
--
Avto_T
Financial Analyst
www.rcpforex.com
cypher pattern to continue downtrendHey, treders recent series of HH and HL was broken. Now we have a new sereis of LL and LH installed. I took this cypher pattern in anticipation of this new downtrend to continue. Have a Nice day

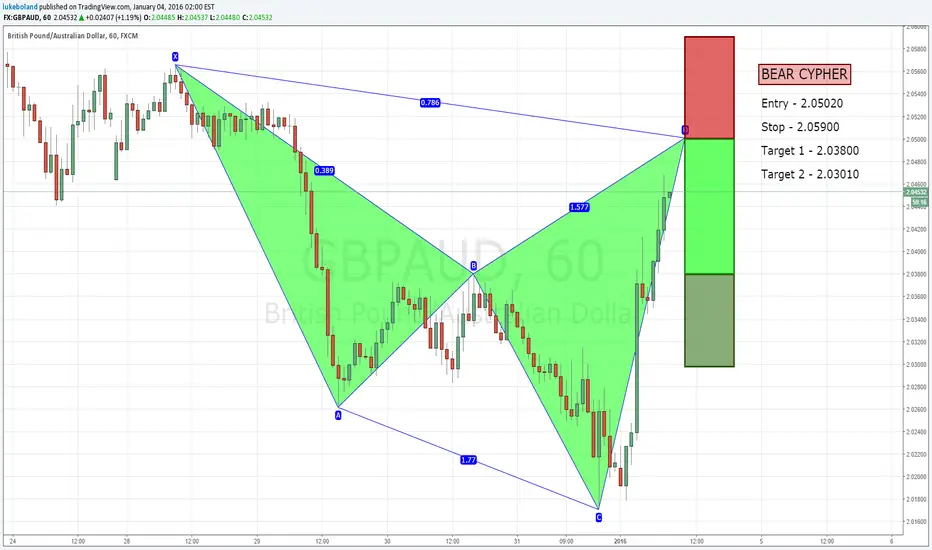
GBPAUD: CYPHER (H1)Happy New Year All,
Cypher setup coming up here on GBPAUD, see chart for position details.
Good trading in 2016 and beyond!
Luke
COUNTER TREND-ANTICIPATING BULLISH BAT HARMONIC BEFORE THE PLAYPossible BAT pattern in play here. We can anticipate that the pattern will complete given the conditions. Lovely price to sell!! Waiting for candle stick signals, or divergences on lower times
GOLD SILVER RATIOSHigher Gold and Silver ratios usually mean lower precious metals prices. By the looks of this chart, it seems likely that Gold and Silver mights still have one or two legs lower before this Bearish Broadening Formation plays out with a higher high as it test the top of channel at around 88
On a better note, looks like Gold and Silver are due for a huge move to the upside as this Formation comes into play and these ratios find themselves going downtown! 88-92 area has to hold
Like and follow for trade updates and new trade ideas

AUDUSD: Gartley / Go ShortOn FX:AUDUSD , the bulls are in control of the price and getting close to the previous structure high. When bears are going to step in? it is more likely soon, as big orders are mostly placed at structure levels.
In addition, there is harmonic moves, where the valid gartley pattern appears, which increase the probability. This pattern gives a clear guidance, when to enter and put our take profit and stop loss. There is a nice risk reward in this set-up.
T1 - 38.2%
T2 - 61.8%
------------------------------------------------------------------------------------------------------------------------------------------------------
TOP 10 Forex Broker: www.best10forex.com
TOP 10 Binary Options Brokers: www.binaryreviewed.com

DATA VIEW: I/S RATIO UPDATE - GROWTH CONTINUESInventories to Sales Ratio has been moderately ascending recently above its relevant risk-free levels of 1.3 along the relevant trend line.
It means that Inventories have been growing at a higher pace than Sales over the last several months
Savvy traders would be interested in watching this ratio as a potential risk indicator of the US economy.
If the ratio continues to ascend at the current phase, it will tell us that a significant fall in business sales is happening, and/or a large excess of inventories is being accumulated in the US economy – both factors are signs of a broader economic slowdown.

Longing EURJPY at fibonacci cluster confluenceEverything is on the chart guys. Fibonacci cluster consisting of 2 retracements (.382 and .50) plus the 100 extension from the previous price retracement. All of this lines up perfectly with previous support/resistance + that we're in a bullish trend.
Good luck everyone and hold your thumbs!
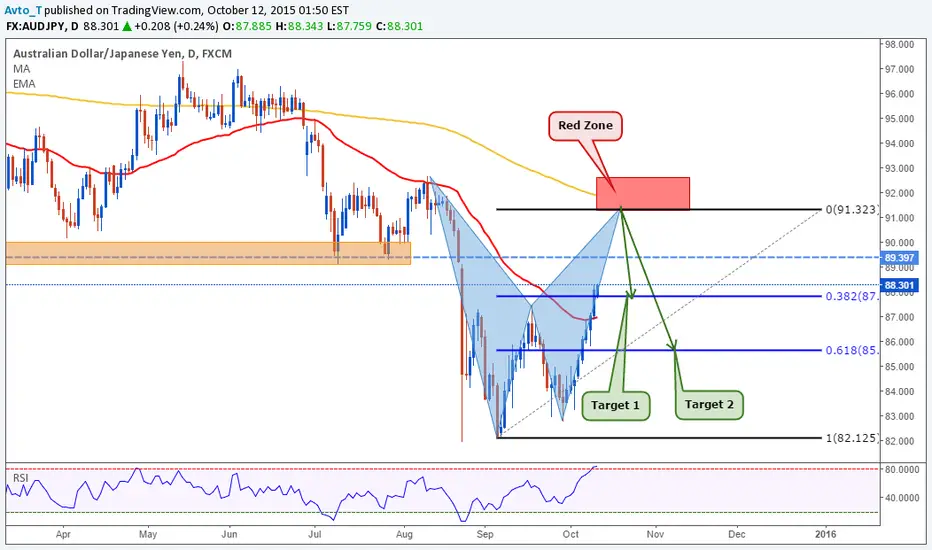
AUDJPY: Bearish Bat PatternGood morning traders.
Today on FX:AUDJPY we have a potential bearish bat pattern on daily chart, which should complete @91.32 level. Stops should go above the red zone and our targets will be fibs 38.2 and 61.8. Watch the structure level 89.4, it is really nice resistance which could be hold.
Avto_T
Green Luck
-------------------------------------------------------
Pre Launch Survey
Facebook Page
Facebook Group
Twitter
EURNZD: The week of HarmonyWe have another harmonic moves on FX:EURNZD . This is ABCD pattern, which is almost completed and it is a good time to go long. We have a very nice structure at this level, look left and confirm. Our targets will be 1.7370-1.7570 levels. But watch 1.7292 level, it might be a hard shell to breakout.
Avto_T
Green Luck
-----------------------------------
ATTENTION : Very soon, the best forex services will be available for you traders. Contests, bonuses, the so called “Big Deal” service, which you have never faced before and many more friendly and individual services. Please Click here for more information, fill the survey form and reserve your seats my friends! Follow me and be the first to enter our world!
Facebook Page
Facebook Group
Twitter
Pre Launch Survey
