#RAY/USDT Scalp Trade SetupRAYUSDT Trade Setup.
Opened Long position.
ENTRY: $2.352 to $2.41
Target :- 7% to 10%
Stop Loss:- $2.323 (-1.5% avg)
Risk reward: 1:4 (Low-Risk High Reward)
Lev: keep as low as possible to stay safe.
The strategy is to get in and out.
R: R is good but SL is a must.
With very low SL reward is good.
Ladder in partially,
ALWAYS PLACE YOUR STOP LOSS you never know, BTC has been acting weirdly for months.
Better to stay safe.
#DYOR before taking this trade.
Do hit the like button if you want me to post more trade setups.
Stay tuned
Thank you
#PEACE
Ray

✅RAYUSD💥Raydium is an automated market maker (AMM) and liquidity provider built on the Solana blockchain for the Serum decentralized exchange (DEX). ... This gives Raydium LPs access to all of Serum's order flow as well as their existing liquidity.
RAYUSDTHello Crypto Lovers,
Mars Signals team wishes you high profits.
We are in the daily time frame. There is the S1 line which was previously the resistance line. There are the R1 and R2 resistance zones. There are 2 scenarios. One is that it will make a pullback to the S1 line which would be a good place to buy and then it would go up to R1. Or it will move to R1 straight from here and after a correction, to the R2 zone. All of these scenarios depend on the price breaking the R1 line. If it goes below the S1 line, there would be more falling. You can buy it in 2 areas: half of it here and the other half at the S1 line.
Warning: This is just a suggestion and we do not guarantee profits. We advise you to analyze the chart before opening any positions.
Wish you luck

RAYUSDT ANALYSIS (SIGNAL)⚡️⚡️RAY/USDT ⚡️⚡️
Exchanges: Binance Futures
Signal Type: Regular (LonG)
Leverage: Cross(10X)
Margin: 2.0%
Entry Targets:
1) 4.0
2) 3.9
3) 3.7
Take-Profit Targets:
1) 4.1
2) 4.2
3) 4.4
4) 4.6
5) 5.0
Stop Targets:
1) 3.5
#CCC
Published By: @Tbae_Nike

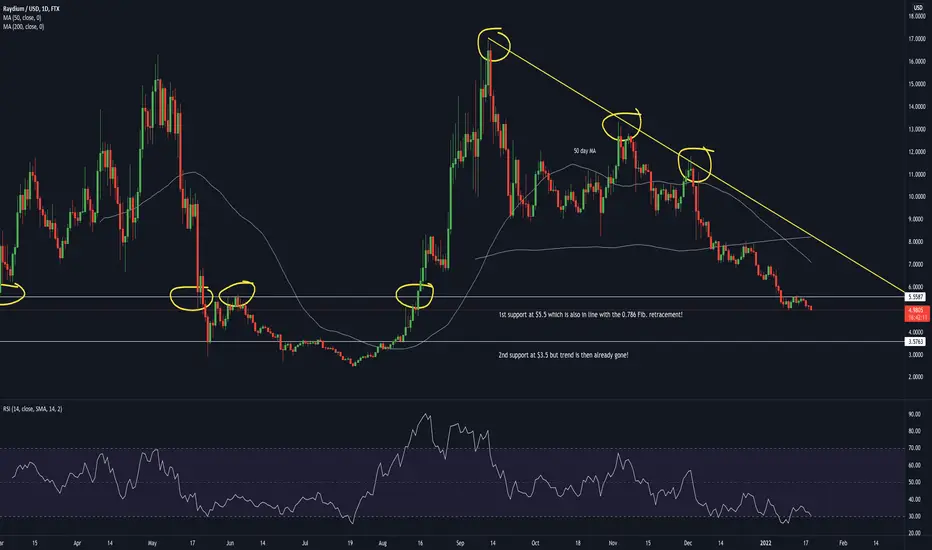
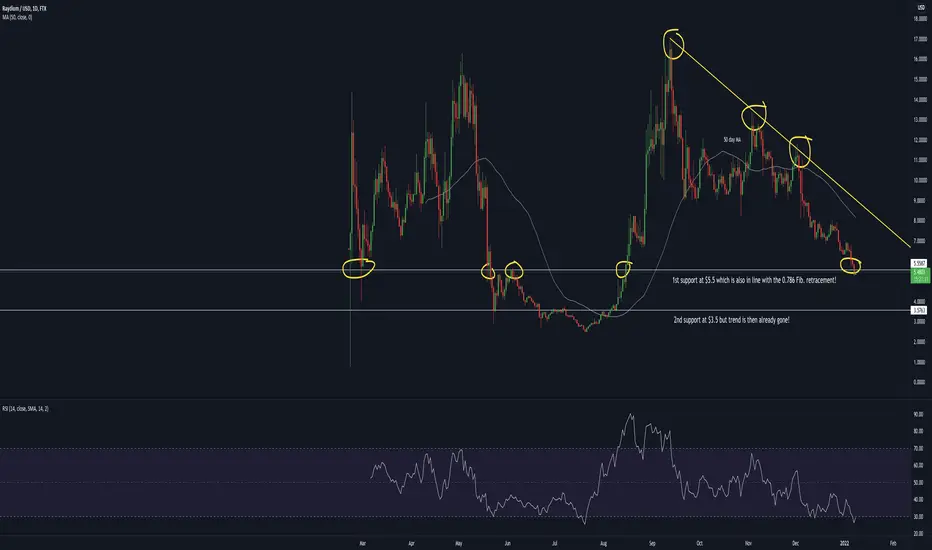
Next support 3.5 USD for Raydium? Raydium below $5.5! Support by $3.5 but trend is then already gone! Nevertheless RAY is a top-pick if you want to doller cost average into the Solana ecosystem!
RAY of sunshine ; yeh i know my last charts were earlyRAY of sunshine ; yeh i know my last charts were early
a ray of sunshine in a desolate landscape
prepare for launch into the stratosphere
SOL SRM RAY the royal trifecta


Raydium support level at $5.51st support for Raydium at $5.5 which is also in line with the 0.786 Fib. retracement!
Time For RAYAfter a long time accumulation, RAY is ready for the biggest upside move! Hold your seatbelts for a breakout from the current price range, buy and hold for the best profit!
Stay Tuned and hit the like button

#RAY is looking good for a LONG here.Leverage : 5x / 10x Max
Entry : Around 7.44$
Target : 7.64$,7.85$,8.12$,8.48$
Stoploss : 4H Closing below 7.14$
Maximum risk should not Exceed 1% On capital

RAY - Uptrend incomingBig deviations below the low, strong accumulation, money inflows, good project, solana ecosystem,
Only way...

RAY is Gonna Boom Soon!Hello every one
RAY/USDT
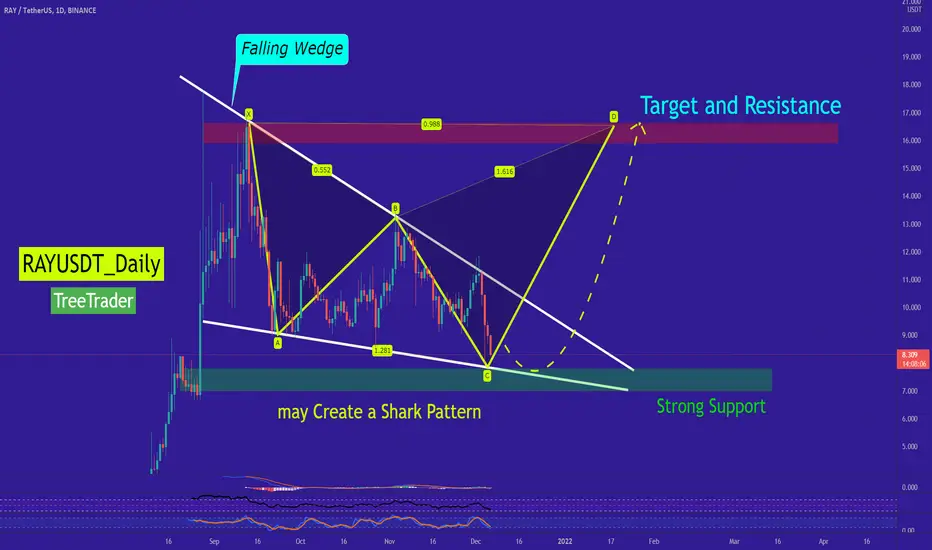
RAY Is in a Falling Wedge Pattern! Which The Pattern has Not Done a Break out yet! but It's Around It's Strong Support which Is around 8-7$ . We are Expecting a Good Pullback From There! Not Only There is a Falling Wedge pattern, we can Expect to see a Shark Pattern on The chart as well! both Pattern suggest a Target around 16$.
-Summery:
-RAY is in a Falling Wedge Pattern as well as a Shark pattern
-No Break out yet
-Support around 8-7$
-Target and Resistance at 16$
🔴This is only an idea and not a financial advise ( NFA )🔴
💎Traders, if you liked this idea or have your opinion on it, write in the comments, We will be glad.
Thank you for seeing idea .
Have a nice day and Good luck
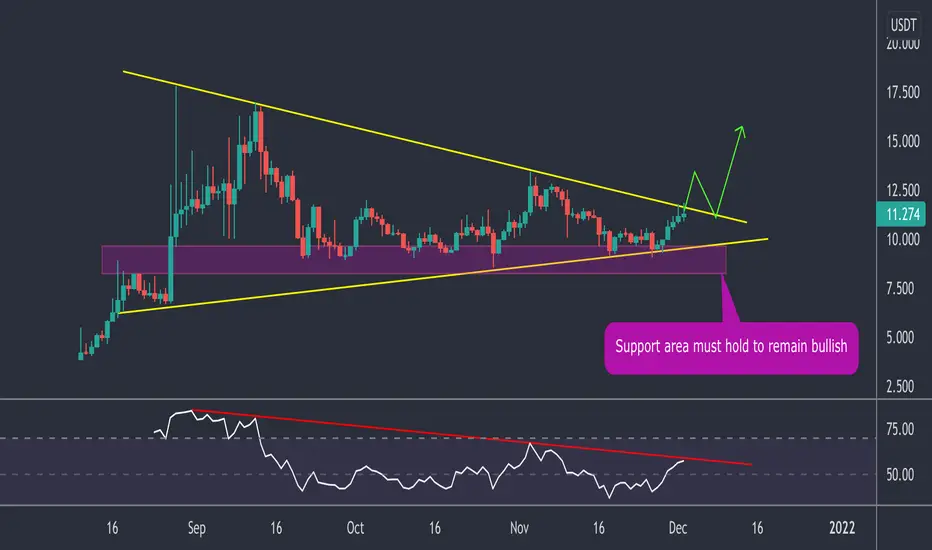
RAYRAY / USDT
Price is testing resistance line on chart and Also with RSI
bullish rally is expected once breakout is confirmed
Support area on my chart must hold
Keep your eye on it
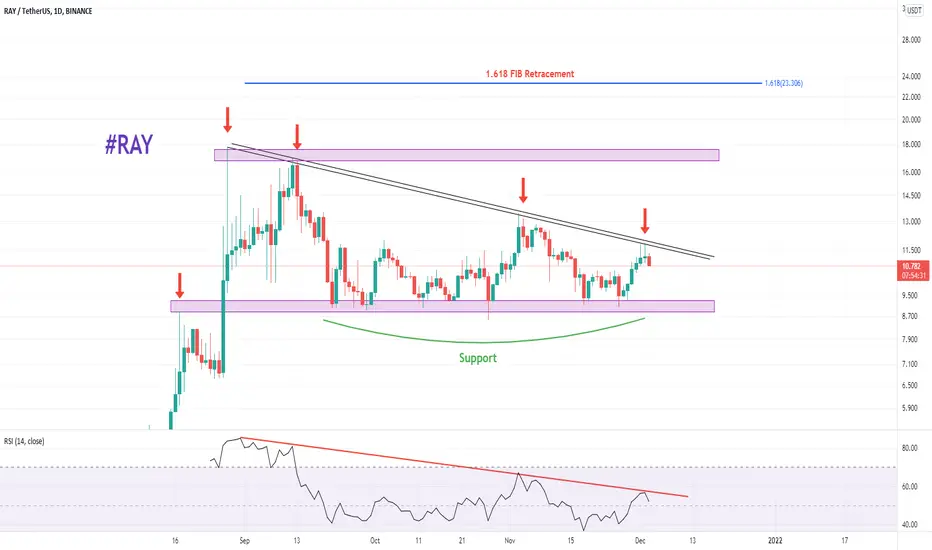
RAYSupport should be maintained at $ 9
After breaking the line and crossing that downtrend that has hit 4 times, we can hope for the rise of this currency.
.
Of course, if rsi breaks its downward trend line
We can imagine that a similar movement is seen in the chart
Be aware of the bitcoin trend.
RAYUSDTIf it will follow the triangle and don’t break the support zone ( the lines from the triangle can shown be as support and resistance too),
This might be the way it will move.
If it will move down out of the triangle, next support zone will be at around 6.6$
No financial advice.
Corrections are welcome.
Have a nice day!

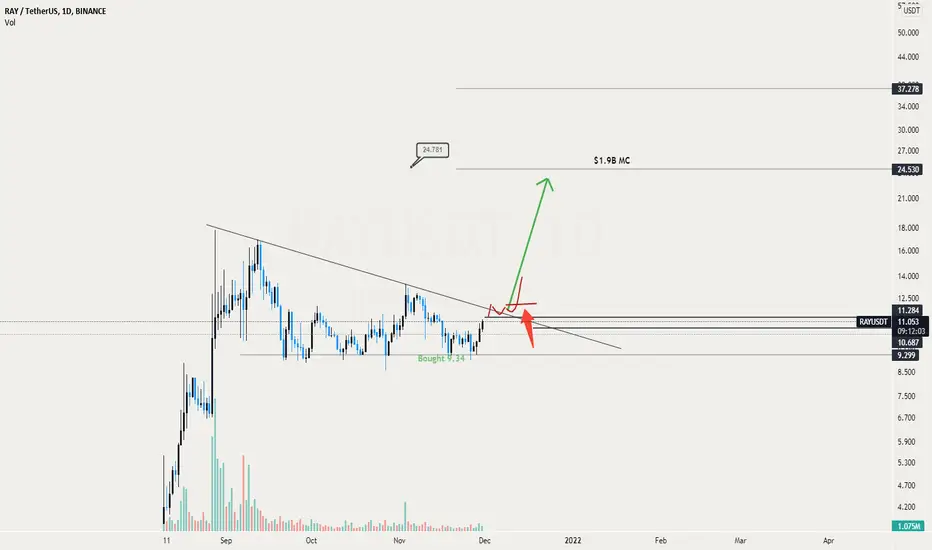
RAYUSDT RAY the move towards the $20 Area should be triggered after the breakout and retest.
RAY is still on LOW cap and Operating on SOLANA, the $1.9B MC is not hard to achieve
Quintuple Bottom on Raydium?FTX:RAYUSD looking pretty crazy, i cant remember if i have ever seen a quintuple Bottom on a Chart before. This could potentially confirm a bottom to traders and rn would be the lowest risk entry because its pretty easy to manage risk at this level. If RAY closes a daily candle or even a 4h below the $8.986 level, it will probably fall much lower. But since its a rock solid project and the biggest AMM on Solana i highly doubt it, at least it would be kinda devastating for the Solana ecosystem and signal weakness to investors.
Oscillators on all higher time frames looking primed for tremendous upside potential.

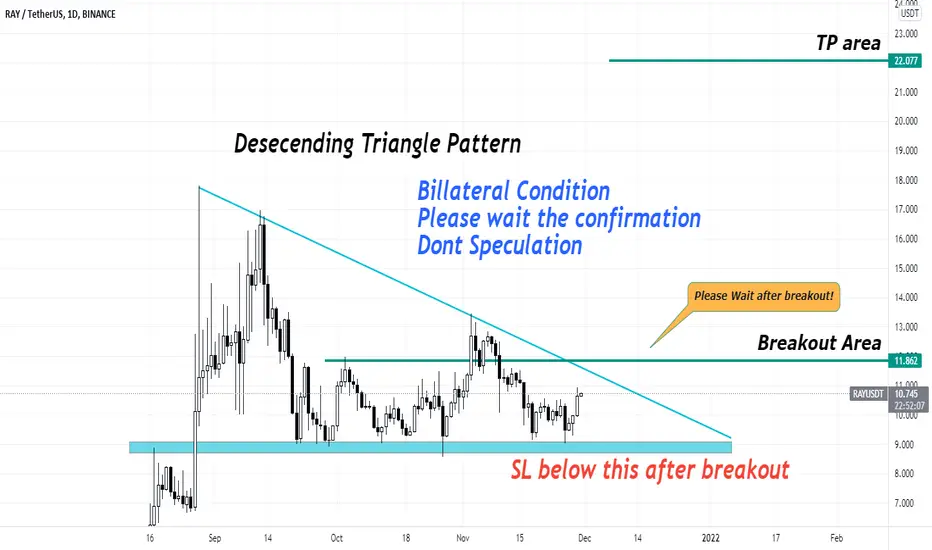
RAY/USDT DESCENDING TRIANGLE PATTERNRAY/USDT
Please wait for the breakout, we need the confirmation from the pattern
Because the pattern can make 2 result
Dont speculation i warn you all guys
Thanks for support , lets go higher and smarter together!!
#indonesia #tipsfortradingplanning
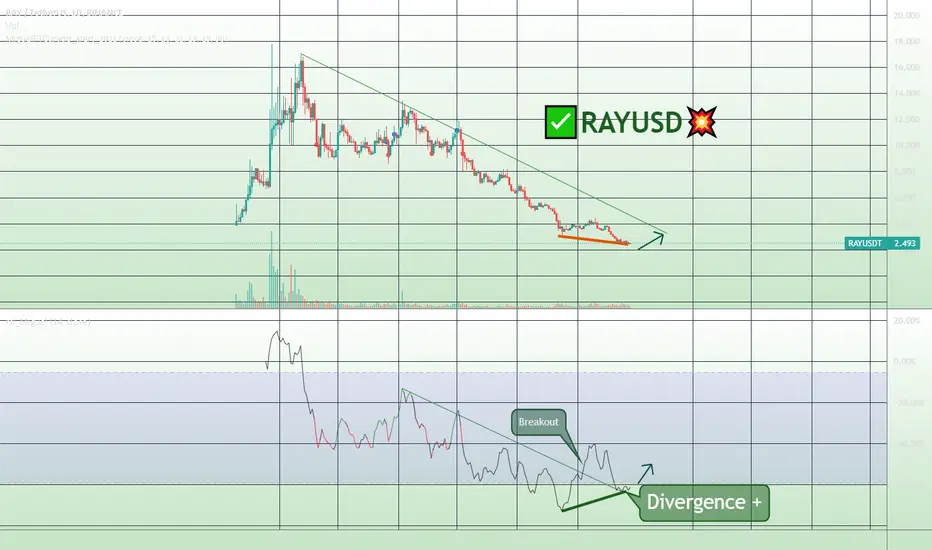
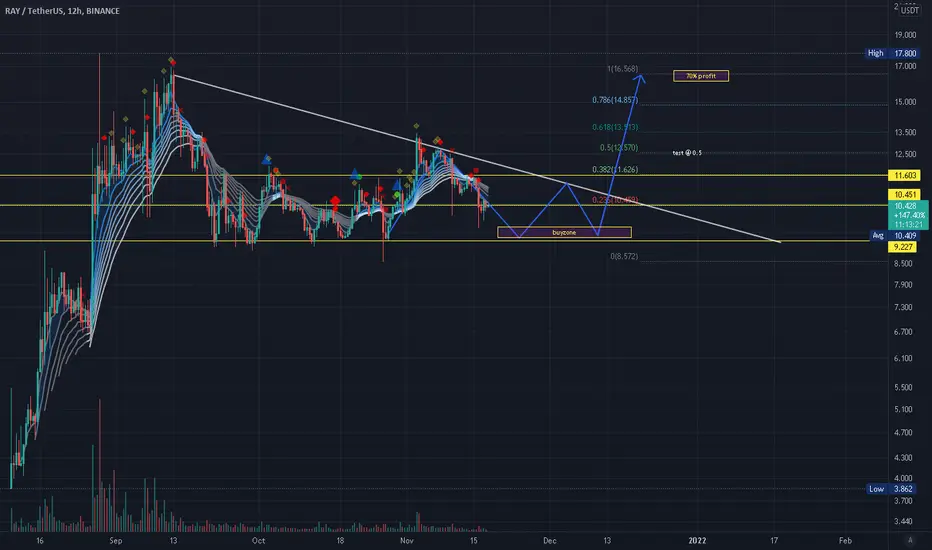
$RAY short term TA breakout pattern w/ Buyzone$RAY short term TA breakout pattern w/ Boyzone
Currently $RAY is in a downward triangle pattern, having tested topside once. On third topside tests expectations are to breakout.
Depending on BTC prize and trends. If going parabolic, Raydium could see upwards of 70% profit (Initially, as I never moonboy and yell "10X, 200X!")
Share your thoughts
Raydium (RAY) forming bullish BAT pattern for next pumpHi dear friends, hope you are well and welcome to the new trade setup of the Raydium (RAY) token.
On a daily time frame, RAY is completing final leg of the bullish BAT pattern.

RaydiumBeen watching Raydium for a while, I'm going to look for entry if it can hold the 0.382 on the daily. The symmetrical triangle looks to be playing out which I'm viewing as a bullish pennant, target is around $25.

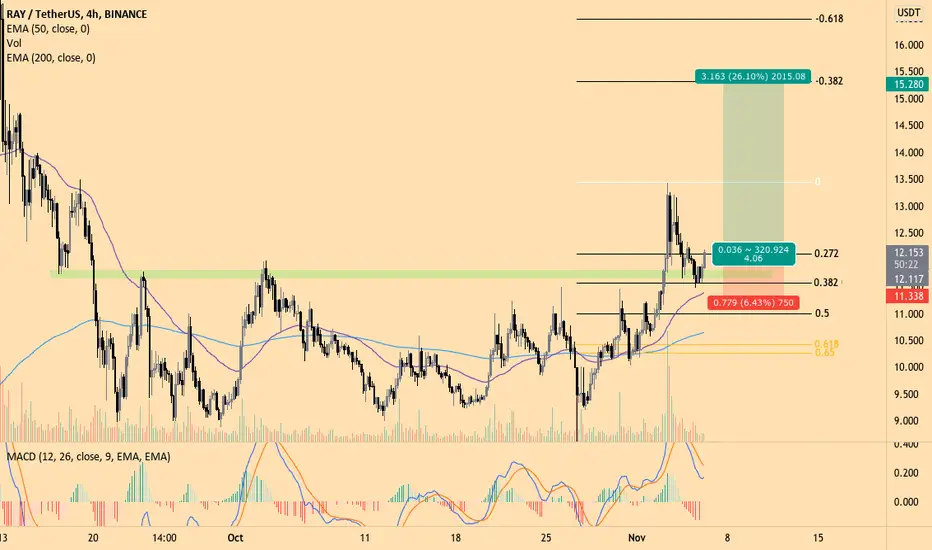
Have I reached X-RAY vision?Raydium looking good on the 4H chart.
- Bullish structure
- Bounced off of strong support zone
- Bounced off of .382 FIB
- MACD curling up
- EMA's moving away from each other
Enter now for a nice 4R/R. if you want to increase your R/R, you could wait for another retest of the support zone although it could easily just continue its move given the current state of the market.
Stop loss just below the 50EMA.
How do you feel about the Solana project?