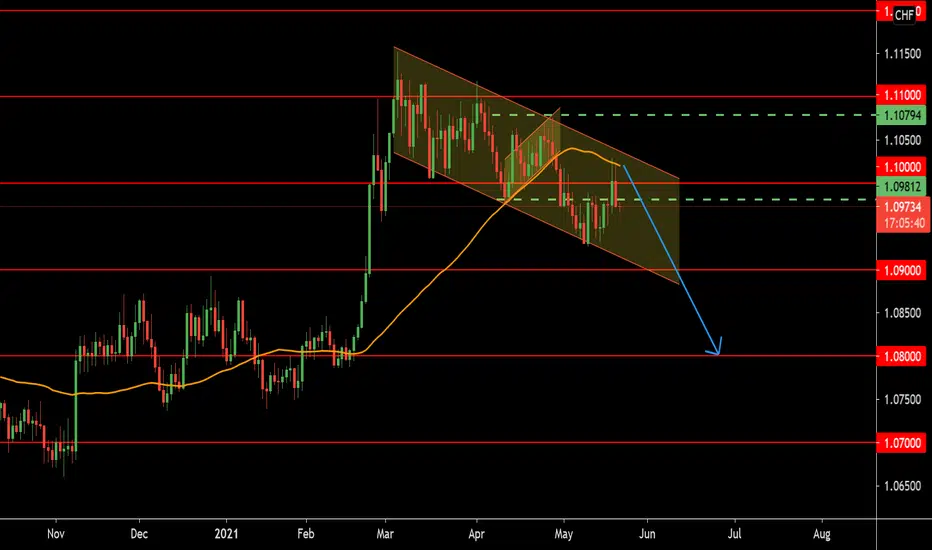
EUR/CHF - long- Looking for rejection at key resistance level (highlighted yellow)
- Bullish confirmation among indicators and rejection at channel support for entry
- See if the price holds at 4H EMA.
Rejection

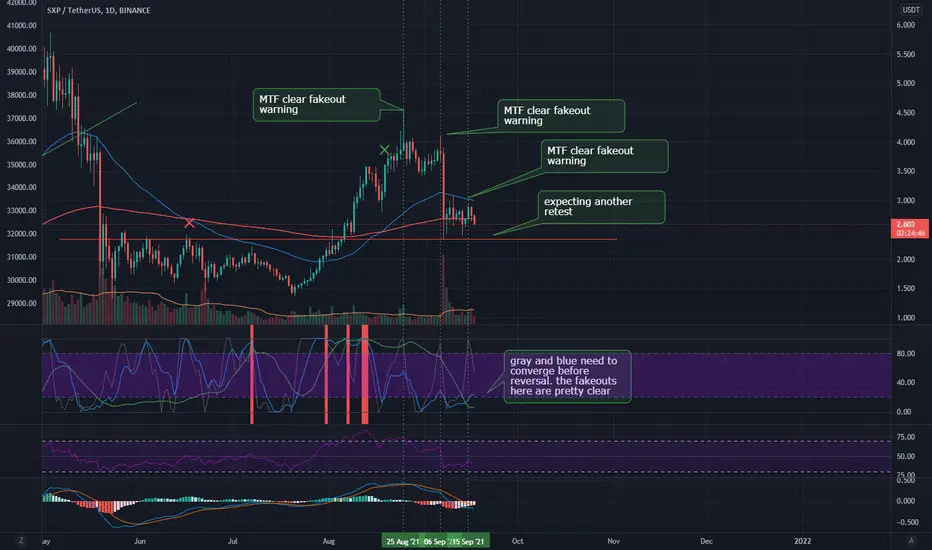
SXP retest coming?SXP gave multiple rejection signals on the MTF wave indicator. expecting a lower time frames MTF convergence before next bounce.
AUDIO USDT AUDIO USDT hit trend line and showed that it got rejected it even made a trap so what now?
it wil come down it will even come down harder if bitcoin breaks down. (look my recent post about bitcoin)
DONT take it as financial advice just my idea

Amazon Last Call. Breakout Rejection.Amazon didnt breakout from that consoladation (Banktrading). No big support in price or sustainable trend. Big pullback in price coming.

NZDUSD - My Trading Plan in 3 mins!Hello everyone, if you like the idea, do not forget to support with a like and follow.
Here is the top-down analysis for NZDUSD, feel free to request any pair/instrument or ask any questions in the comment section below.
Best of luck!

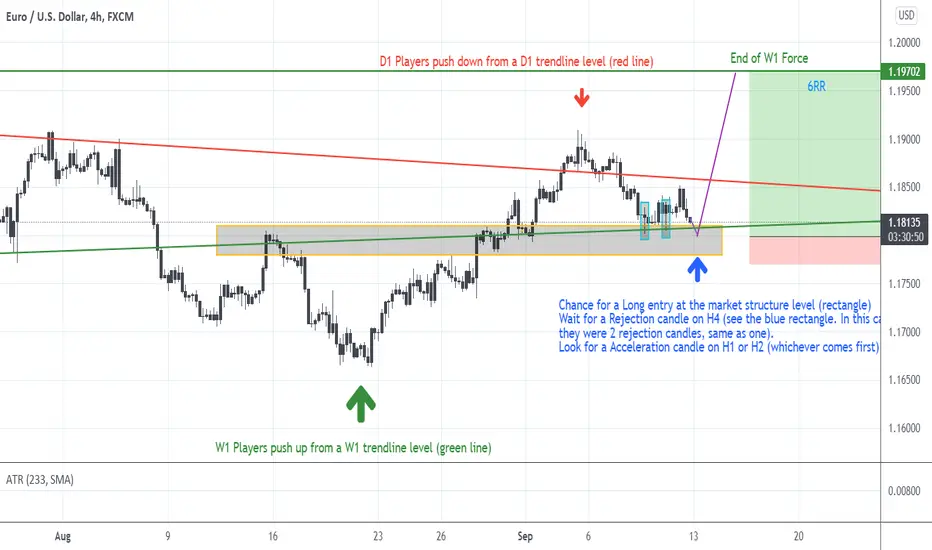
EURUSD - Price Action Analysis - H4/H1Reasons for entering on this market structure:
- There is an ongoing D1 force on the way down, due to a D1 downtrend plotted in red. This force is supposed to go down for 135pips (2ATR on D1 from the red arrow).
Because there is also an ongoing W1 force on the way up, this D1 force will be jeopardized, and will travel 1ATR distance only (current market level)
- Price will go to the half mark and will turn up to hit the D1 players SL (1.1970). The D1 SL is also a market structure support/resistance.
Regarding the setup for the entry, once the rejection candle on H4 is confirmed, you need to look either for:
- a depletion candle on H1 or H2 (candle with long wick closing up)
- a engulfing candlestick pattern (upward engulfing, green candle closing above previous red candle high)
Weekly Bearish Engulfing Bearish 5-0 May Take Us Down to 12KIt's not completely hopeless for the bulls yet but from the looks of things on the charts it seems way more likely that BTC will see 12.5K again rather than it seeing all time highs anytime soon. The Weekly Bearish Engulfing makes the perfect rejection signal at this Pattern Completion Zone.
I think we just spotted the trend reversal.

AUDJPY - Potential Bearish Reversal!Hello everyone, if you like the idea, do not forget to support with a like and follow.
AUDJPY is approaching a resistance zone in green so we will be looking for sell setups on lower timeframes.
on M30: AUDJPY is forming a trendline in red but it is not valid yet, so we will be waiting for a third swing to form around it. (projection in purple)
Trigger => Waiting for that swing to form then sell after a momentum candle close below it. (gray area)
Until the sell is activated, AUDJPY would be overall bullish and can still trade higher.
Good luck!
All Strategies Are Good; If Managed Properly!
~Rich

BTC does this count as last attempt a 50k?so what do you think, was this the last attempt before bigger correction or not?
2 rejections at 50400

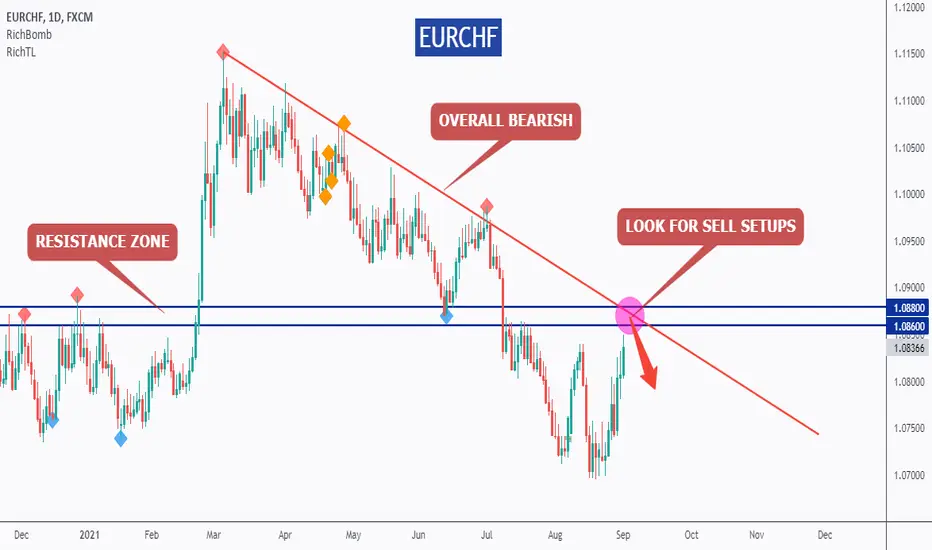
EURCHF - Purple War Zone!Hello everyone, if you like the idea, do not forget to support with a like and follow.
EURCHF is still overall bearish trading below the red trendline, so we will be looking for Trend-Following Sell Setups as it approaches the upper purple circle.
Moreover, the area 1.086-1.088 is a strong support turned into resistance.
Thus, the highlighted purple circle is a strong area to look for sell setups as it is the intersection of the blue resistance and upper red trendline. (acting as non-horizontal resistance)
As per my trading style:
As EURCHF approaches the upper purple circle, I will be looking for reversal bearish setups (like a double top pattern, trendline break , and so on...)
Always follow your trading plan regarding entry, risk management, and trade management.
Good luck!
All Strategies Are Good; If Managed Properly!
~Rich
WIPRO 15 MIN as on 01.09.2021ASCENDING TRIANGLE PATTERN FORMED!!
Too many fake breakouts but Gave again one breakout!!
Taking a pull back and can move again!!
Do check volume!!
Target= 666.25/670
Stop Loss=635/630
200 EMA GIVING A GOOD SUPPORT!
(The above analysis is only for study purpose do not take it as any buy or sell call!!)

OGN - My Trading Plan in 3 mins!Hello everyone, if you like the idea, do not forget to support with a like and follow.
Here is the top-down analysis for OGN, feel free to request any pair/instrument or ask any questions in the comment section below.
Best of luck!

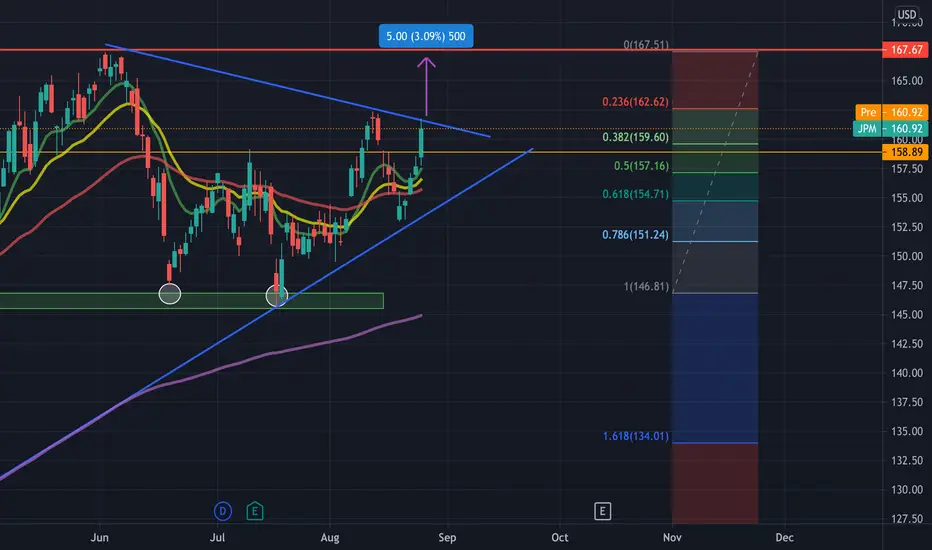
JPM: Breakout to ATH again? JPM is starting to breakout here on the 4hr chart and is currently up about 2% on the day. We're breaking out of the wedge and it is trading above both moving averages. Monitoring to see if JPM can make a move towards $167, which is the all time high, 3%-4% upside per share.Also, it has hit FIB 0.382, the risky part that it might be a rejection in this wedge especially when market is flat or down. If it doesn't breakout this time, there is a potential that it will be in near future.
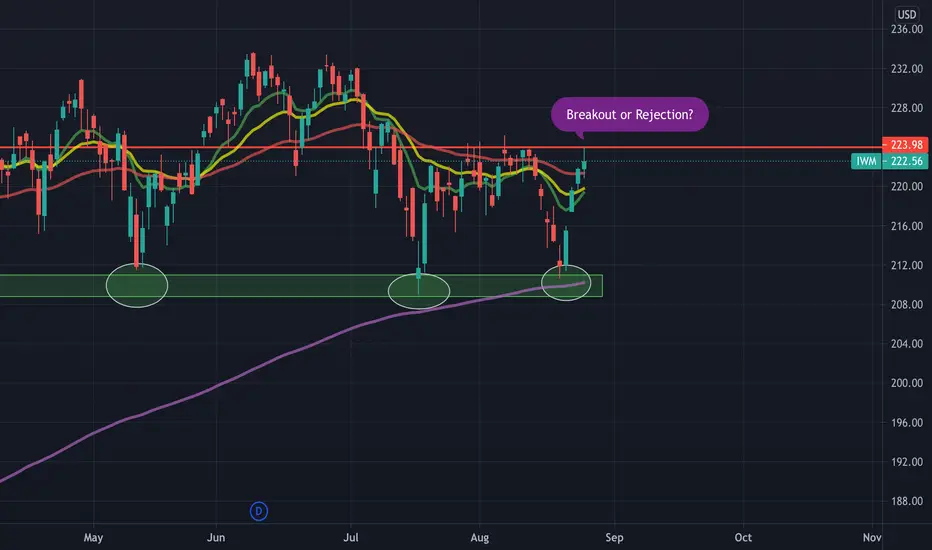
IWM: Breakout or RejectionIf anyone has placed their position in IWM few days ago when I wrote my analysis on IWM, please be careful with tomorrow's small caps market as IWM has reached to the crucial pivotal resistance point, either they could breakout and all small caps stocks will continue to rally OR a strong rejection to downside. Small caps stocks like DKNG, PENN, AMC, CROX, UPWK, NVTA, APPS, M, FUBO will be affected accordingly. Plus, Jerome Powell will be speaking tomorrow at Jackson hole. Be mindful.
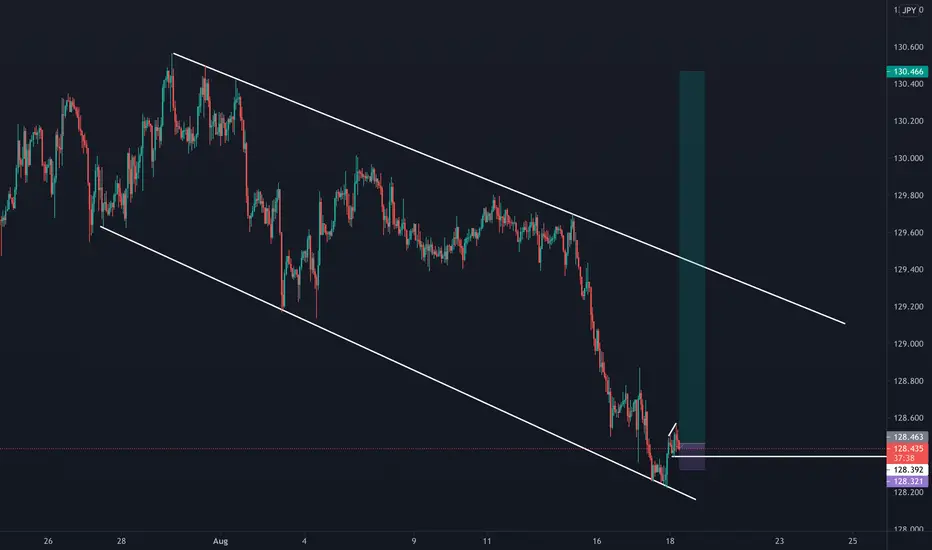
EURJPY LOOKING FORWARD TO GOING LONGDescending channel with an impulse and corrective phase.
If price happens to be rejected at the low of the correction I will gladly go long.
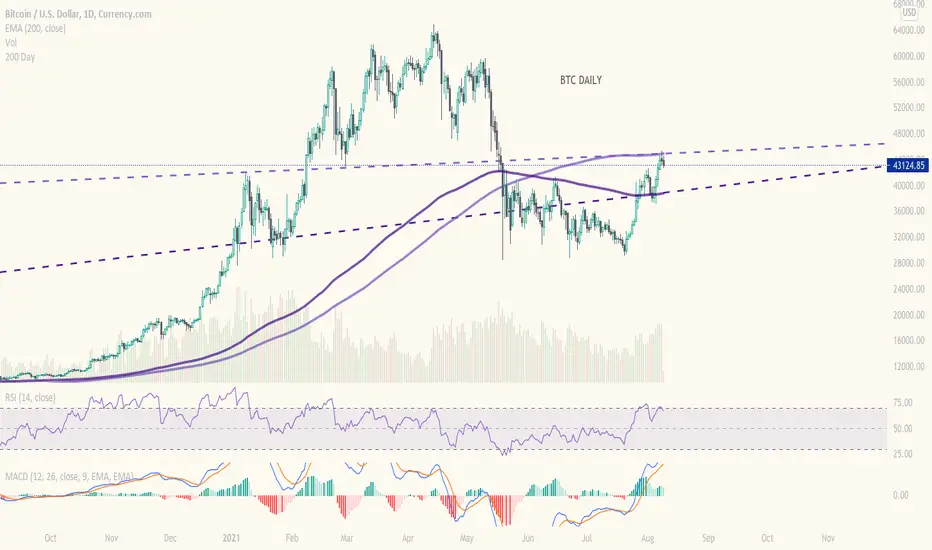
BTC Bouncing Around Between the 200 SMA and 200 EMA, Daily ChartThe chart shows the potential for some further sideways movement as a game of price ping pong plays out. Price seems to be respecting these two moving averages.
Short EURCHFAfter breaking and retesting our 52 period moving Average, with a double rejection, the pair EURCHF is poised to continue its movement to the down side.
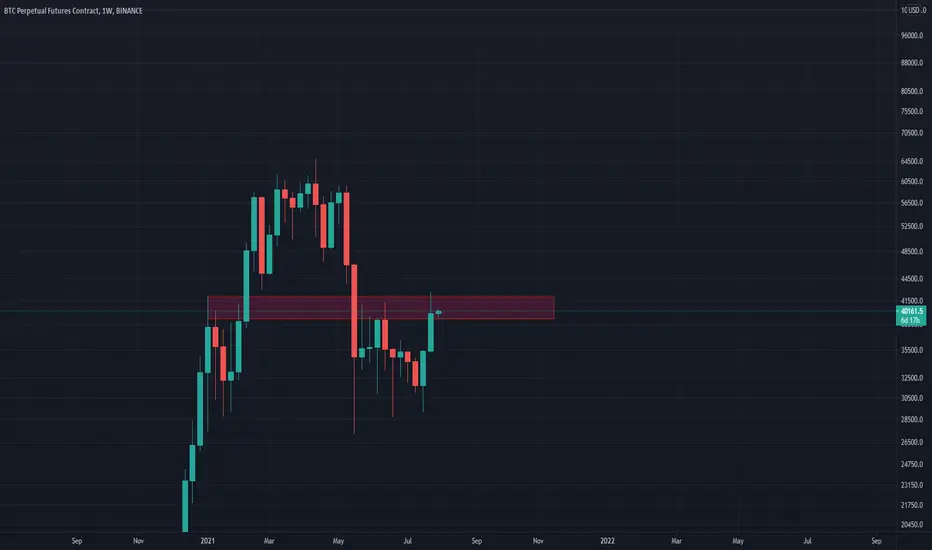
Weekly close below 42k!This might indicate that we got rejected, but we are staying inside the box so maybe we are going with support to close above 42k next week.
AUDNZD - Look For Buy Setups!Hello everyone, if you like the idea, do not forget to support with a like and follow.
AUDNZD is overall bearish trading inside the brown channel, so we will be looking for Trend-Following Sell Setups.
As per my trading style/plan;
Here are the two strong zones where I will be looking for high probability buy setups:
I call them War Zones, (highlighted in Purple circles)
Zone 1: (around 1.065) in green
This highlighted purple circle is a strong area to look for sell setups as it is the intersection of the green resistance and upper brown trendline. (acting as non-horizontal resistance)
Zone 2: (around 1. 05 ) in blue
This highlighted purple circle is a strong area to look for buy setups as it is the intersection of the blue support and lower brown trendline. (acting as non-horizontal support)
As per my trading style:
As AUDNZD approaches one of the purple circles, I will be looking for reversal setups (like a double bottom /top pattern, trendline break , and so on...)
Always follow your trading plan regarding entry, risk management, and trade management.
Good luck!
All Strategies Are Good; If Managed Properly!
~Rich

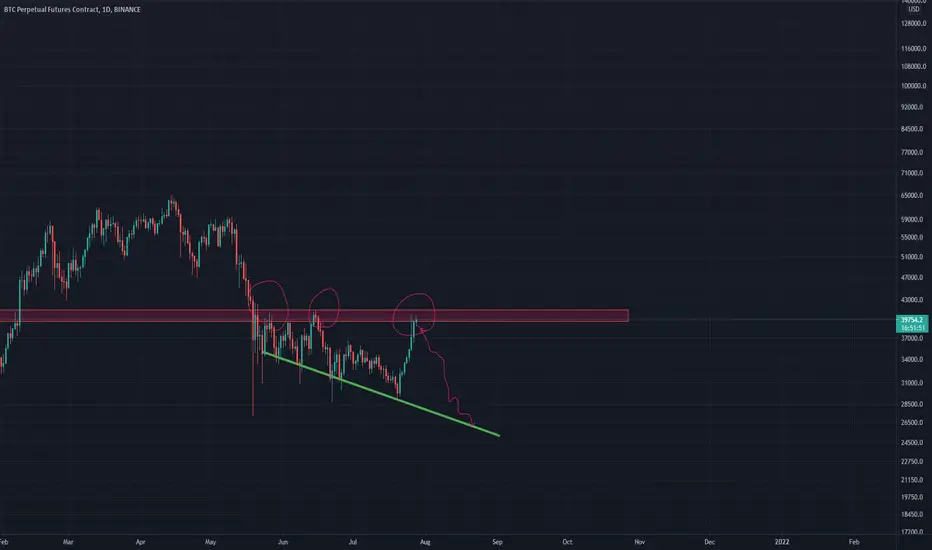
Double top on 4h!We got two rejections at the resistance level from 40-42k and are now heading downwards in my opinion. Maybe we retest the support line at 27k.
AUDNZD - Purple War Zones!Hello everyone, if you like the idea, do not forget to support with a like and follow.
AUDNZD is overall bearish trading inside the brown channel, so we will be looking for Trend-Following Sell Setups.
As per my trading style/plan;
Here are the two strong zones where I will be looking for high probability buy setups:
I call them War Zones, (highlighted in Purple circles)
Zone 1: (around 1.065) in green
This highlighted purple circle is a strong area to look for sell setups as it is the intersection of the green resistance and upper brown trendline. (acting as non-horizontal resistance)
Zone 2: (around 1.05) in blue
This highlighted purple circle is a strong area to look for buy setups as it is the intersection of the blue support and lower brown trendline. (acting as non-horizontal support)
As per my trading style:
As AUDNZD approaches one of the purple circles, I will be looking for reversal setups (like a double bottom /top pattern, trendline break, and so on...)
Always follow your trading plan regarding entry, risk management, and trade management.
Good luck!
All Strategies Are Good; If Managed Properly!
~Rich

MICROSOFT - My Trading Plan in 2 mins!Hello everyone, if you like the idea, do not forget to support with a like and follow.
Here is the top-down analysis for MICROSOFT, feel free to request any pair/instrument or ask any questions in the comment section below.
Best of luck!

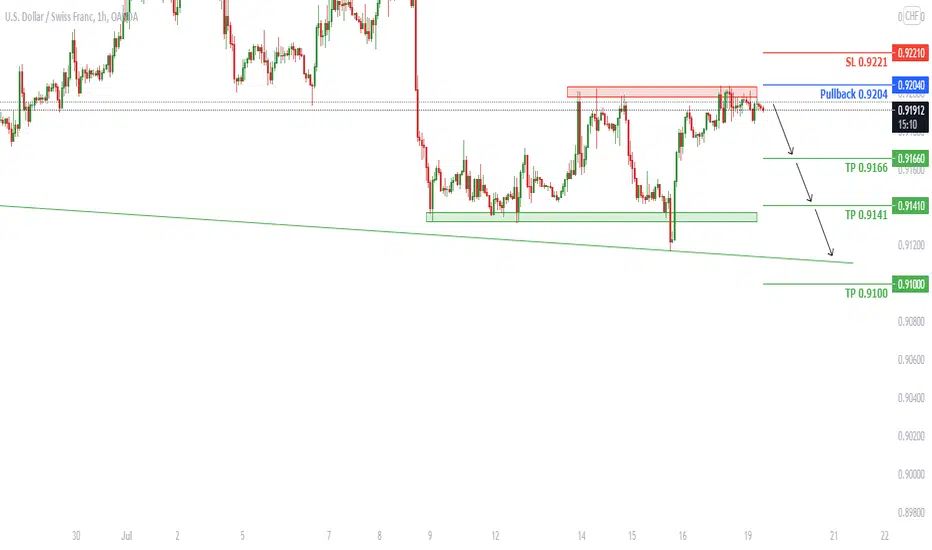
USDCHF on H1 is going down
Welcome back Traders, Investors, and Community!
Hi Traders, USDCHF on H1 after many rejections at Resistance price is showing indication to the down side.
⬇️Sell now or Sell at 0.9204
⭕️SL @ 0.9221
✅TP1 @ 0.9166
✅TP2 @ 0.9141
✅TP3 @ 0.9100
We will have more FREE forecasts in TradingView soon
❤️ Your Support is really appreciated!❤️
Have a Profitable Day