Unique Weekly Trend During BTC correctionI have noticed an odd yet unique pattern happening with Bitcoin ever since the crash sub 4k.
Bitcoin always starts the week off Really Strong following the stock market and is able to hold of most of its gains into Friday , then over the weekend when all markets but Bitcoin are open everything gets dumped back to square one at the 6k Baseline Support.
There is a strong case for this to occur again this week as Bitcoin failed to break higher despite the numerous attempts by the bulls to get bitcoin into the 7k region.
The Stochastic Rsi is showing a double top a bearish sell signal we haven't seen a while that has proven to be valid and of high probability for bitcoin.
Rejection

BITCOIN BREAKOUT - Ascending triangle loversHey there,
Please support this idea with your likes and follow me on Tradingview.
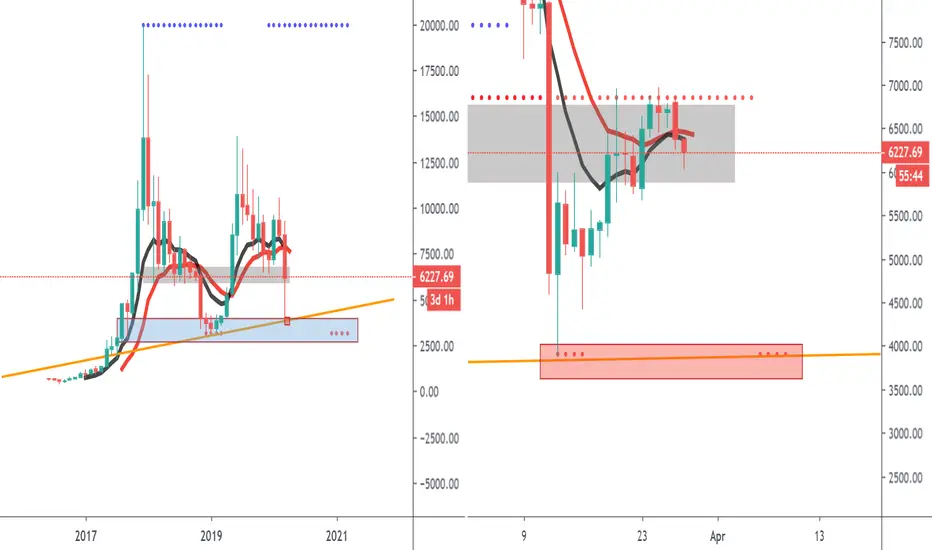
As you can see we are most likeley in an ascending triangle in Bitcoin, which sends of strong bullish signals.
We had a breakout recently above 7k, but I already expected a rejections, since this breakout was
in my opinion premature. I expected a third touch of resistance, a retrace down to support, befor then
finally significantly breaking 7k. Also btw a perfect touch of the fib retracement from 3k drawn to 14k.
You would know all of that if you were watching my youtube videos.
If you arent't an accumulator down here, I would suggest thinking about your trading strategies and most likely
moving away from trading, since you obviously are a herd thinker and do what others tell you.
Of course this is not financial advice, but this is the time to buy Bitcoin heavily and buy more if it drops lower.
Although I think that this is very unlikely.
Cheers,
Konrad

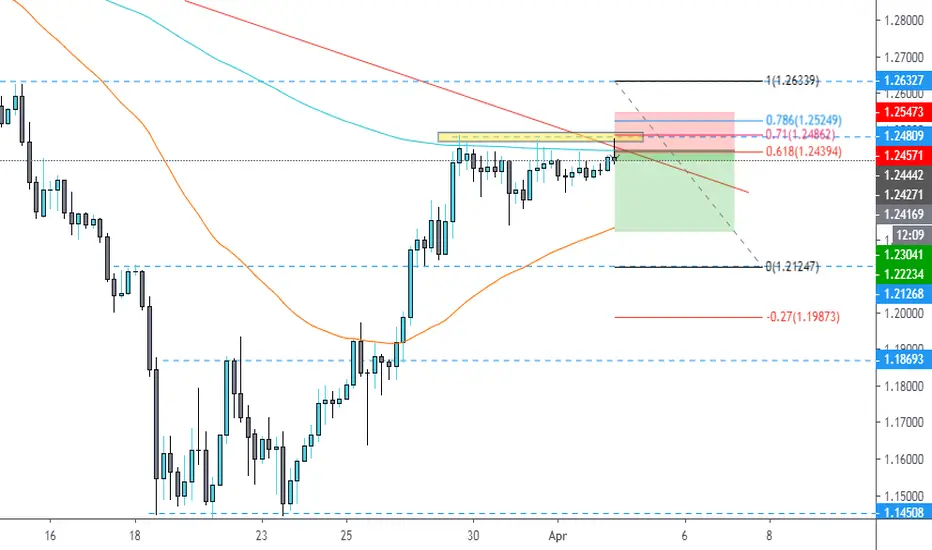
GBPUSD SHORTSeveral rejections of the yellow resistance area, rejections of the descending trendline and 200sma. Lines up perfectly with the 'golden pocket' area of the fibonacci.

BITCOIN PRICE REJECTS $6.9K? WHAT NEXT ?The price of bitcoin has shown a strong surge over the past weeks as price rallied from $3750 to $6900, however we see a rejection at the $6900 level which confirms a resistance.
The daily chart is showing a clear rejection which is not a bullish perspective to look for, since price wasn't able to break $6900. We could be looking at lower support levels below at $5600-5800, $4750-$4900 and $4250-$4400. These levels are substantially higher timeframe support levels which could provide potential long opportunities, if price rejects these levels spotted on the Daily chart then BTCUSD could be heading lower !
The price of bitcoin lost an uptrend, which indicates that there's more downwards momentum to come .
Risk Warning : The risk of loss in trading Foreign Exchange (FOREX) can be substantial.
You should therefore carefully consider whether trading is suitable for you in the light of your financial condition.
Goodluck !
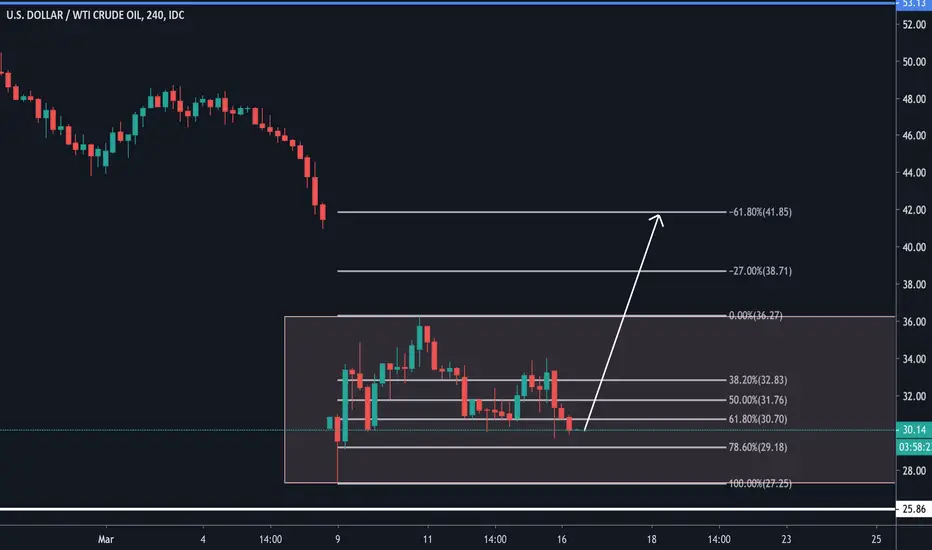
USD/WTI - LongUSD Crude Oil - Been watching this to see if we can fill the gap down from last week, on the daily not much has happened since the big weekly push down. We have been rejecting the 61.8% Fibonacci level and are currently testing it, looking to see if we reject here again, or manage to come down to touch the 78.6% level.
After we fill this gap, we could see some exhaustion and the bears may step in to take this down further, let's be patient and see how today pans out...
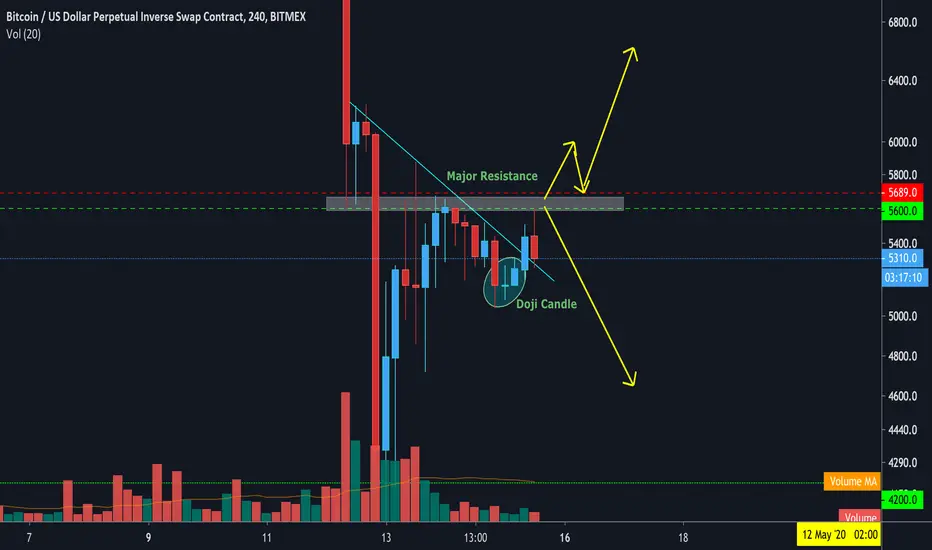
Direction Change or Resistance Bounce?!Looking more longterm on the 4 hourly candles we can see that we formed a doji candle indicating short term directional change within the market. We just recently touched a MAJOR resistance point of the market around the area of 5600, which ultimately could create a nice looking double top. Watch closely how the 4 hourly candle plays out because this was a huge rejection from 5600 in the time of writing this. If we fail to hold that resistance point and breakout of it, we may see a short term bull-run commencing...
Personally, I still got my bearish sentiment here and I'm still holding strong my 5600 short position with a tight stop loss at 5689.
I feel like we will bounce off the resistance here and develop further downside momentum, as the fundamentals with the coronavirus around aren't looking too good. Gold and the Cryptocurrency market failed to act as a hedge against the general economy as we saw investors start to withdraw their funds...The market is simply moving with the economical crisis at the moment, and as swing traders, it is our goal to catch those huge impulse waves in either direction.
Keep in mind it is only Sunday today, and the volume within markets tends to be rather low. Monday on the other hand, will open up with quite a GAP!! I am looking forward for the week ahead of us, as the opportunities are limitless! :)
This is NOT a financial advice, trade at your own risk!
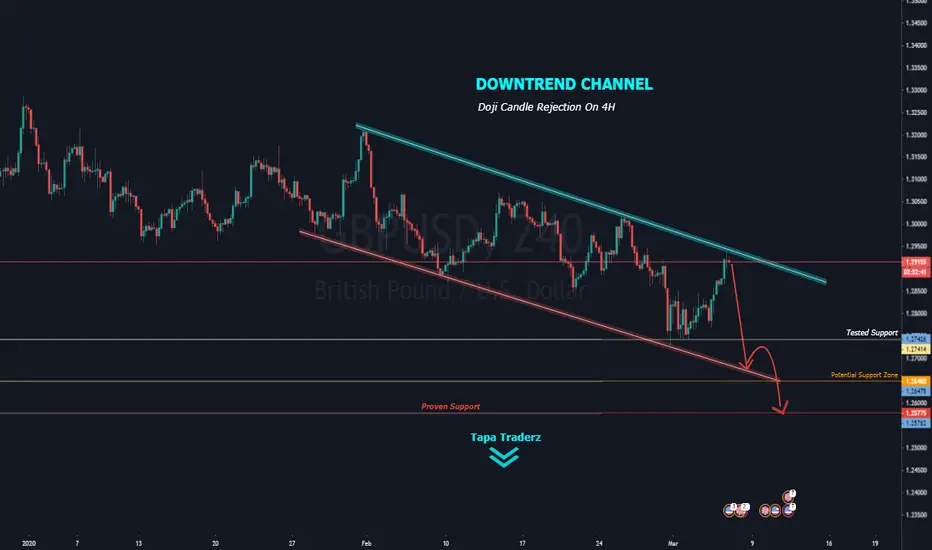
GBPUSD Downtrend ChannelThere was a quite Doji rejection on 4H
With Buyers been sceptical on their decision to move the market further
Due to NFP, tomorrow Dollar will push downward to the proven Support
Wait for another reversal confirmation candle that signifies bearish movement
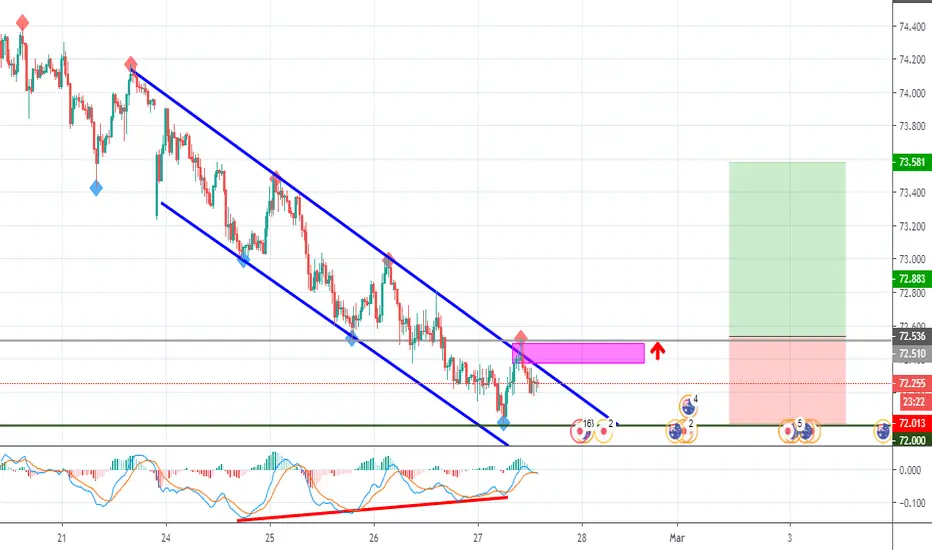
AUDJPY Potential Bullish MovementAUDJPY Potential Bullish Movement
we are waiting for a momentum candle close above 72.51 to buy this one
Reason:
1- Regular Bullish Divergence on MACD (in red)
2- Objective Channel (in blue)
3- Support Zone from Daily (in green) Round Number 72.00
Three confluences are enough to consider Buying AUDJPY , after a break below 72.51 (in gray)
USDJPY USDJPY SHORT
+ Rejecting the trendline
+ Rejecting from the wick box
+ Bearish divergence on the way
When the red box wil break out and find support on the crooked stip trendline, long to the trendline above and short from there if rejection finds place.
Higher timeframes we are short.
1ST TP: 109.90
2ND TP: Supportline of ascending triangle
Cheers.
Like & Subscribe!

NZDUSD Potential Bullish MovementNZDUSD Potential Bullish Movement
we are waiting for a momentum candle close above 0.63585 to buy this one
Reason:
1- Regular Bullish Divergence on MACD (in red)
2- Objective Trendline (in blue)
3- Support Zone from Daily
4- Double Bottom pattern (in blue)
Four confluences are enough to consider Buying NZDUSD, after a break below 0.63585 (in gray)

EURCHF - LongEURCHF analysis looking very strong indeed, currently consolidating around the exact zone where we've seen a ridiculous amount of market reversals, due to the current levelling rejecting its 3 year low along with a nice bullish engulfing candle its showing to be a great sign for a buy

#ETH's demand zoneDAILY
- 2 daily rejections
- a possible daily close with a Doji candle (Neutral) but must of the times a reversal
- Heavy daily resistance zone from 270$ till 290$
- If we draw a fib from the previous low to the high, the 0.5 level is into the demand zone
=> ETH will go back to the demand zone (225$- 217$) before a move up can happen.

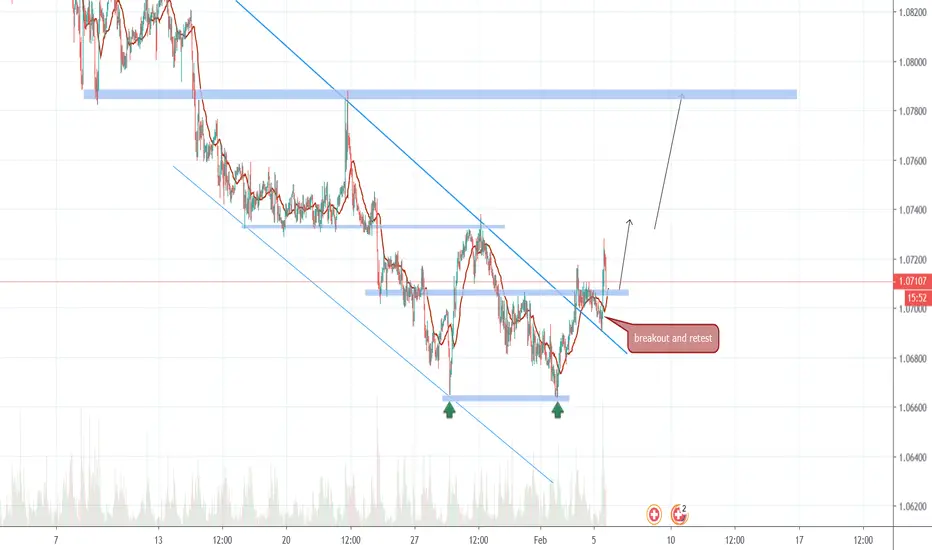
EURCHF BUY - 1 hrhere we have a clear double bottom.
followed by breakout by the upside.
we have now had a clear retest and the bulls have started to take over.
we should now see bulls continue to the upside.
EURUSD SELL - 4HRclear breakout here to the downside.
it has now completed a full retest and bears have now taken over.
We look for this to continue to the downside.

GBPAUD - SELL 4HRhere we have a nice trend flowing here with GBPAUD.
We have seen price reject from the top and should now flow nicely back down.
the bears have took over well and we look for this to continue.

USDCAD SELL - 4 hrhere we have a clear rejection in our 4hr timeframe against top trend line.
Bears should now come into play and have a great sell opportunity.
This has a strong potential for continuation to the downside.

GBPUSD Cable Long Term TradeI am looking at the potential for a long term buy & hold on GBPUSD.
There is a nice daily wedge pattern forming with price being supported by a lower bullish trendline and the daily 50EMA.
Multiple daily wick rejections are forming at this current zone and I think we could see a push upwards and break of the upper wedge trendline.
Risky entry = buy now and anticipate the break of the wedge.
Low risk entry = Wait for the wedge trendline to break first.
TP1 = Previous resistance at 1.35
Long term profit target = weekly/monthly resistance at 1.43500

GBP/USD SELL- 1.30738 Potential Target AreaPotential SELL Position on GBP/USD- 1.30738 Potential target

I THINK WE CAN SELL EUBUND ! TVC:EUBUND
Hello dear trader, first of all thank you for reacting to this analysis proposal with a like or a comment if you agree or if you have corrections to add!
We have a ascending triangele in formation
REASON OF BEARISH:
1- PRICE ACTION AND REJECTION OF THE RESISTANCE
2-RSI ABOVE 70

CHF/JPY SELLS - 112.583 Potential Target AreaPotential SELL Position on CHF/JPY - 112.583 Potential target

GBP/USD BUY - 1.30537 Potential Target AreaPotential BUY Position on GBP/USD- 11.30537 Potential target

DENIED But still bullish! - Bitcoin BeatsHello, Hello, Hello,
And welcome back, to Bitcoin Beats.
Yes. We got DESTROYED by the Chinese whales. Yes. I WAS bullish yesterday. BUT. I also said NOT to long until we CLOSE the daily candle outside of our resistance line. Because, AND I QUOTE "This could still be a trap here".
So I hope you're all having a great day, we have evidence here that we are more bullish as we haven't even wicked over that resistance line since $14,000 so there is hope and I am still very bullish to get to the next area upwards but this is still a rejection and we could head down from here in the short and medium term. For continuation upwards we need to either consolidate this area or bounce hard from $8500.
Thanks and Goodbye, From Bitcoin Beats
