RELIANCE INFRASTRUCTU - Bullish Flag & Pole Breakout (Daily T/F)Trade Setup
📌 Stock: RELIANCE INFRASTRUCTU ( NSE:RELINFRA )
📌 Trend: Strong Bullish Momentum
📌 Risk-Reward Ratio: 1:3 (Favorable)
🎯 Entry Zone: ₹385.00 (Breakout Confirmation)
🛑 Stop Loss: ₹293 (Daily Closing Basis) (-23 % Risk)
🎯 Target Levels:
₹412.50
₹441.95
₹472.55
₹506.05
₹542.30
₹580.65
₹616.10
₹654.00 (Final Target)
Technical Rationale
✅ Bullish Flag & Pole Breakout - Classic bullish pattern confirming uptrend continuation
✅ Strong Momentum - Daily RSI > 60, Weekly RSI >60 Monthly rsi >60
✅ Volume Confirmation - Breakout volume 2.73M vs previous day's 2.69M
✅ Multi-Timeframe Alignment - Daily and weekly charts showing strength
Key Observations
• The breakout comes with significantly higher volume, validating strength
• Well-defined pattern with clear price & volume breakout
• Conservative stop loss at recent swing low
Trade Management Strategy
• Consider partial profit booking at each target level
• Move stop loss to breakeven after Target 1 is achieved
• Trail stop loss to protect profits as price progresses
Disclaimer ⚠️
This analysis is strictly for educational purposes and should not be construed as financial advice. Trading in equities involves substantial risk of capital loss. Past performance is not indicative of future results. Always conduct your own research, consider your risk appetite, and consult a financial advisor before making any investment decisions. The author assumes no responsibility for any trading outcomes based on this information.
What do you think? Are you watching NSE:RELINFRA for this breakout opportunity? Share your views in the comments!
Relianceinfra

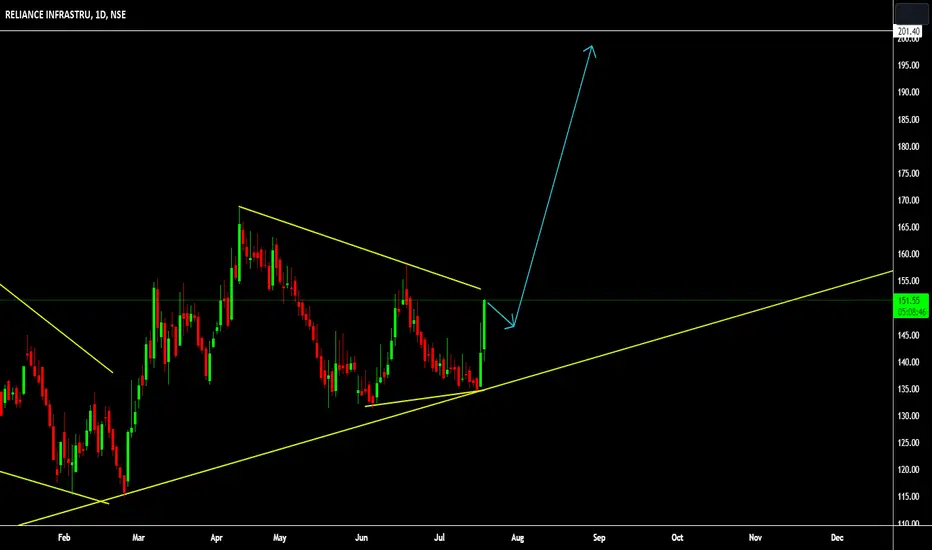
DAILY CHART - RELIANCE INFRAThe Structure looks good to us, waiting for this instrument to correct and then give us these opportunities as shown on this instrument (Price Chart).
Note: Its my view only and its for educational purpose only. Only who has got knowledge about this strategy, will understand what to be done on this setup. its purely based on my technical analysis only (strategies). we don't focus on the short term moves, we look for only for Bullish or Bearish Impulsive moves on the setups after a good price action is formed as per the strategy. we never get into corrective moves. because it will test our patience and also it will be a bullish or a bearish trap. and try trade the big moves.
we do not get into bullish or bearish traps. We anticipate and get into only big bullish or bearish moves (Impulsive Moves). Just ride the Bullish or Bearish Impulsive Move. Learn & Know the Complete Market Cycle.
Buy Low and Sell High Concept. Buy at Cheaper Price and Sell at Expensive Price.
Keep it simple, keep it Unique.
please keep your comments useful & respectful.
Thanks for your support....
Tradelikemee Academy
RELIANCE : near resistance RELIANCE : Down trend in hourly chart since many days. now its near to resistance for trendline & also near flip Resistance. Please watch closely (in 15 min chart ) all the candle formation and enter in trade. IF Breakout & retest of Flip level we can see 2600 on table and Nifty with our next target as per Nifty chart.
Like, Share, Comment for regular updates.
Disclaimer
I am not sebi registered analyst
My studies are Educational purpose only
Please consult with your Financial advisor before trading or investing

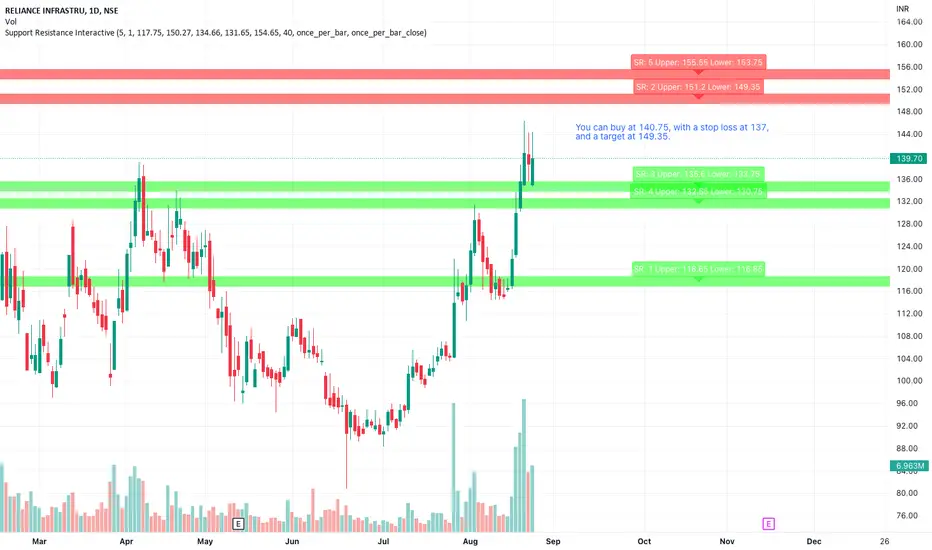
Reliance Infra Idea for 25 August, 2022 - TradesetupYou can buy at 140.75, with a stop loss at 137, and a target at 149.35.
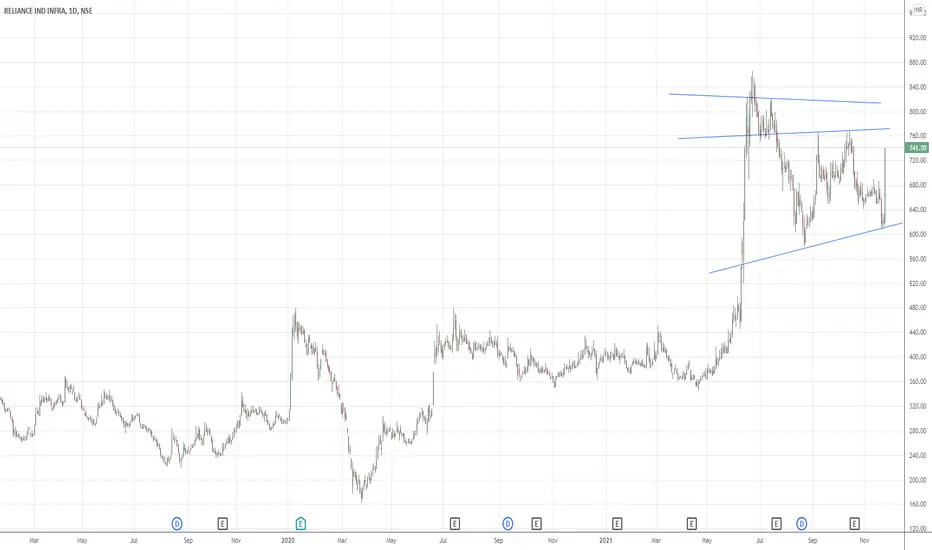
RIIL - Long viewTrading idea for the stock
Buy: 757
Target: 804
Stop loss: 747
Profit: 4700
Loss: 1000
Risk/Reward: 1:4.7
Quantity: 100
Look for booking partial profit at 780 levels and then trail the rest.
R1 - 782.90
R2 - 824.10
R3 - 906.50
S1 - 659.30
S2 - 576.90
S3 - 535.70
Ruel Fernandes
ruelfernandes@gmail.com
9819683693

Reliance Ascending Triangle Breakout We discuss about daily breakout in last chart and we have that daily breakout now price going above.
Target overall done with reliance debt free .. more to come

Reliance Infrastructure Ltd Technical Analysis Indian StockReliance Infrastructure Ltd Technical Analysis Indian Stock Market
Reliance Infrastructure (RInfra) is involved in the infrastructure sector. The Company is a utility company with presence across the chain of power businesses, such as generation, transmission, distribution and power trading.
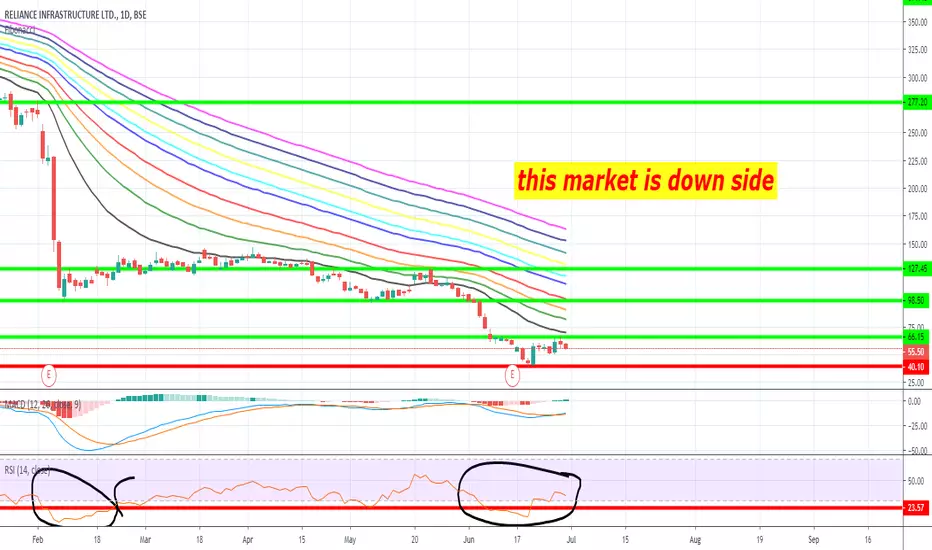
reliance infrastructure - Where is the bottom?Hello everyone
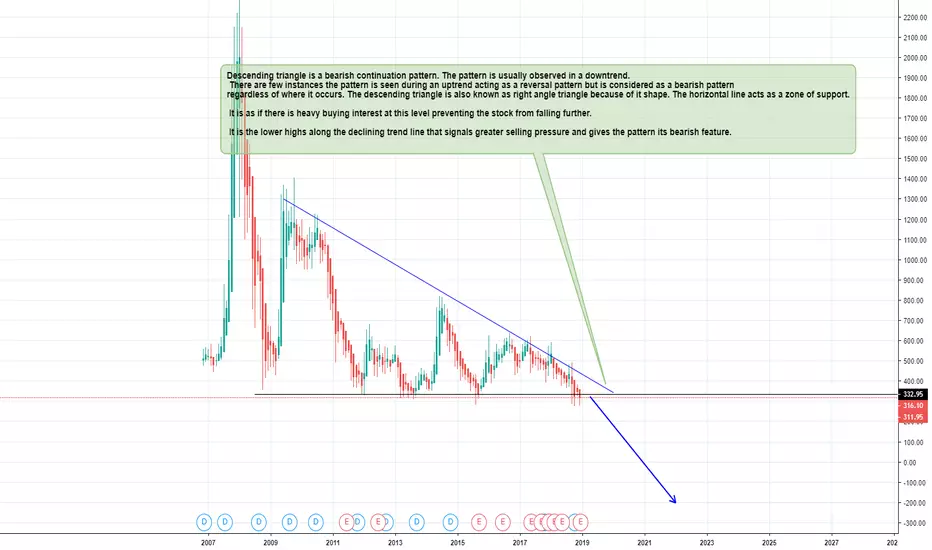
In long term I can see that reliance infrastructure bottom is stil not come. Consider to watch the chart, It make a descending triangle pattern.
What is descending triangle pattern?
Answer :
Descending triangle is a bearish continuation pattern. The pattern is usually observed in a downtrend. There are few instances the pattern is seen during an uptrend acting as a reversal pattern but is considered as a bearish pattern regardless of where it occurs. The descending triangle is also known as right angle triangle because of it shape. The horizontal line acts as a zone of support. It is as if there is heavy buying interest at this level preventing the stock from falling further. It is the lower highs along the declining trend line that signals greater selling pressure and gives the pattern its bearish feature.
The technical target is arrived at by computing the vertical height of the pattern and adding this height to the breakout point. It can also be computed by drawing a line parallel to the base of the triangle through the trough of the first correction.
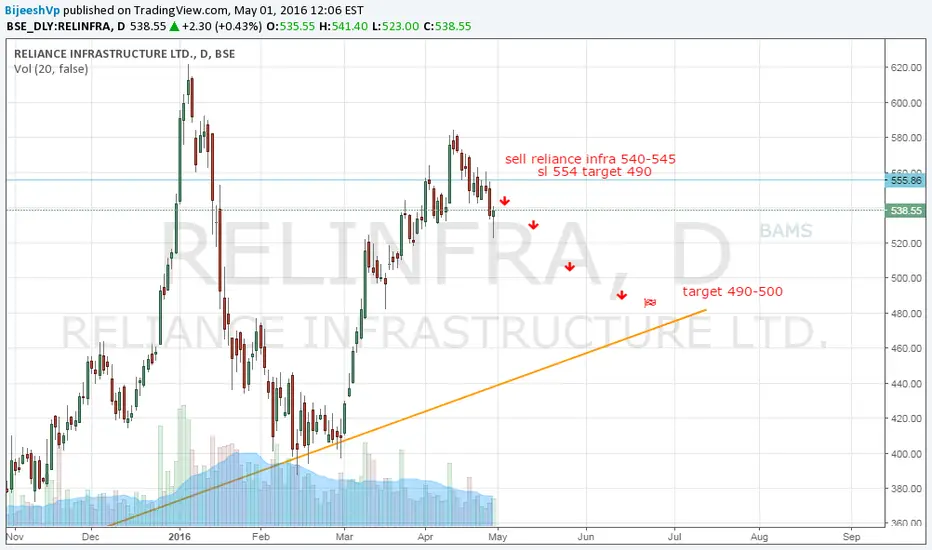
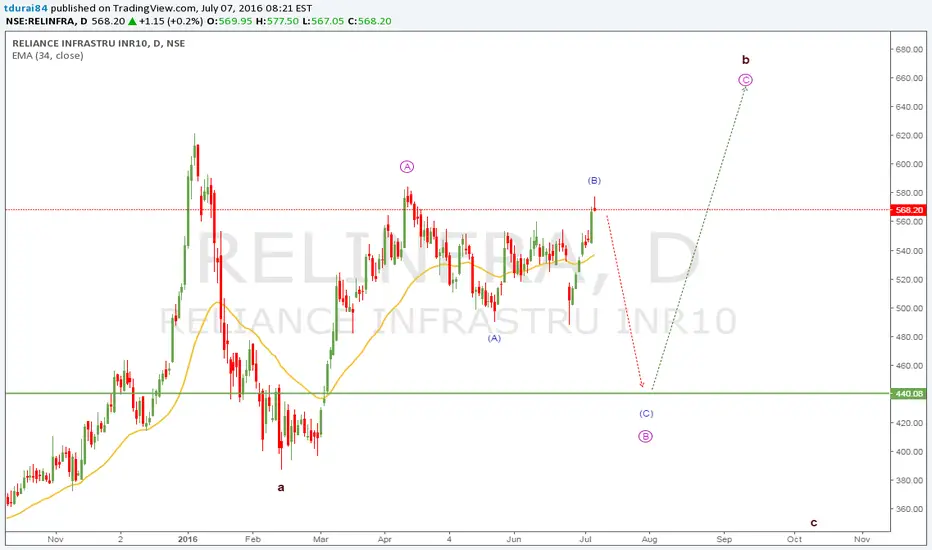
RELIANCE INFRA WAVE ANALYSIS 7 JUL 2016Reliance Infra - as per wave analysis chart looks like Long term Downside. On medium term we get some corrective upside.
On next 7 to 8 trading we can expect price could reach 440 region.
sell reliance infra 540-545 with small sl 554 target 490 sell reliance infra 540-545 with the small stop loss 554 for the target 490