RNDR/USDT at a Critical Turning Point: Golden Pocket as the Key?✨ Overview:
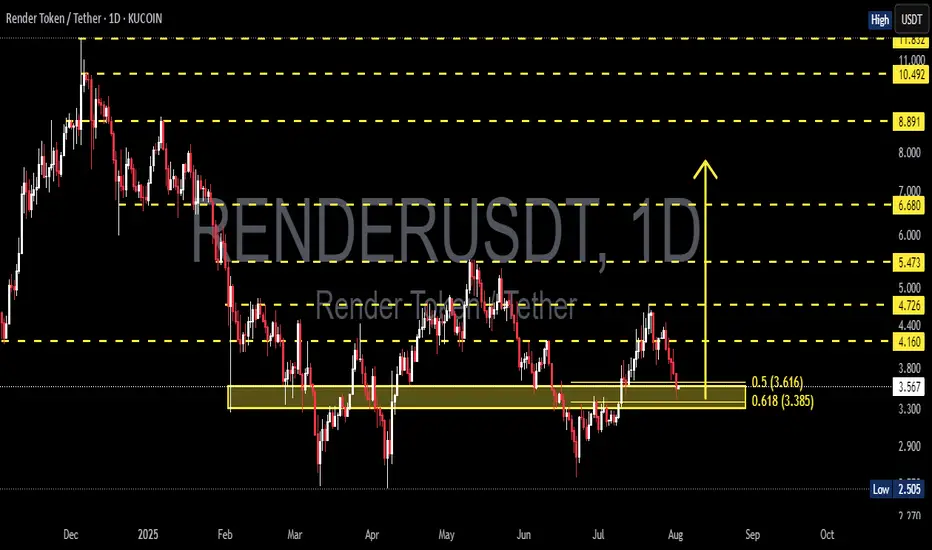
Render Token (RNDR) is currently testing a crucial support zone — the Golden Pocket Fibonacci Retracement between 0.5 (3.616) and 0.618 (3.385). This zone not only represents a significant retracement level but has historically acted as a strong demand area, often serving as a springboard for major price reversals.
---
🧠 Detailed Technical Analysis:
🔸 Support Zone & Golden Pocket
Price has retraced back to the 0.5 – 0.618 Fibonacci zone, a high-probability reversal area.
This zone has acted as a demand base multiple times since February 2025.
How the price reacts here will likely define the next major trend direction.
🔸 Market Structure
The overall structure shows a mid-term downtrend, marked by lower highs and lower lows.
However, the current price action shows slowing bearish momentum, indicating potential hidden accumulation.
A potential double bottom pattern could be forming, hinting at a bullish reversal if confirmed.
---
📈 Bullish Scenario:
1. Strong Rebound from the Golden Pocket
Watch for bullish candlestick patterns (e.g., pin bar, bullish engulfing) near $3.38–$3.61.
Initial resistance levels: $4.16 – $4.72
If broken, mid-term targets could extend to $5.47 – $6.68
2. Double Bottom Confirmation
A confirmed double bottom with a neckline breakout around $4.16 would greatly strengthen bullish momentum.
3. Increased Buying Volume
A spike in volume during the rebound would validate bullish sentiment and potential trend reversal.
---
📉 Bearish Scenario:
1. Breakdown Below the Golden Pocket
If the price breaks below $3.385 with strong volume, we could see a move down toward $2.77, the next significant support.
2. Weak Bounce / Lower High
A failed breakout above $4.16 may indicate a bearish continuation after a temporary relief rally.
---
📌 Summary:
RNDR is currently at a technically sensitive zone. The Golden Pocket between $3.38 and $3.61 is the key area to watch. A strong bullish reaction could signal the start of a trend reversal, while a breakdown could trigger further downside continuation. Traders are advised to wait for clear confirmation via price action before committing to any strong positions.
---
🔖 Key Levels to Watch:
Level Description
3.38 – 3.61 Golden Pocket (Potential Buy Zone)
4.16 Minor Resistance
4.72 Bullish Breakout Trigger
5.47 – 6.68 Mid-Term Reversal Targets
2.77 Strong Support if Breakdown Occurs
---
🧩 Chart Patterns Observed:
Potential Double Bottom – early bullish reversal signal.
Golden Pocket Reaction Setup
Descending Structure – still intact but weakening.
---
🔍 Trade Ideas:
🔄 Wait-and-see approach: Wait for clear bullish confirmation on daily candles.
🎯 Aggressive Long Entry: Around 3.40–3.60 with a tight stop-loss.
⚠️ Short Opportunity: If a strong breakdown below 3.38 occurs with volume confirmation.
#RNDR #RenderToken #RNDRUSDT #CryptoAnalysis #GoldenPocket #FibonacciRetracement #DoubleBottom #PriceAction #SupportResistance #AltcoinSetup #CryptoSignals #TechnicalAnalysis
Rendertoken
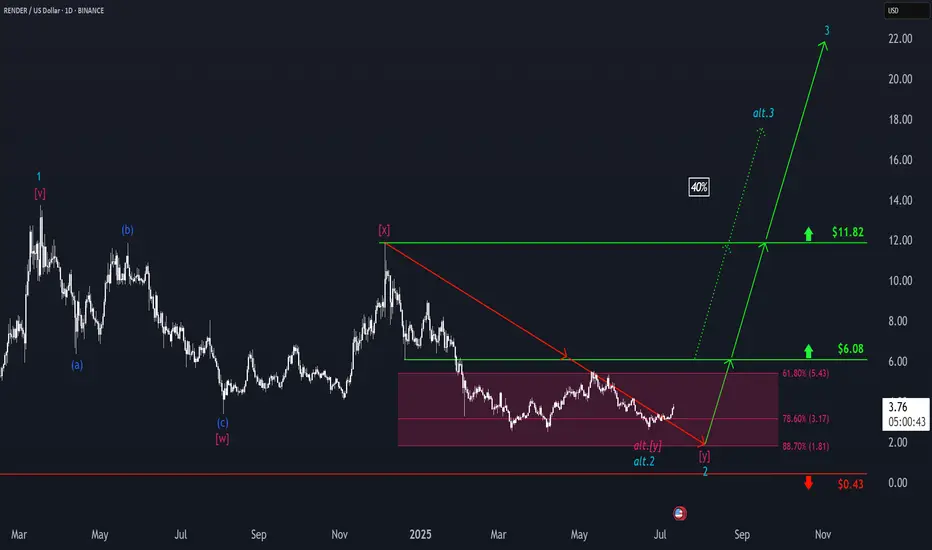
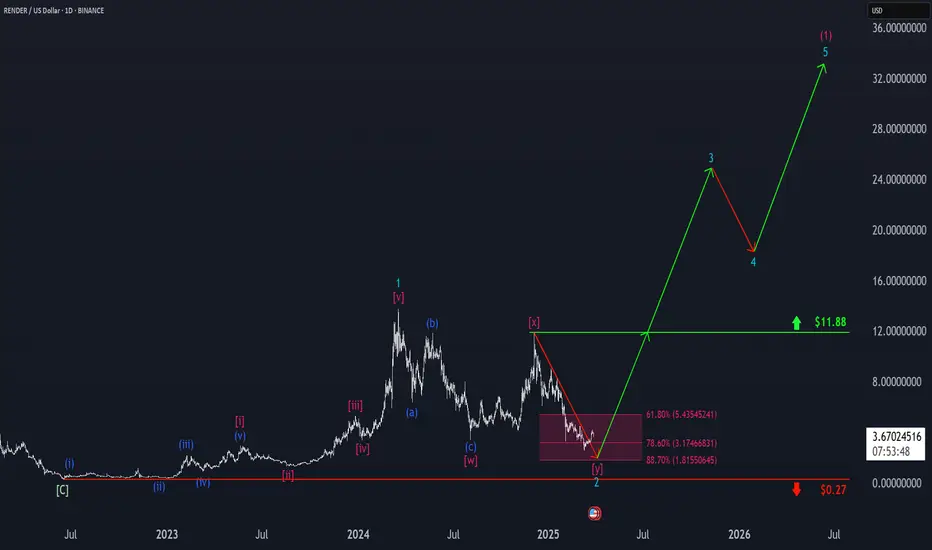
RENDER: Is the Correction Over?RENDER has surged nearly 20% at its peak recently. This prompts the question of whether the wave 2 correction low may already be in place. We continue to consider this scenario as our alternative outlook, in which we would anticipate direct gains above the resistance levels at $6.08 and $11.82 (probability: 40%). However, our primary expectation remains that a new low will be set within our magenta Target Zone (coordinates: $5.43–$1.81) before the projected upward moves unfold.
📈 Over 190 precise analyses, clear entry points, and defined Target Zones - that's what we do.
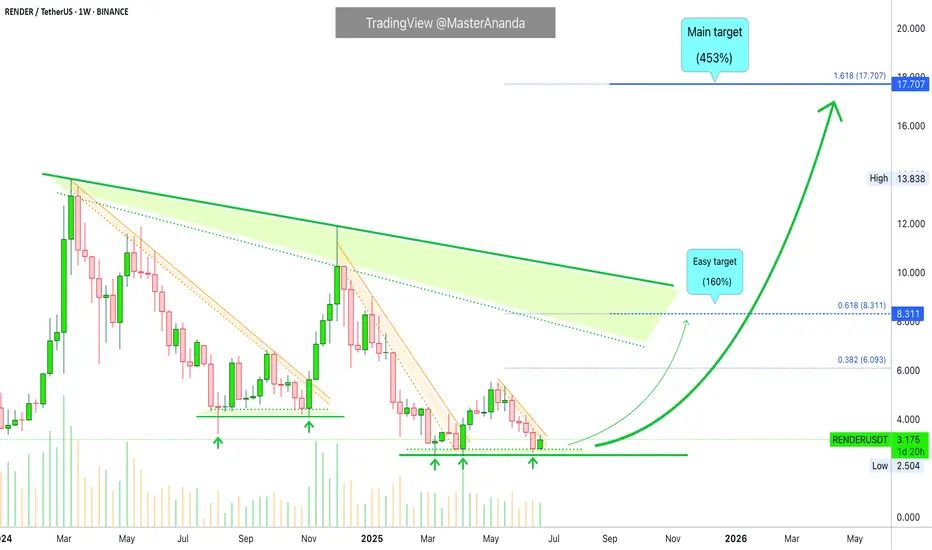
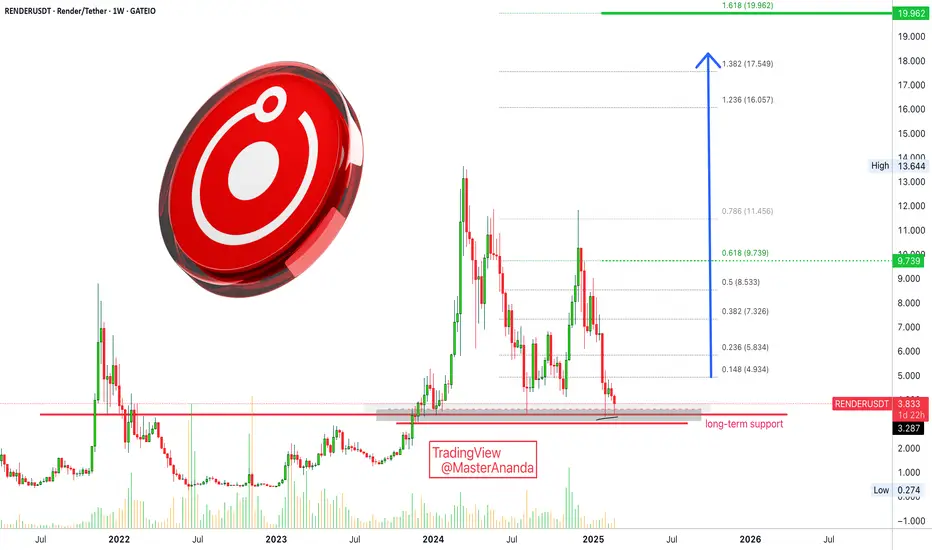
Render Token Buy Zone: New ATH $17.7, $27 & $46, 2025-26Render Token (RENDERUSDT) is moving within a strong buy zone. Any price below the 5-August 2024 low is a great entry when you aim for the 2025/26 bull market wave. That is, any entry below $3.41 is a very strong, low risk and high potential for reward buy. This is a solid pair.
Remember in 2024 when I told you it was going down, down, down, down? It has been going down for more than a year and three months. There is good news though, Render Token will go down no more.
The chart shows lower highs and lower lows. The last four months have the same base, no new lows. The lows in late 2024 are also not that far away.
Late 2025 & early 2026 targets (New all-time high)
The lower highs are part of a classic correction pattern, with the current chart structure opening up an easy 160% target. This is very easy.
The main target can reach $17.7 (PP: 453%) with higher prices being almost certain. The last target can be around $27 or $46, for these, we will have to wait and see.
When to sell
If the initial move has much force, buyers support and bullish momentum, we can aim for the higher targets. If the initial action is weak and there isn't enough market-buyers support, then we aim lower; it all depends on how the bull market develops but overall the potential is very strong. For Render, for Bitcoin and the rest of the altcoins.
Thanks for the support.
Namaste.
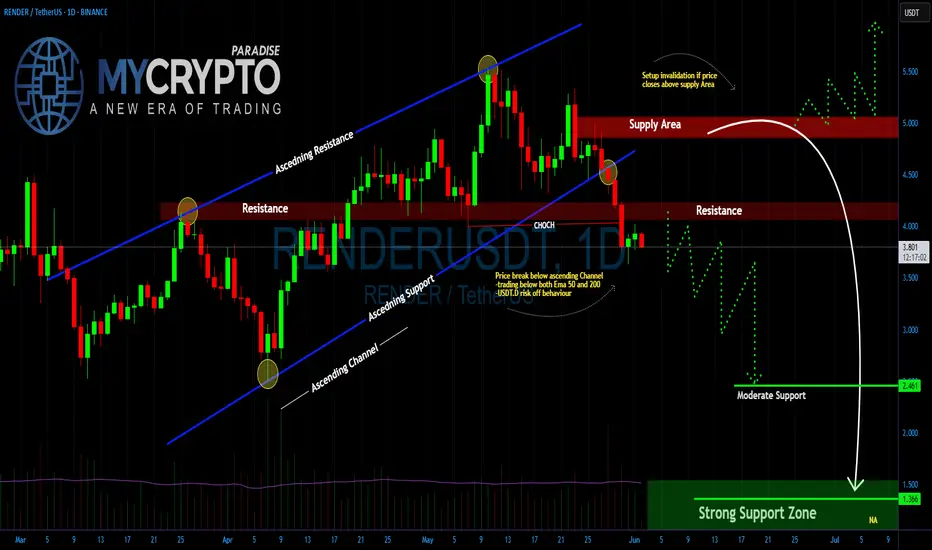
RENDER Is $1.366 the Next Stop Before a Major Market Reversal?Yello Paradisers! Are you prepared for the drop that could clean out both bulls and bears before the real move begins? Or will you be caught in another trap?
💎#RENDERUSDT has broken down from its ascending channel. This confirms that bullish momentum has faded, and the structure no longer supports higher prices.
💎The price is now trading below both the 50 EMA and 200 EMA on the daily timeframe. These are key trend indicators. Losing them shifts the bias to the downside. After rejection from the $5.00–$5.40 supply zone, the market failed to make a new high. That area remains strong resistance. Bulls must reclaim it to regain control.
💎Previous support around $4.00 has now turned into resistance. As long as price stays below this zone, lower targets remain in play.The next support is around $2.46, but that may only offer temporary relief. The real demand zone sits near $1.366, where stronger buying interest is expected.
💎Tether dominance (USDT.D) is showing early signs of risk-off behavior. It has reclaimed the 21, 50, and is now testing the 200 EMA at 4.88%. This suggests capital is rotating out of altcoins and into stablecoins.This shift is backed by rising volume. It's not retail noise it’s institutional positioning. The market is preparing for a deeper correction.
Stay disciplined. The next big opportunity will come to those who wait not those who chase.
MyCryptoParadise
iFeel the success🌴
#RENDER/USDT#RENDER
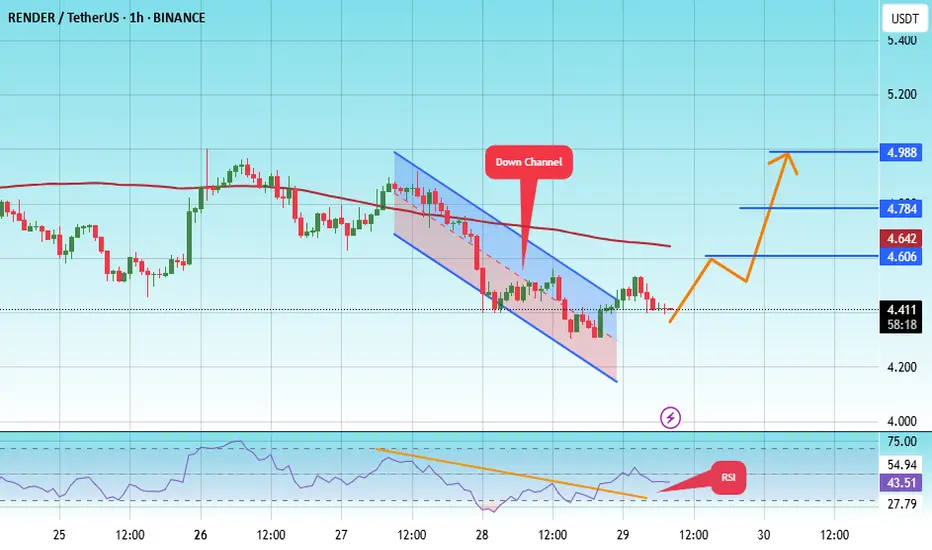
The price is moving within a descending channel on the 1-hour frame, adhering well to it, and is heading for a strong breakout and retest.
We are experiencing a rebound from the lower boundary of the descending channel, which is support at 4.20.
We are experiencing a downtrend on the RSI indicator that is about to break and retest, supporting the upward trend.
We are looking for stability above the 100 Moving Average.
Entry price: 4.41
First target: 4.60
Second target: 4.78
Third target: 4.98
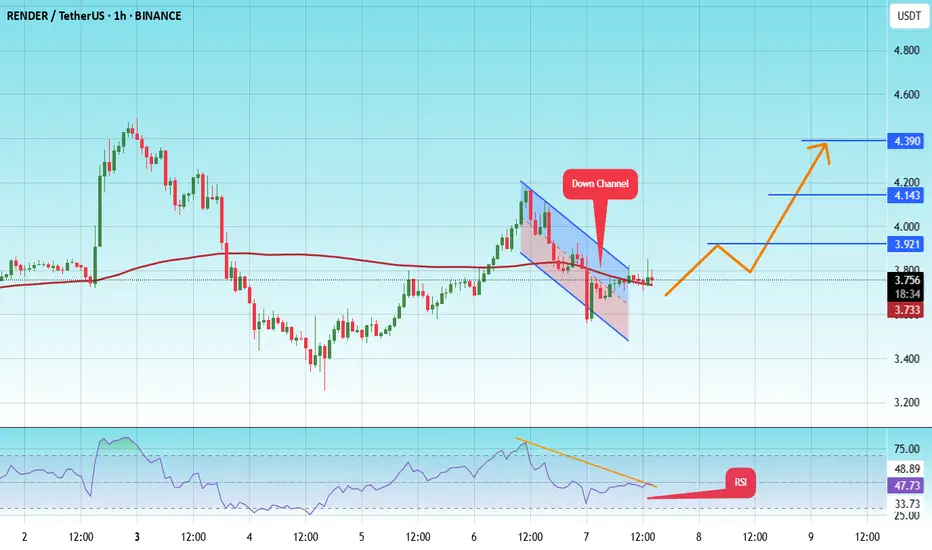
#RENDER/USDT#RENDER
The price is moving in a descending channel on the 1-hour frame and is expected to continue upwards
We have a trend to stabilize above the moving average 100 again
We have a descending trend on the RSI indicator that supports the rise by breaking it upwards
We have a support area at the lower limit of the channel at a price of 3.55
Entry price 3.75
First target 3.92
Second target 4.14
Third target 4.40
RENDERUSDT 1D Analysis RENDER ~ 1D Analysis
#RENDER Buy gradually from here if you still have confidence in this coin with a short term target of at least 10%++ from here.

RENDERUSDT 1D AnalysisRENDER ~ 1D Analysis
#RENDER Buy after successfully penetrating this resistant line with a short -term target of at least 10%+ from here.

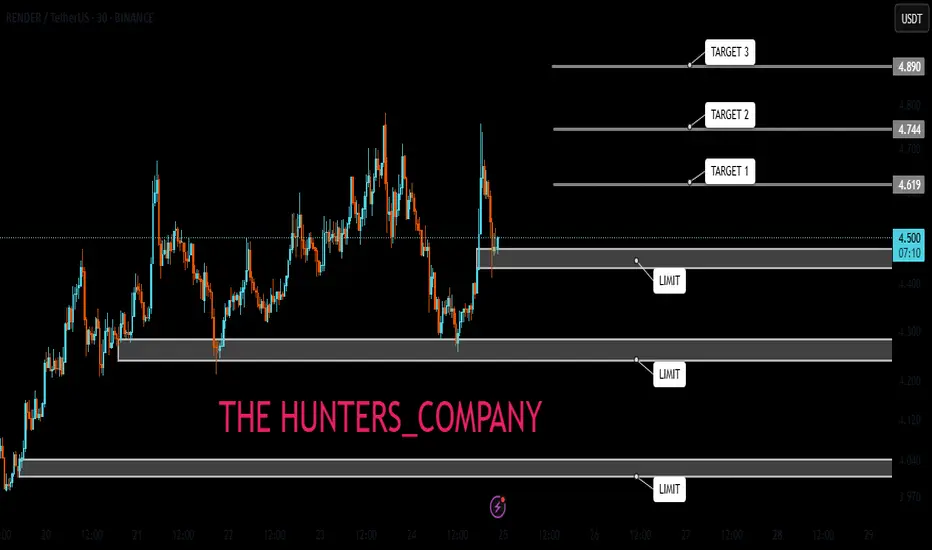
RENDER/USDT:BUY Hello friends
Given the price growth we had, a range has now been created in the price correction, which indicates the strength of the trend, so we can enter the trade.
The purchase and target points have also been identified...
Follow capital management.
*Trade safely with us*
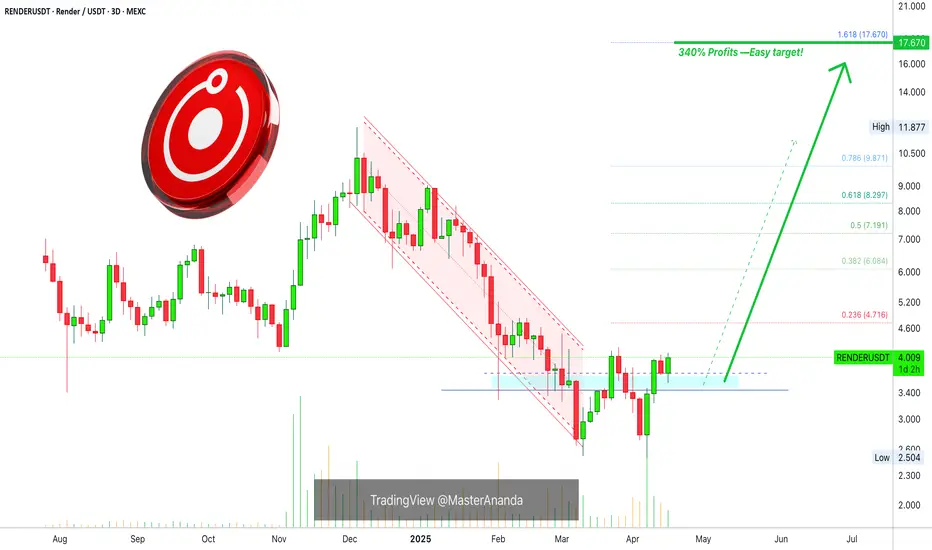
Render Is Ready, Bottom Confirmed (340% Easy Target)Render Token is super ready right now and the correction bottom is now confirmed. Notice this pattern on the chart. There are two lows and then a move back above support.
The current candle is the bullish signal. After trading lower, it is now at the upper end of the session, trading near the session high. This high is higher than the previous session open and the close of the one preceding it, the full green candle.
After the main low there were two strong green sessions. Followed by one red session and the current session moving lower, meaning bearish action. This bearish action is being negated and once this session closes green, we have a very strong bullish signal with the bottom confirmed. This will be the start of the next bull market phase.
There will be long-term growth. RENDERUSDT can grow much more than the 340% shown on the chart. It will definitely go much higher, this target is for the mid-term, within 3 months. It will start to grow now, in the coming days and weeks and everything will speed up. This target will hit but no big deal, there will be more.
Expect a correction between now and the final bull market bull-run. The correction can last three weeks just as it can last 2 full months or more. We will have a better idea when the bull market starts to develop. It is still very early but also very close. We have only a few weeks before the entire Cryptocurrency market turns green.
Namaste.
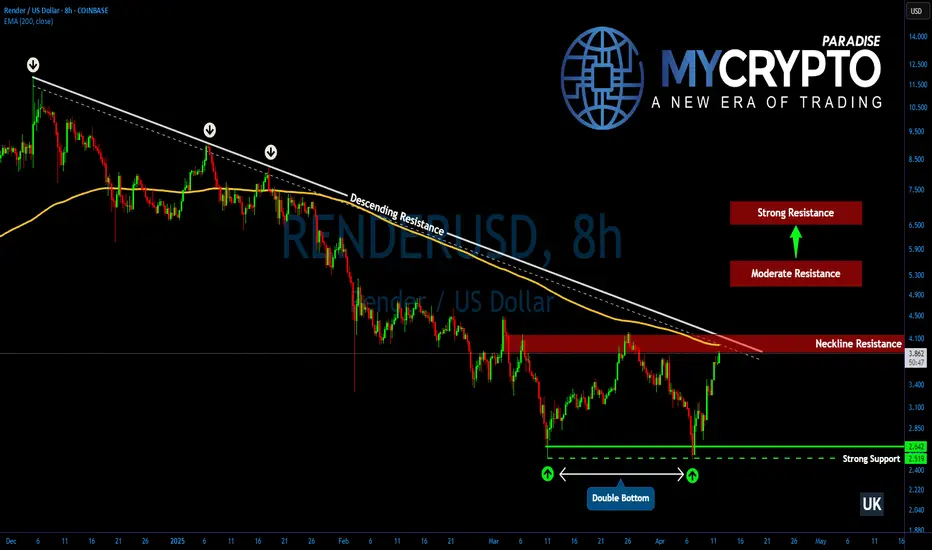
Is RENDER About to Explode? Here is What You Need to Know!Yello, Paradisers! Could this be the final shakeout before #RENDER kicks off a fresh rally? After weeks of heavy bleeding, we're now spotting a textbook bottoming structure — and if you're not paying attention, you might miss one of the cleanest setups we've seen in a while. Let’s break it down.
💎#RENDERUSDT is attempting to solidify a double bottom formation right at a strong historical support zone between $2.50–$2.65. This area has already shown its strength in the past, and now the bulls are trying to use it as a launchpad again.
💎But the real battle zone is at the $4.00 to $4.20 range. This isn't just another resistance. It's a pivotal multi-resistance zone acting as the neckline of the double bottom and is stacked with congestion from previous price rejections. For bulls to reclaim control, we need to see a strong breakout above $4.20 — ideally supported by increasing volume.
💎If that breakout plays out, the next target comes in at $5.10 to $5.40, where partial profit-taking is expected. However, if bulls remain in charge and manage to suppress any selling pressure, we could be looking at a push toward the $6.70 to $7.00 resistance — a level with significant historical relevance.
💎On the flip side, if the breakout fails and we revisit lower levels, RENDER still has a solid basing support between $2.50–$2.65, keeping the bullish structure intact unless we lose this zone.
💎Additionally, the chart is showing signs of a potential golden cross formation forming soon, which would further reinforce the bullish momentum and confirm strength ahead.
Paradisers, strive for consistency, not quick profits. Treat the market as a businessman, not as a gambler.
MyCryptoParadise
iFeel the success🌴
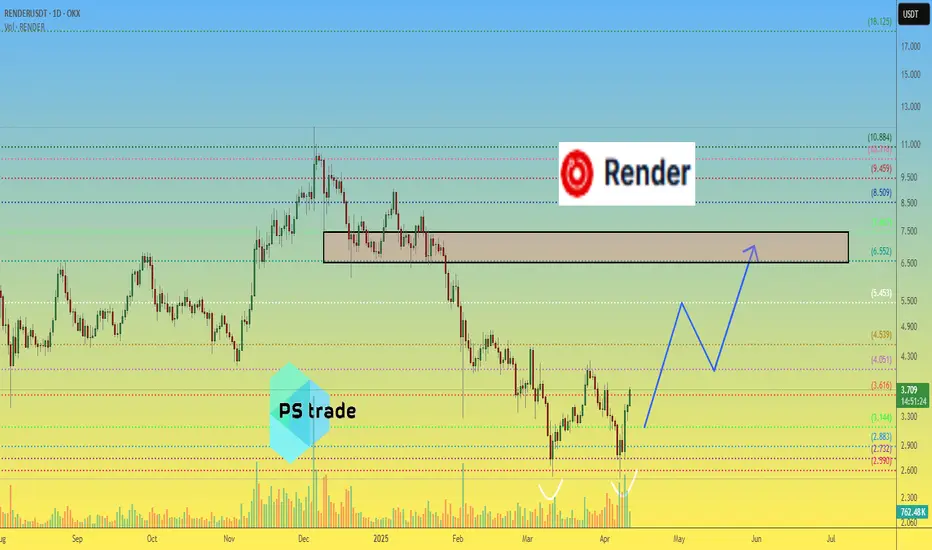
RENDER price analysisOKX:RENDERUSDT chart is starting to show increased trading volumes.
This could mean that the double bottom is coming to an end.
🟨 Risky - to try to buy #RENDER near $3
🟩 Safe - buy #RENDER after the price is fixed above $4
And then in the range of $6.50-7.50
Which way will you choose?
_____________________
Did you like our analysis? Leave a comment, like, and follow to get more
RENDERUSDT 1WRENDER ~ 1W Analysis
#RENDER Buy gradually from here with a short -term target of at least 20%++.

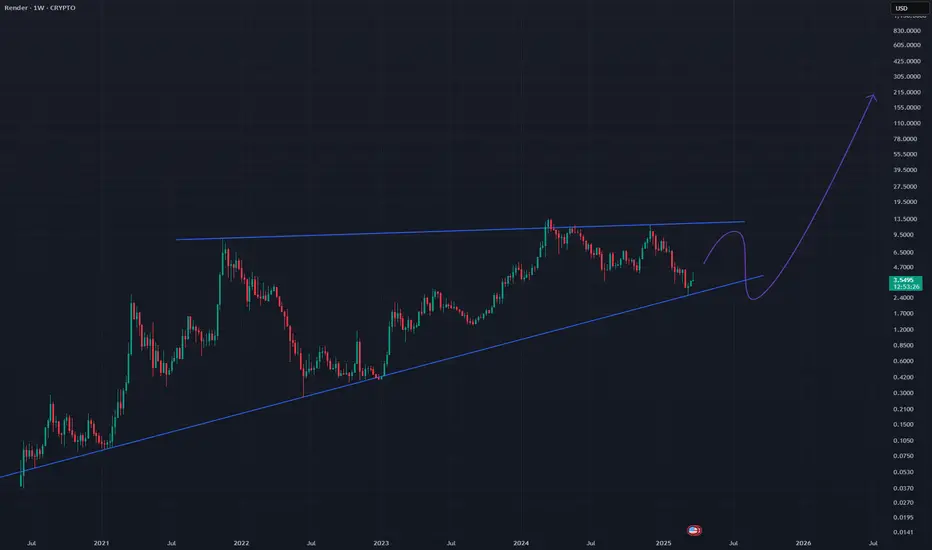
RENDERUSD - Ascending TriangleA nice bullish triangle structure this time ascending
Great bull break out situation
I sometimes can mistake ascending triangles for rising wedges but im pretty sure this is an ascending triangle
They look similar!
Weekly timeframe
Render: Running on Empty?Render has climbed nearly 50% since the low in the second week of March but lost notable ground recently. The price remains within our magenta Target Zone between $5.43 and $1.81 and could still dip toward the lower boundary as it works toward completing the turquoise wave 2. Once a sustainable bullish reversal takes hold, we expect a strong rally in the turquoise impulse wave 3, which should target new all-time highs. The resistance at $11.88, which marks the top of the magenta wave from early December, should be surpassed decisively as momentum builds.
ALTS Shine, +55% INCREASE !! FTM | RNDR | Render and Fantom have made steep increases over the past two weeks.
In the past two weeks, FTM increased a whopping 55%:
And RNDR increased around the same amount:
This naturally makes it likely to see a correction soon, which may be the ideal time to get into the accumulation boat - or just for a swing trade.
________________________
GEMINI:RNDRUSD CRYPTO:FTMUSD

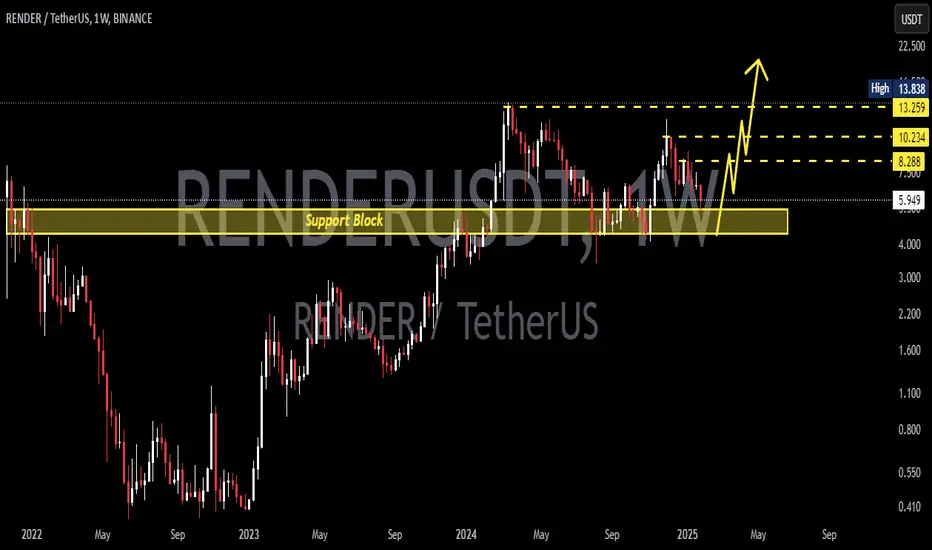
RENDERUSDT 1WRENDER ~ 1W Analysis
#RENDER If you still have a Conviction on this coin. Maybe this support block you can consider to start buying back with a short -term target 20%+.
RENDER/USDT:UPDATEHello friends
Given the good return that the price has had, especially from an important support, it can be understood that the buyers have become strong and we can play behind their hands.
We have specified the buying steps for you and the goals have also been specified.
I hope you like it and support us.
*Trade safely with us*
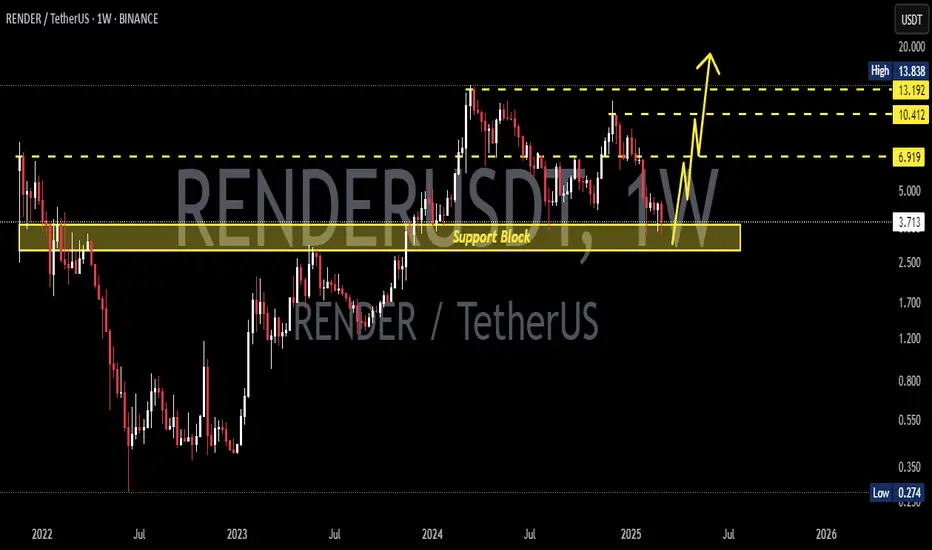
Render Token Activates Long-Term SupportRender Token (RENDERUSDT) entered the bullish zone in late 2023 when it broke above $3.333. This is mapped on the chart as "long-term support."
Good evening my friend...
Incidentally, this same long-term support level matches MA200 on the weekly timeframe.
This support zone launched the early 2024 bullish cycle and also worked as support in August 2024. In both instances, as soon as this level was activated the market experienced sustained growth.
The same is happening again now, there can be some variations.
Instead of straight up as it happened in the past, there can be some sideways, consolidation/accumulation, before the next rise.
As long as RENDERUSDT trades above this level we can expect growth. This level can be pierced on a wick and the bullish bias and potential remains. If prices move below, a buy opportunity. Cryptocurrency is bullish regardless of the short-term.
The time to buy is now.
Thanks a lot for your continued support.
Remember to do your own research and develop a plan before buying any Altcoin. A preconceived plan can help you eliminate stress and increase positive trading results. A plan can be as simple as knowing if you are ready to hold no matter what happens. If you are ready to hold long-term, your plan can consist in buying each time your favorite pair hits support. Buy and hold. Once the action turns bullish and the market turns green, you will be happy with the results.
One day the market is down and red; the next day everything changes.
Surprise!!! And we are going up.
Namaste.
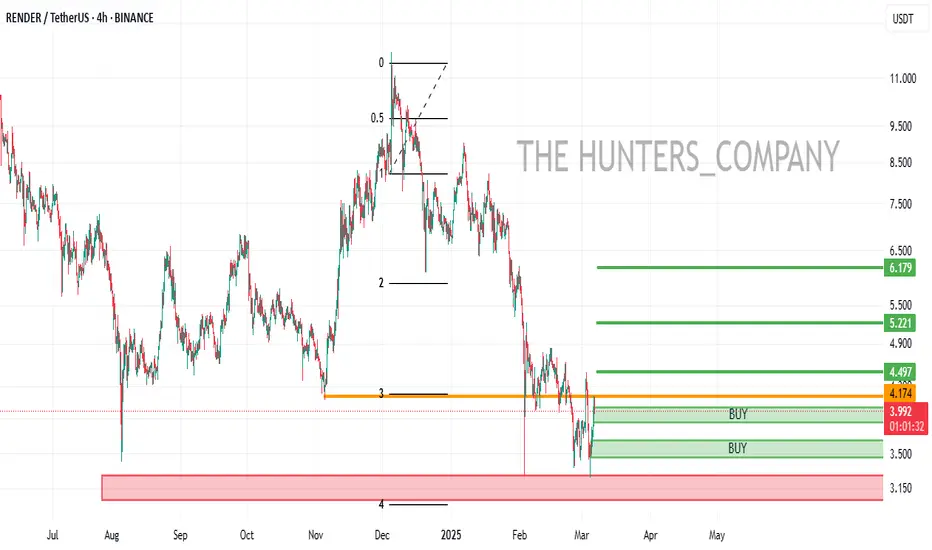
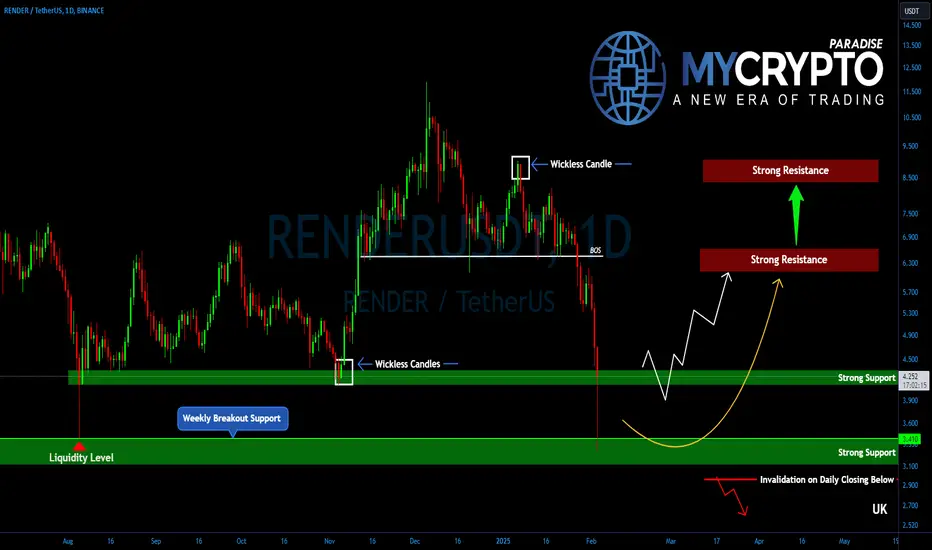
RENDERUSDT Below Key Support—But Is a Massive Reversal Incoming?Yello, Paradisers! #RENDERUSDT just broke a critical support level, triggering a major downside move. But here’s where things get interesting—before this drop, RENDER left behind wickless candles at $8.70 to $8.80, signaling unfinished business at higher levels. Could a sharp reversal be on the cards? Let’s break it down.
💎Right now, #RENDER has tested the breakout support region between $3.40 - $3.15—the same level that originally fueled its last major rally. This is a key demand zone where bulls are likely to step in aggressively, triggering short-covering and possibly even a higher time-frame reversal.
💎Sellers need to be extremely cautious here. This zone has the potential to create a slingshot effect, where a sudden surge in buying pressure could trap shorts and send RENDER flying back up before they can react.
💎If bulls successfully defend this level, the first upside target sits at $5.65. A breakout above this could open the door toward $6.25 - $6.55, a pivotal resistance zone that will determine whether RENDER can regain full bullish momentum. Strength above this level would likely send the price surging toward the wickless candle at $8.80, where unfinished liquidity could be swept.
Patience and discipline are key here, Paradisers. The market often tests both bulls and bears before making decisive moves, so stay vigilant.
MyCryptoParadise
iFeel the success🌴
RENDERUSDT 1WRENDER ~ 1W Analysis
#RENDER Re-test this support, Buy from here if you still have a Conviction on this coin with a minimum target of 20%+
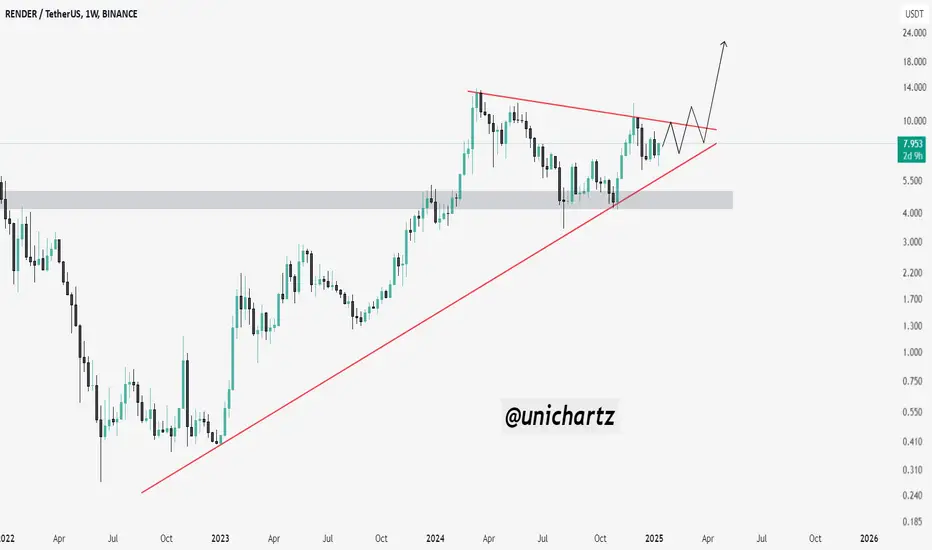
RENDER/USDT: A Strong Contender for Your Spot PortfolioRENDER/USDT is currently one of the strongest altcoins to consider adding to your spot portfolio. The price is trading within an ascending triangle pattern, which is a bullish continuation setup.
has been consistently forming higher lows while holding strong above the key support zone (marked in grey) and the upward trendline.
DYOR, NFA
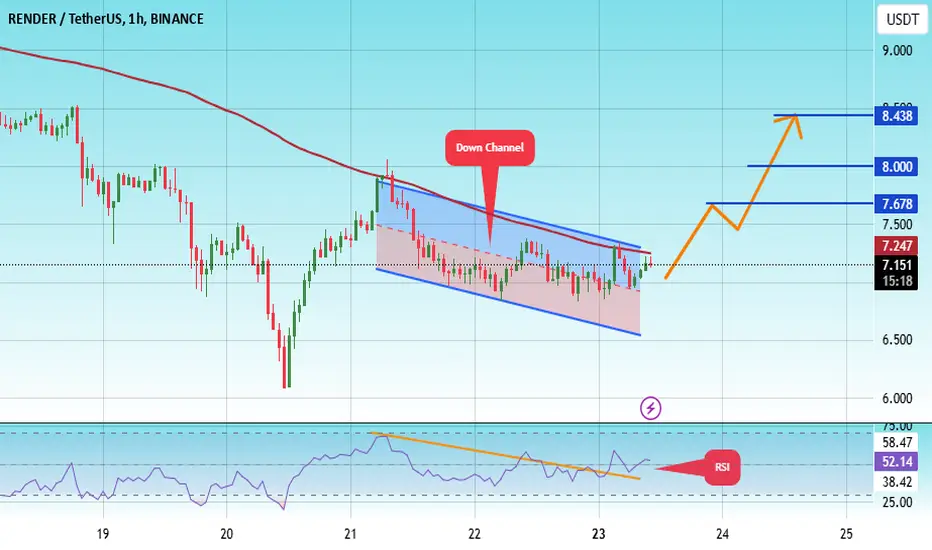
#RENDER/USDT Ready to go higher#RENDER
The price is moving in a descending channel on the 1-hour frame and sticking to it well
We have a bounce from the lower limit of the descending channel, this support is at 6.87
We have a downtrend on the RSI indicator that is about to be broken, which supports the rise
We have a trend to stabilize above the moving average 100
Entry price 7.15
First target 7.67
Second target 8.00
Third target 8.34