RNDR/USDT at a Critical Turning Point: Golden Pocket as the Key?✨ Overview:
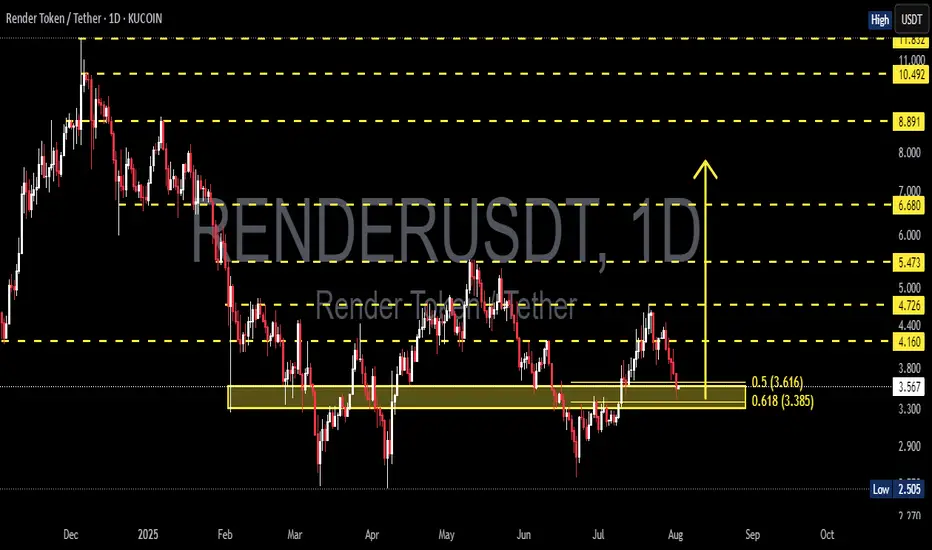
Render Token (RNDR) is currently testing a crucial support zone — the Golden Pocket Fibonacci Retracement between 0.5 (3.616) and 0.618 (3.385). This zone not only represents a significant retracement level but has historically acted as a strong demand area, often serving as a springboard for major price reversals.
---
🧠 Detailed Technical Analysis:
🔸 Support Zone & Golden Pocket
Price has retraced back to the 0.5 – 0.618 Fibonacci zone, a high-probability reversal area.
This zone has acted as a demand base multiple times since February 2025.
How the price reacts here will likely define the next major trend direction.
🔸 Market Structure
The overall structure shows a mid-term downtrend, marked by lower highs and lower lows.
However, the current price action shows slowing bearish momentum, indicating potential hidden accumulation.
A potential double bottom pattern could be forming, hinting at a bullish reversal if confirmed.
---
📈 Bullish Scenario:
1. Strong Rebound from the Golden Pocket
Watch for bullish candlestick patterns (e.g., pin bar, bullish engulfing) near $3.38–$3.61.
Initial resistance levels: $4.16 – $4.72
If broken, mid-term targets could extend to $5.47 – $6.68
2. Double Bottom Confirmation
A confirmed double bottom with a neckline breakout around $4.16 would greatly strengthen bullish momentum.
3. Increased Buying Volume
A spike in volume during the rebound would validate bullish sentiment and potential trend reversal.
---
📉 Bearish Scenario:
1. Breakdown Below the Golden Pocket
If the price breaks below $3.385 with strong volume, we could see a move down toward $2.77, the next significant support.
2. Weak Bounce / Lower High
A failed breakout above $4.16 may indicate a bearish continuation after a temporary relief rally.
---
📌 Summary:
RNDR is currently at a technically sensitive zone. The Golden Pocket between $3.38 and $3.61 is the key area to watch. A strong bullish reaction could signal the start of a trend reversal, while a breakdown could trigger further downside continuation. Traders are advised to wait for clear confirmation via price action before committing to any strong positions.
---
🔖 Key Levels to Watch:
Level Description
3.38 – 3.61 Golden Pocket (Potential Buy Zone)
4.16 Minor Resistance
4.72 Bullish Breakout Trigger
5.47 – 6.68 Mid-Term Reversal Targets
2.77 Strong Support if Breakdown Occurs
---
🧩 Chart Patterns Observed:
Potential Double Bottom – early bullish reversal signal.
Golden Pocket Reaction Setup
Descending Structure – still intact but weakening.
---
🔍 Trade Ideas:
🔄 Wait-and-see approach: Wait for clear bullish confirmation on daily candles.
🎯 Aggressive Long Entry: Around 3.40–3.60 with a tight stop-loss.
⚠️ Short Opportunity: If a strong breakdown below 3.38 occurs with volume confirmation.
#RNDR #RenderToken #RNDRUSDT #CryptoAnalysis #GoldenPocket #FibonacciRetracement #DoubleBottom #PriceAction #SupportResistance #AltcoinSetup #CryptoSignals #TechnicalAnalysis
Renderusdtidea
RENDERUSDT Breaks Major Downtrend – Will Bulls Sustain!🧠 Market Context & Structure:
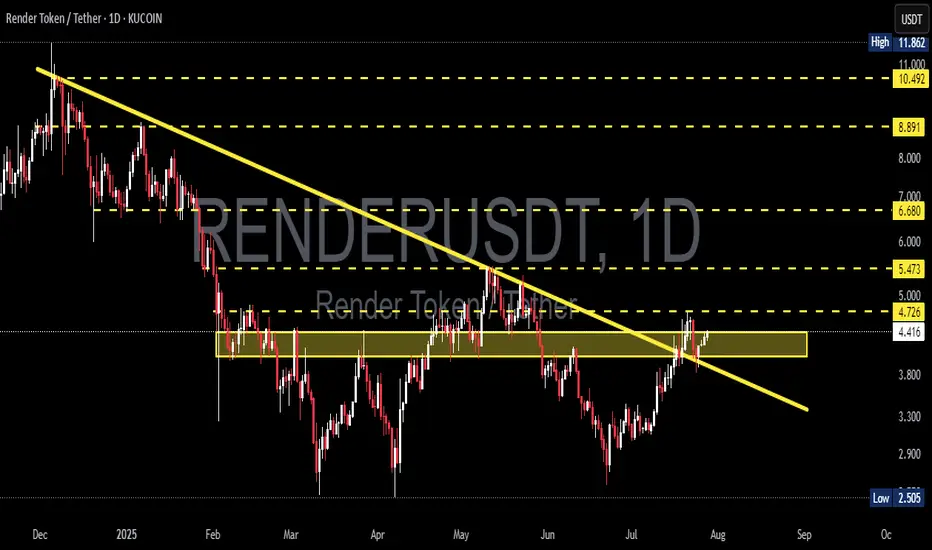
RENDERUSDT is currently presenting one of the most technically compelling setups in recent months. After enduring a prolonged downtrend since late 2024, price action has finally broken above the major descending trendline that has acted as dynamic resistance for over 7 months.
This breakout signals a potential shift in market control from sellers to buyers, marking a critical phase transition from bearish pressure to a possible bullish reversal.
---
📊 Key Technical Levels:
Descending Trendline (Breakout Confirmed): Clean breakout with bullish momentum—first signal of a structural shift.
Major Consolidation Zone (Supply Zone): $4.41 – $4.72
↪ Previously acted as strong resistance; now being tested as potential support reclaim.
Critical Support (Retest Area): $3.80 – $4.00
↪ If the breakout fails, this zone will be the next major defense for the bulls.
Upside Resistance Targets:
⚡ $5.47 – Minor horizontal resistance
🚀 $6.68 – Key resistance from prior swing highs
🧨 $8.89 and $10.49 – Mid-term bullish targets if trend continuation holds
---
🔍 Pattern Analysis:
Descending Trendline Breakout
A textbook reversal pattern, where a successful breakout above the long-term trendline signals a shift in momentum.
Supply Zone Reclaim
Price is now attempting to reclaim a previously rejected supply zone. If successful, it may indicate the beginning of a Wyckoff-style markup phase.
---
🟢 Bullish Scenario (Optimistic Outlook):
Price holds above $4.72, validating the breakout with strength and possibly retesting the area as new support.
A clear continuation may drive the price toward $5.47 and $6.68 in the short to medium term.
Rising volume and strong bullish candlesticks (e.g., marubozu or bullish engulfing) will further confirm momentum.
---
🔴 Bearish Scenario (Caution Required):
If price fails to hold above $4.41 – $4.72 and closes back below the breakout zone:
This would suggest a false breakout (bull trap).
Potential downside toward $4.00 or even $3.50.
Selling pressure could re-emerge, especially if broader market sentiment turns negative.
---
🧠 Market Psychology:
Traders are watching closely to see if this breakout is real or a trap.
This is a decision zone, where early profit-taking clashes with new momentum entries.
A strong close above $4.72 with increasing volume may invite more participation and confirmation of a trend reversal.
---
🧭 Conclusion:
RENDERUSDT is at a critical technical crossroads. The breakout from the long-standing descending trendline is a major bullish signal—but the real test lies in whether bulls can hold and flip resistance into support.
If successful, we could witness the early stages of a mid-term bullish trend, with potential targets reaching up to $10.49 in the coming weeks. However, caution is advised in case of a breakdown back below the key zone.
#RENDERUSDT #RenderToken #CryptoBreakout #TrendReversal #TechnicalAnalysis #BullishBreakout #DescendingTrendline #SupportResistance #CryptoCharts #WyckoffMethod #Altcoins
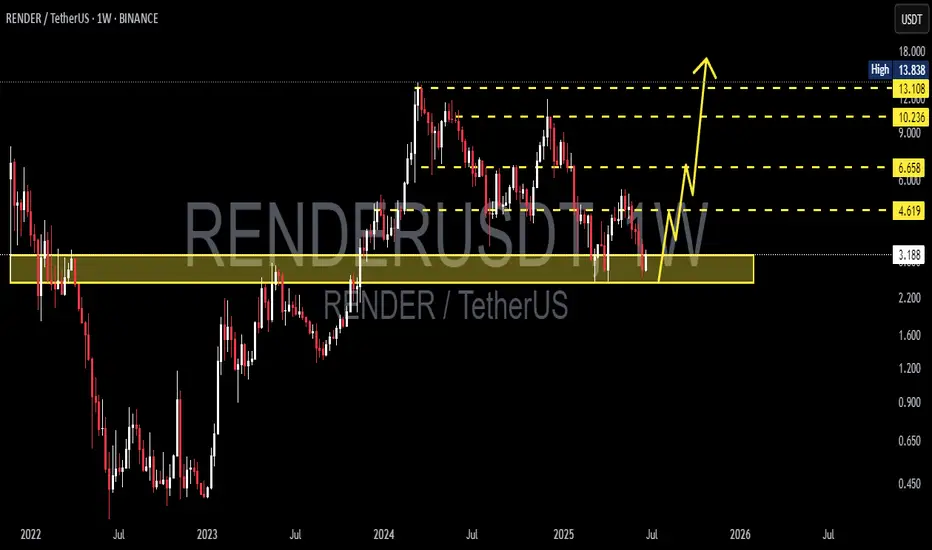
RENDERUSDT 1W AnalysisRENDER ~ 1W Analysis
#RENDER Buy gradually from here with a short term target of at least 20%++ from this support block.
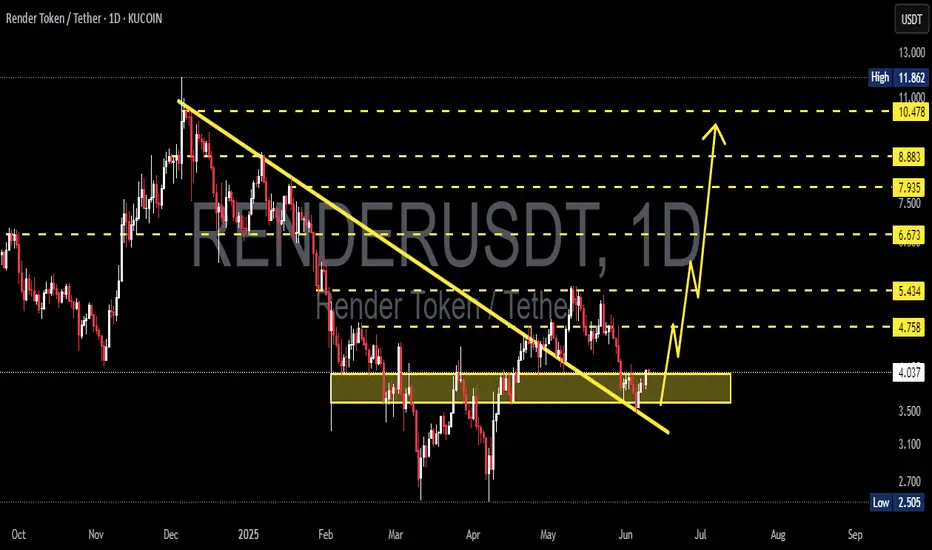
RENDERUSDT 1D AnalysisRENDER ~ 1D Analysis
#RENDER Buy back gradually from this support block with short term target of at least 15%+ , Long term target $11
RENDERUSDT likely to head towards 7 and beyondThis one looks very promising.
The price is trading between weekly resistance WR1 and weekly support WS1.
The price may hit WS1 again before making a bounce and aiming for WR1.
With resistance facing some pullback at WR1, it is likely to attempt that resistance again only to break it this time and continue its journey to further upward.
Very nice long opportunity from WS1 zone.
I am loading this one heavy on WS1 hit.
