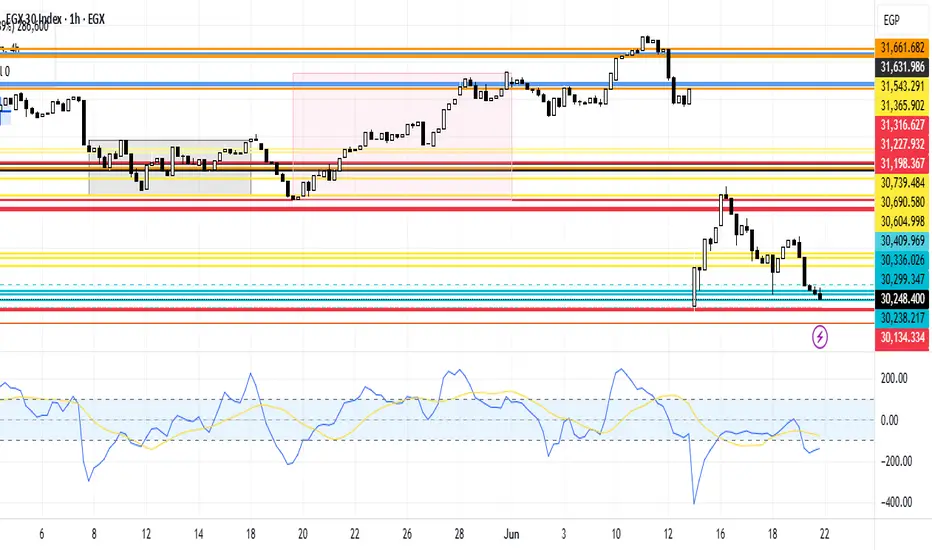
EGX30 in a Lower RegionEGX30 stock is currently in a decreasing region. It's expected to rebound as historically on the short term it didn't brak the support line 30,238.217. Accordingly, it's expected to rebound to reach the resistance line 30,604.998 to reach then 2nd at 30,690.58 then the third at 30,739.484
Resistanceline
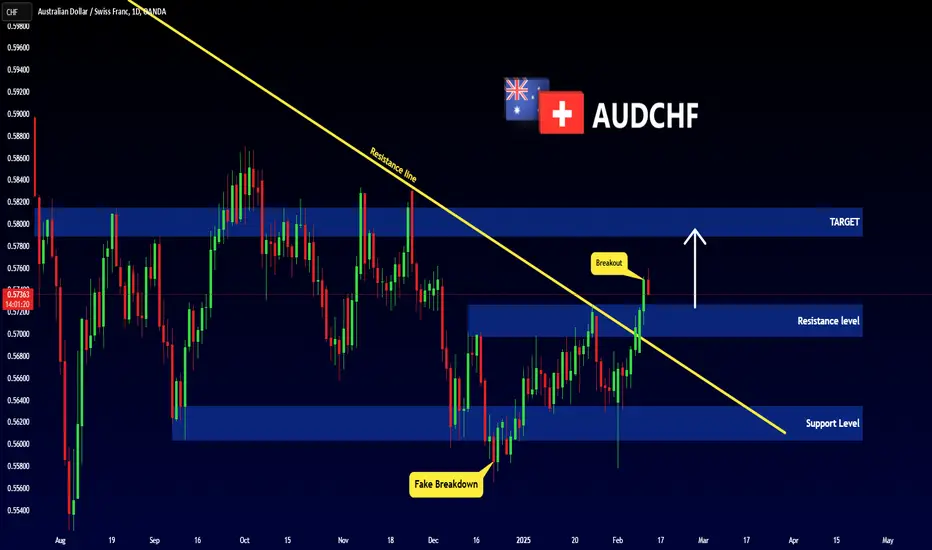
AUDCHF - NEW BREAKOUTHello Traders !
The AUDCHF failed to break the support level (0.56345 - 0.56038).
The price broke the resistance line !
So, I expect a bullish move🚀
_______________
TARGET: 0.57890🎯
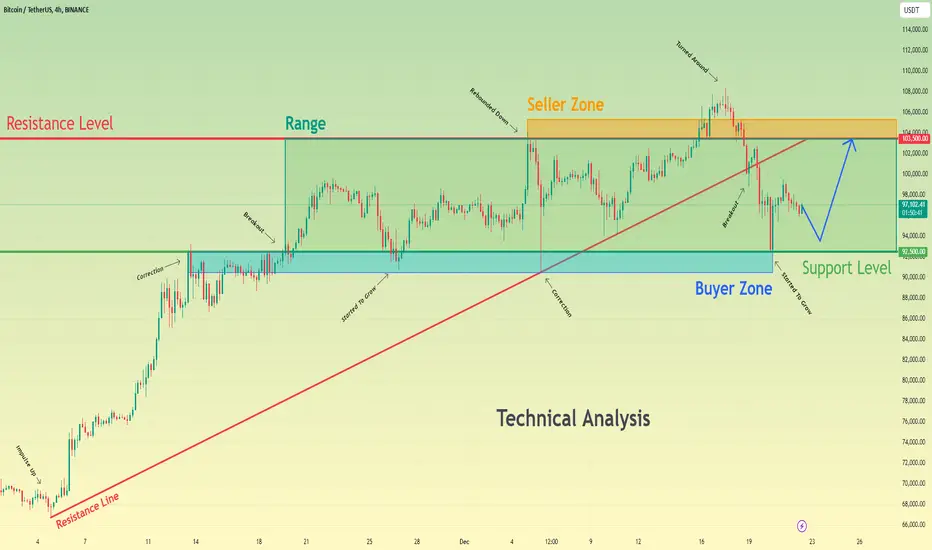
Bitcoin can little correct and then continue to grow in rangeHello traders, I want share with you my opinion about Bitcoin. By observing the chart, we can see that the price declined to the resistance line and rebounded at once and made impulse up. BTC rose to a support level, which coincided with the buyer zone, but firstly it made a small correction and some time traded below the 92500 level. Soon, the price broke this level, after which it started to trades inside the range, where it at once made a retest and tried to grow, but later corrected the support level. Next, the price continued to move up and reached the resistance level, which coincided with the seller zone, after which corrected the resistance line. After this movement, BTC at once rebounded and rose to the seller zone and even higher, breaking the 103500 level. But soon, the price turned around and dropped to the support level, breaking the resistance level with the resistance line. Then the price turned around and a not long time ago started to grow. For this reason, I think that Bitcoin make a small movement down to almost the support level and then continue to grow to the 103500 resistance level inside the range. That's why I set my TP at this level. Please share this idea with your friends and click Boost 🚀
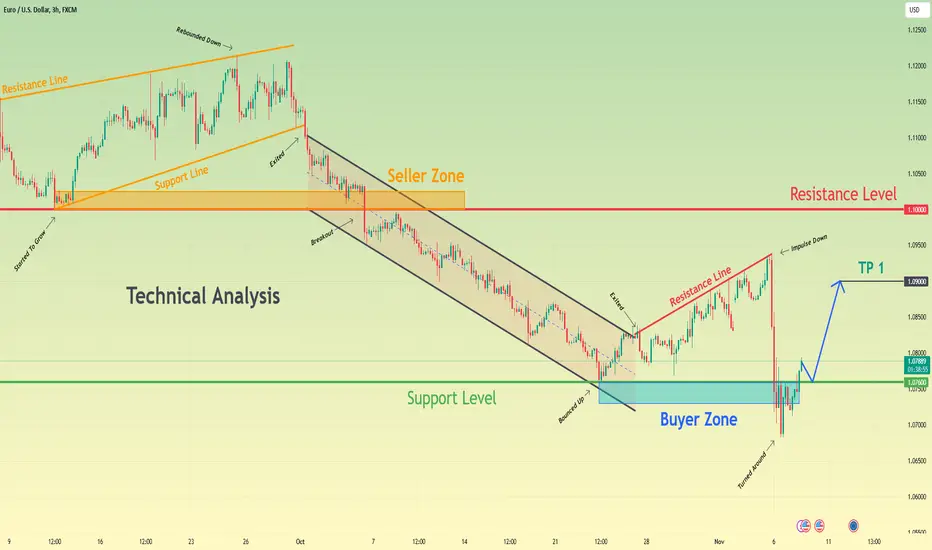
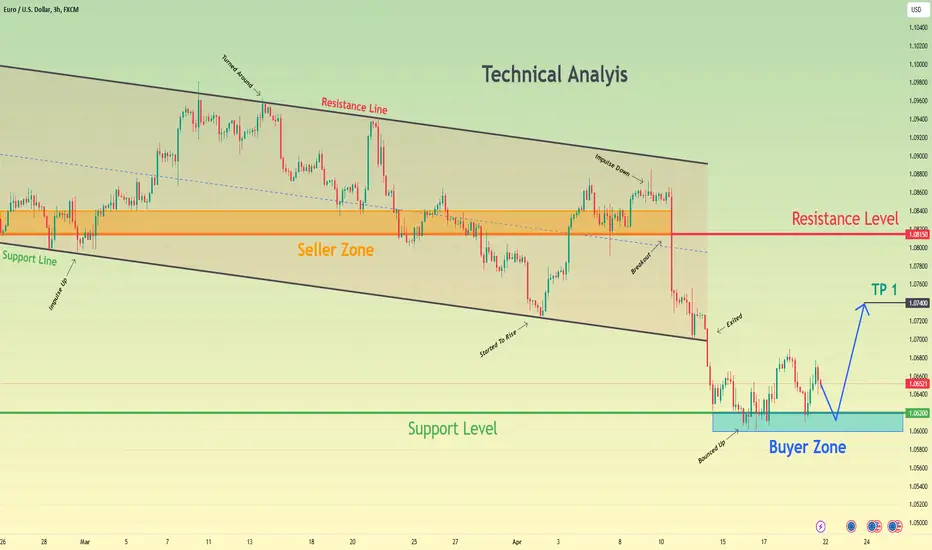
Euro can decline to support level and then continue to move upHello traders, I want share with you my opinion about Euro. By observing the chart, we can see that the price some time ago rebounded from the resistance line of the wedge and fell to the support line, which coincided with the resistance level and started to grow. In a short time, EUR rose to the resistance line and then started to decline, thereby exiting from the wedge. Price continued to decline inside the downward channel, where it broke the 1.1000 level, which coincided with the seller zone and reached the support line, but at once rebounded and made a retest. Then it continued to fall and later reached the 1.0760 support level, which coincided with the buyer zone, after which turned around and bounced to the resistance line. Euro exited from the channel and continued to grow near the resistance line. When the price reached 1.0825 points, it made a downward impulse, thereby breaking the 1.0760 level, but a not long time ago it turned around and rose back. At the moment, the Euro trades near the support level, and in my mind, the price can correct to the support level and then continue to move up. Therefore I set my TP at 1.0900 points. Please share this idea with your friends and click Boost 🚀
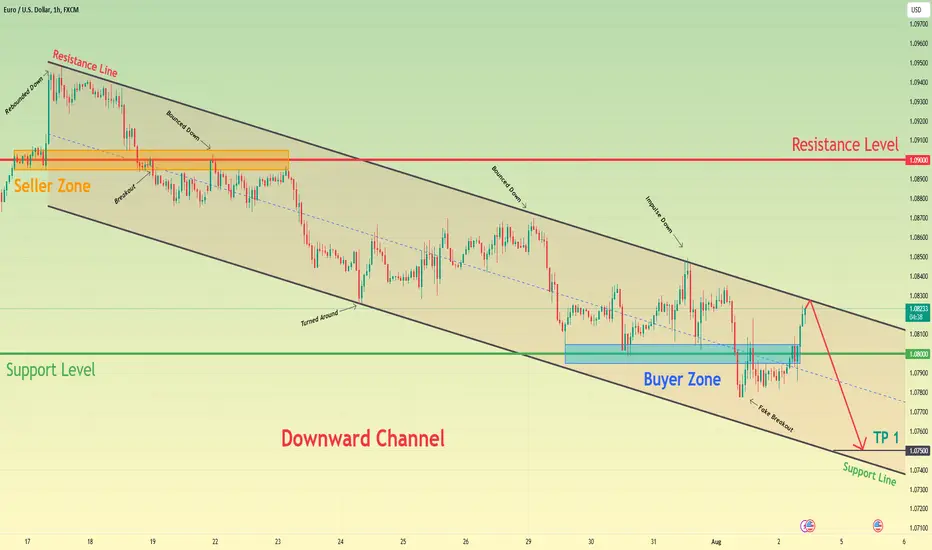
Euro can start to decline to almost support line of channelHello traders, I want share with you my opinion about Euro. Looking at the chart, we can see how the price some time ago reached the resistance level, which is located inside the seller zone, and soon broke this level. After this movement, the Euro a little rose, and then turned around, after which started to decline inside the downward channel. In the channel, the price soon broke the 1.0900 level and then some time traded near, after which bounced and dropped to the support line of the channel. After this, the Euro turned around from the support line and quickly rose almost to the resistance line of the channel, after which bounced and fell to the 1.0800 support level, which is located inside the buyer zone. Price some time traded near this level and then rebounded up to the resistance line of the channel again, after which turned around and made an impulse down, breaking the 1.0800 level. But soon, the EUR turned around and backed up to almost the resistance line of the downward channel, making a fake breakout of a support level. Now, I think that the price can rebound from the resistance line and start to decline to almost the support line of the downward channel, breaking the support level. For this reason, I set my TP at 1.0750 points, which coincided with the support line of the channel. Please share this idea with your friends and click Boost 🚀
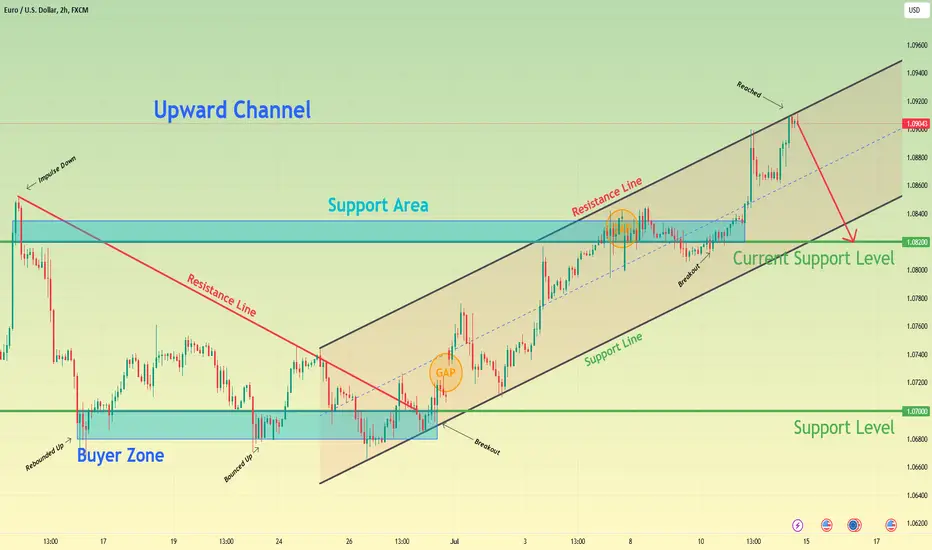
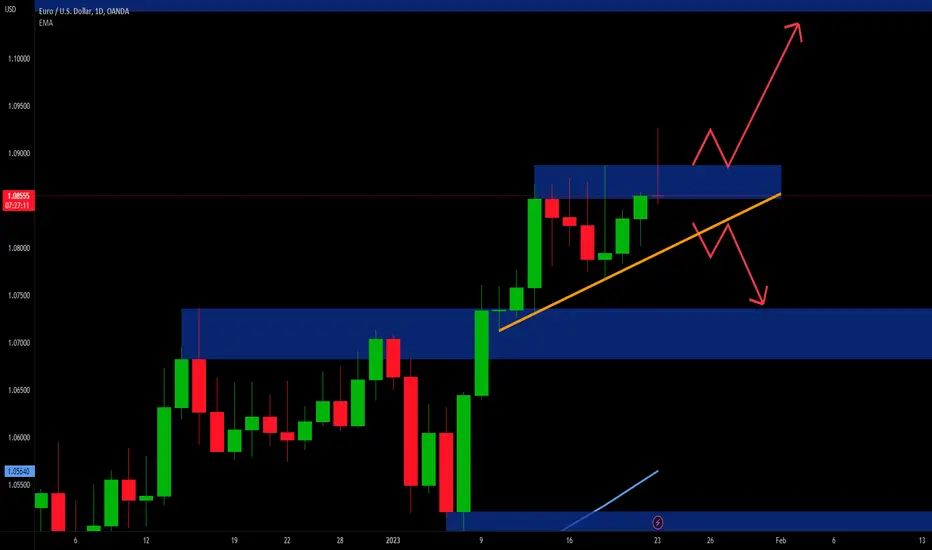
Euro can drop to support level, leaving upward channelHello traders, I want share with you my opinion about Euro. Looking at the chart, we can see how the price some days ago made impulse up to the resistance line, but soon turned around and dropped to the support level, which coincided with the buyer zone, breaking the 1.0820 level. After this movement, the price rebounded from the buyer zone and tried to grow, but soon turned around and fell back to the buyer zone. Then the price rose to the resistance line, but at once fell back, after which turned around and started to grow inside the upward channel, where it soon broke the resistance line with the 1.0700 level. In the channel, the price made two gaps and also later broke the 1.0820 level, which coincided with the support area. Price some time traded near this level and then rebounded up to the resistance line of the upward channel. At the moment, the Euro continues to trades near this line, so, in my opinion, the price can rebound from the resistance line of the channel and start to decline to the current support level, thereby exiting from the upward channel. For this reason, my TP is 1.0820 support level. Please share this idea with your friends and click Boost 🚀
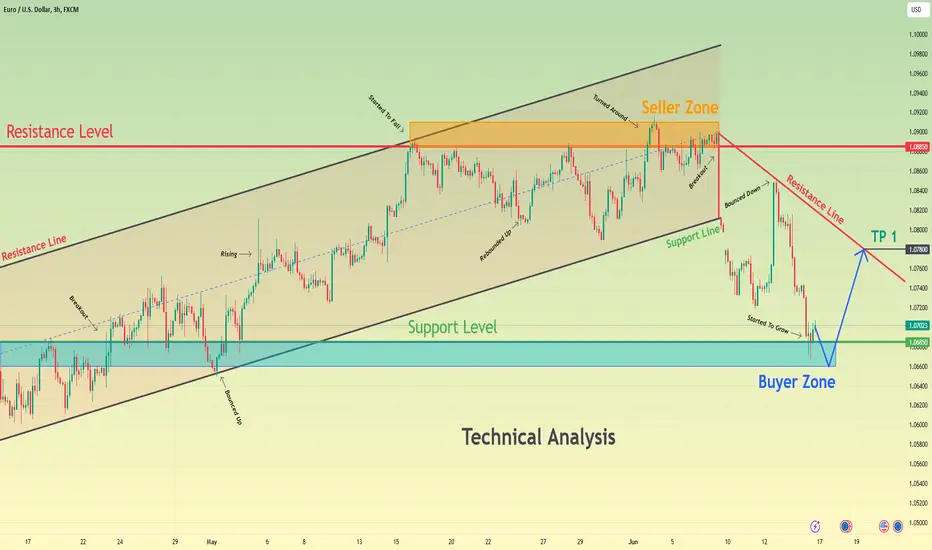
Euro can rebound up from buyer zone to resistance lineHello traders, I want share with you my opinion about Euro. Observing the chart, we can see that the price a not long time ago started to trades inside the upward channel, where it soon reached the support level, which coincided with the buyer zone and broke it. After this, the Euro made a correction to the support line of the channel and then rebounded up and continued to move up inside the channel. Later, the price reached a resistance level, which coincided with the seller zone, but at once turned around and fell a little lower. After this movement, the price reached the 1.0885 level again and then fell almost to the support line of the upward channel. Next, the Euro rebounded up and rose to the seller zone, but soon turned around and dropped to the 1.0685 level, thereby breaking the resistance level and exiting from the channel. Also, the price formed a gap, after which rose to the resistance line and then fell to the support level. Not a long time ago EUR started to grow, so, in my opinion, the price can fall to the buyer zone, and then rebound up to the resistance line. For this case, I set my TP at 1.0780 points, which coincided with this line. Please share this idea with your friends and click Boost 🚀
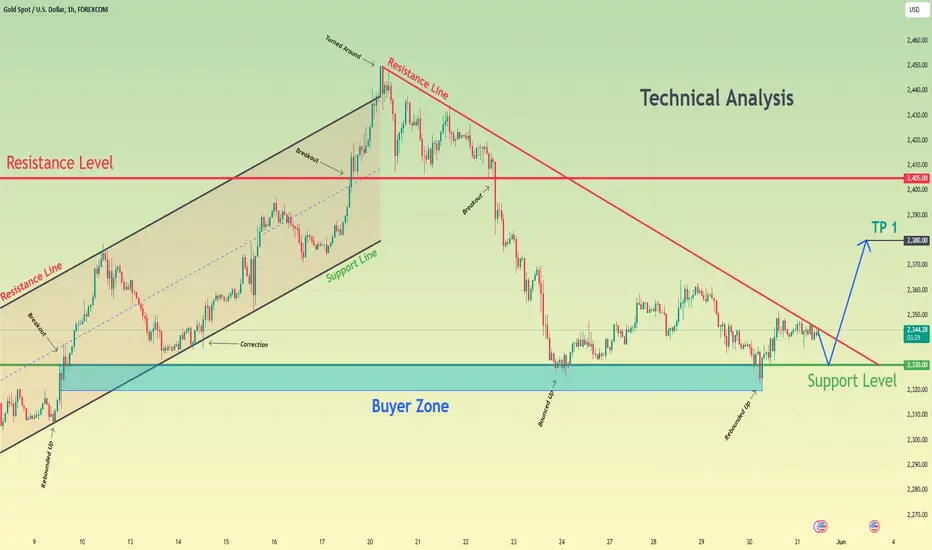
Gold can correct to support level and then rebound up to 2345Hello traders, I want share with you my opinion about Gold. Observing the chart, we can see that the price some days ago price started to trades inside an upward pennant, where it at once made a strong impulse up from the support line to the resistance line, which coincided with the seller zone, breaking 2285 and 2415 levels. Soon, the price turned around and in a short time declined to the support level, which coincided with the support area, after which started to grow to a resistance line. When the price reached this line, it two times tried to break it, and on the second try, Gold broke the resistance line, thereby exiting from the pennant and continuing to move up to the seller zone. After the price entered to seller zone, it soon turned around and in a short time declined lower the 2415 resistance level, making a fake breakout of it. After this, the price rose to the resistance line, after which rebounded down to the support level, but a not long time ago it bounced and started to grow. In my opinion, the price can correct to the support level, after which Gold turns around and rebounds up to the resistance line. For this case, I set my target at 2345 points, which coincided with this line. Please share this idea with your friends and click Boost 🚀

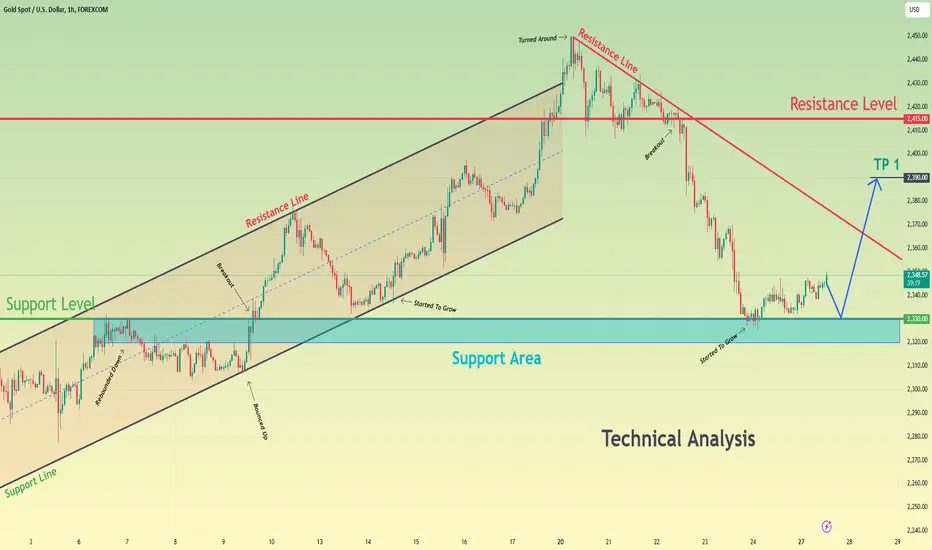
Gold can break resistance line and continue to move upHello traders, I want share with you my opinion about Gold. By observing the chart, we can see that the price a not long time ago started to grow inside the upward channel, where it soon broke the support level, which coincided with the buyer zone. After this, Gold made a retest and continued to grow in the channel and soon reached the resistance line, but at once rebounded and made a correction movement to support line of the channel. Then price rebounded from the support line and in a short time rose to the resistance level and also broke it and grew to the channel's resistance line. As well then, XAU exited from the channel and reached the resistance line, after which turned around and fell firstly to the 2405 resistance level, broke it again, and declined to the 2330 support level. After this, the price bounced from this level and tried to rise, but after some movement up, it rolled down to the buyer zone. A few moments ago, the price rebounded from this area and rose to the resistance line, which continues to trade near. In my opinion, the price can correct to the support level and then rebound up, higher than the resistance line, breaking it. For this case, I set my target at 2380 points. Please share this idea with your friends and click Boost 🚀
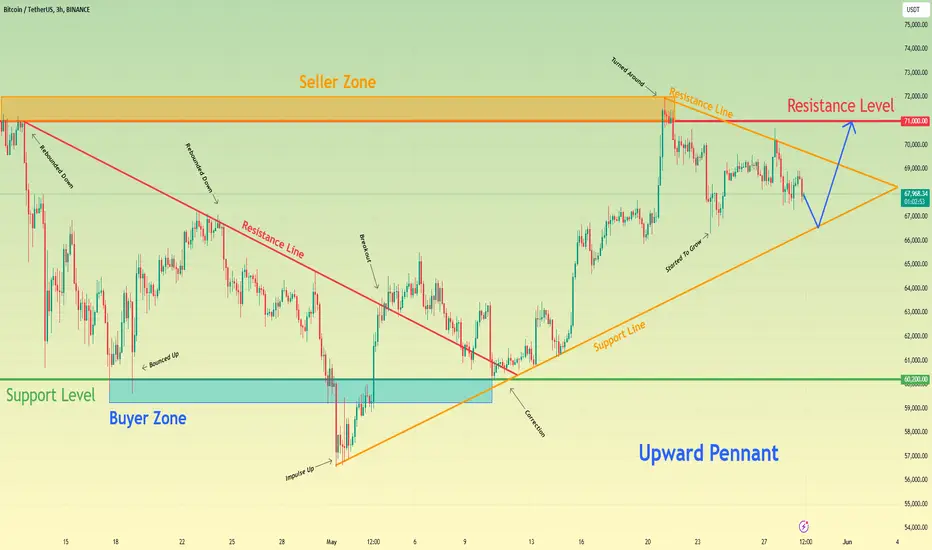
Bitcoin can rebound up from support line to 71000 level Hello traders, I want share with you my opinion about Bitcoin. By observing the chart, we can see that the price traded near the resistance level, which coincided with the seller zone and resistance line, after which rebounded down to the support level. When BTC fell to the 60200 level, it turned around and rose to the resistance line, but after the price reached this line, it rebounded and declined lower than the support level, which coincided with the buyer zone. But then the price entered an upward pennant and made an impulse from the support line, breaking the support level again and the resistance line. After this movement, BTC corrected move to support line of pennant, after which continued to grow. In a short time, Bitcoin reached a resistance level and even entered the seller zone, where it reached the resistance line of a pennant. But a not long time ago BTC turned around and declined lower than the 71000 level, breaking it again, after which in a short time rose to the resistance line of the pennant. Also, the price rebounded and started to decline, so, in my opinion, Bitcoin can decline to the support line and then rebound up to the resistance level, thereby exiting from the pennant pattern. Therefore I set my target at the 71000 resistance level. Please share this idea with your friends and click Boost 🚀
Gold can make little correction move and then continue to growHello traders, I want share with you my opinion about Gold. Observing the chart, we can see that the price started to trades inside the upward channel, where it soon reached the support level, which coincided with the support area, but at once rebounded down to the support line of the channel. After this price bounced up from this line, broke the 2330 support level, and reached the resistance line of the channel, after which turned around and made a correction to the support line. Then the price continued to move up in the channel until reached a resistance level, which broke it and even soon exited from the upward channel. But later Gold turned around and made a downward impulse from the resistance line to the 2330 support level, breaking the 2415 resistance level. A not long time ago price bounced from this level and started to grow, so, at the moment, I think that Gold can correct to the support level again and then rebound up, higher than the resistance line thereby breaking it. For this case, I set my target at 2390 points. Please share this idea with your friends and click Boost 🚀
Bitcoin can exit from pennant, turn around, and then start riseHello traders, I want share with you my opinion about Bitcoin. Looking at the chart, we can see how the price some days ago reached the 68800 level, which coincided with the seller zone and soon broke it, after which continued to move up. Later, the price rose to the resistance line and then at once made a downward impulse to the support line, which coincided with the support level and buyer zone, thereby breaking the 68800 level again. Then the price started to rise to the resistance level, and when BTC reached it, the price broke it one more time and rose to the resistance line, but then Bitcoin at once bounced down to the support line, breaking the resistance level. Next, the price rebounded from the support line and made an impulse up a higher resistance level with line, breaking them, after which BTC turned around and started to decline inside a downward pennant. Inside the pennant, the price broke the 68800 level, and soon the support line too, after which Bitcoin fell lower buyer zone to the support line of the pennant, breaking the 61500 level as well. But a not long time ago price turned around and made an impulse up to the resistance line, making a fake breakout of the 61500 level, after which BTC rebounded from this line and fell to the support line. Now, the price continues to trade near this line and I think Bitcoin can exit from the pennant and decline to the support level. After this movement, the price will turn around and start to grow, therefore I set my target at the 65800 level. Please share this idea with your friends and click Boost 🚀

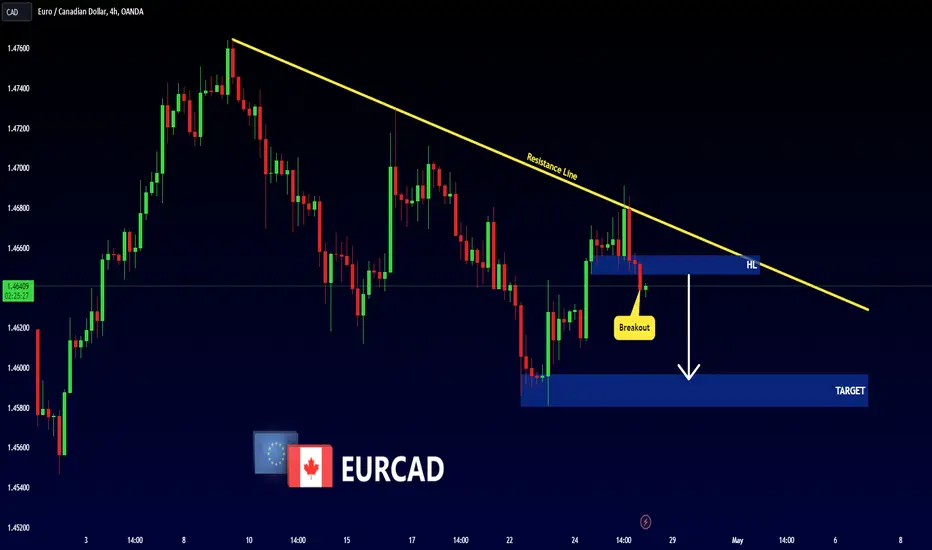
EURCAD - NEW BREAKOUT 📉Hello Traders !
On Thursday 25 April, The EURCAD Price Reached The Resistance Line and Failed To Break it !
The Last Higher Low is Broken (Change of Character).
So, I Expect a Bearish Move 📉.
-----------
TARGET: 1.45965🎯
Euro can decline to buyer zone again and then start to riseHello traders, I want share with you my opinion about Euro. By observing the chart, we can see that the price a not long time ago entered to downward channel, where firstly it broke the resistance level, which coincided with the seller zone and rose to the resistance line of the channel. Next, the price turned around and soon fell to the seller zone, but later price tried to back up and failed, after which in a short time Euro declined to support line of the downward channel, breaking the 1.0815 level. But then, the price started to rise and soon backed up to the seller zone, after which it some time traded near this area, and then made a strong downward impulse to support level, exiting from the channel and breaking the 1.08150 level one more time. Price started to trades near the 1.0620 support level, which coincided with the buyer zone and sometimes it even declined to this area, but a not long time ago EUR rebounded up. So, in my opinion, the Euro can decline to the buyer zone again, and then repeat movement up higher current location. For this case, my 1st TP is located at the 1.0740 points. Please share this idea with your friends and click Boost 🚀
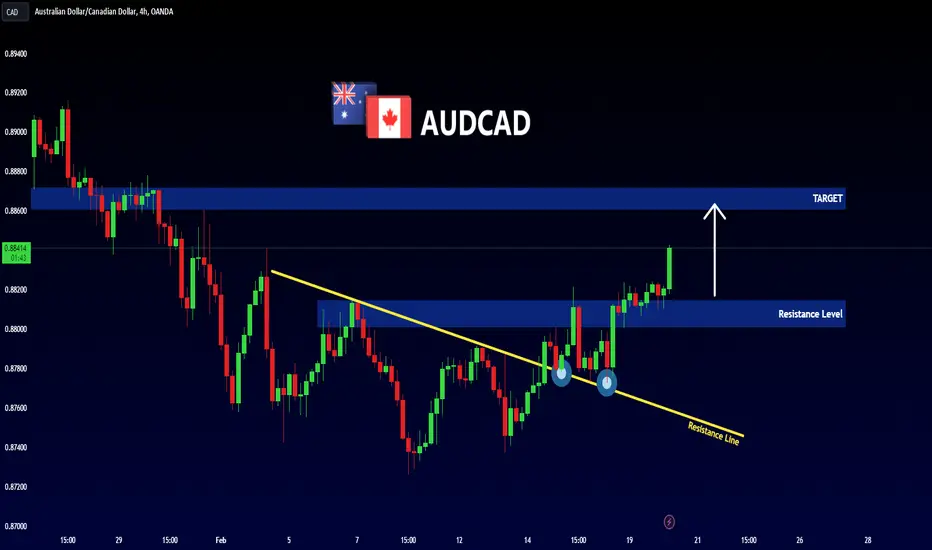
AUDCAD - Resistance Becomes Support 📈Hello Traders !
The AUDCAD Broke The Daily Resistance Level (0.88146 - 0.88014).
This Resistance Level Becomes a New Support Level.
The Resistance Line is Broken.
So, I Predict a Bullish Move 📈
------------
TARGET: 0.88610🎯
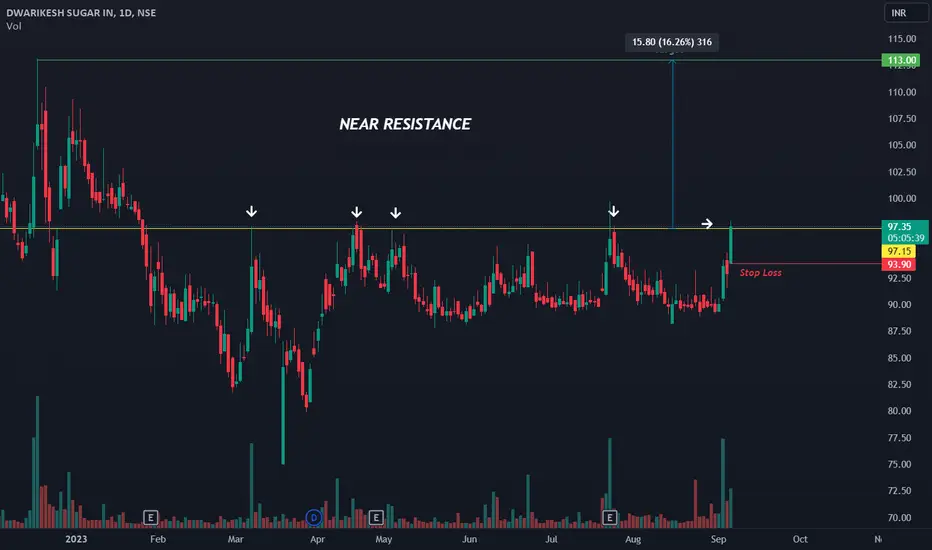
DWARKESH: RESISTANCE ZONESNSE:DWARKESH is near its Resistance zones. Position can be taken only after breakout and closing of candle above resistance. Stop Loss should be followed.
EURCHFEURCHF is in strong downtrend and struggling to recover against CHF. Currently EURCHF is in strong area of value which is acting as a resistance and it also facing resistance from bearish channel.
Will it continue to downside?

ACHUSD: Pullback To Form Potential Inverse Head and ShouldersACHUSD has some Bearish Divergence on th RSI at the list price and the 200SMA and looks like it could be setting up for a Pullback. If it pulls back we should look at the potential for it to form a Right Shoulder that could lead to a bullish breakout on a later date.

EURUSD - Waiting for a Breakout 📉📈hello guys!
we have 2 scenarios for EURUSD
Scenario 1
if the resistance line will broken, i will sell in pullback 📈
Scenario 2
the key level will broke and we will see a huge bullish move!
...
if you agreed with this IDEA, please leave a LIKE, FOLLOW or COMMENT!
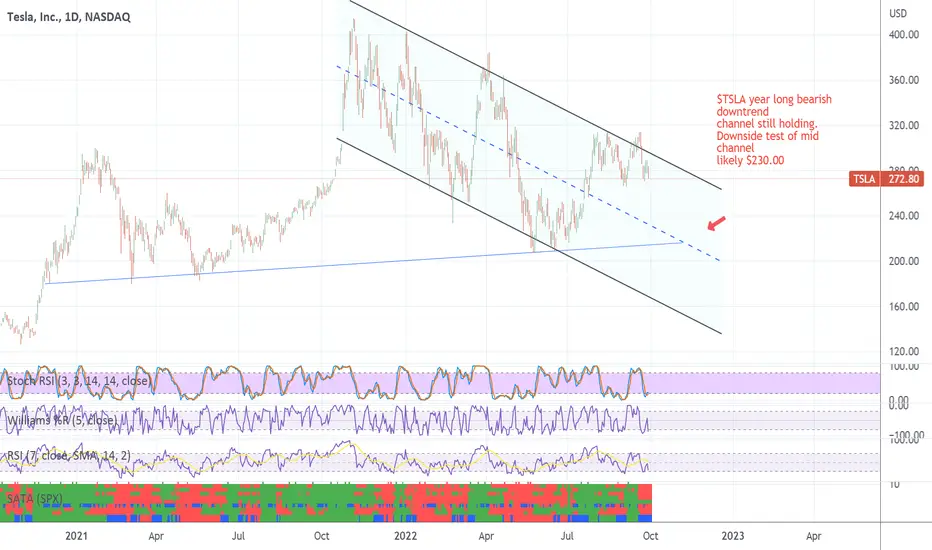
$TSLA bear downtrend channelDowntrend channel on $TSLA still holding.
Mid-channel test possible: $230.00
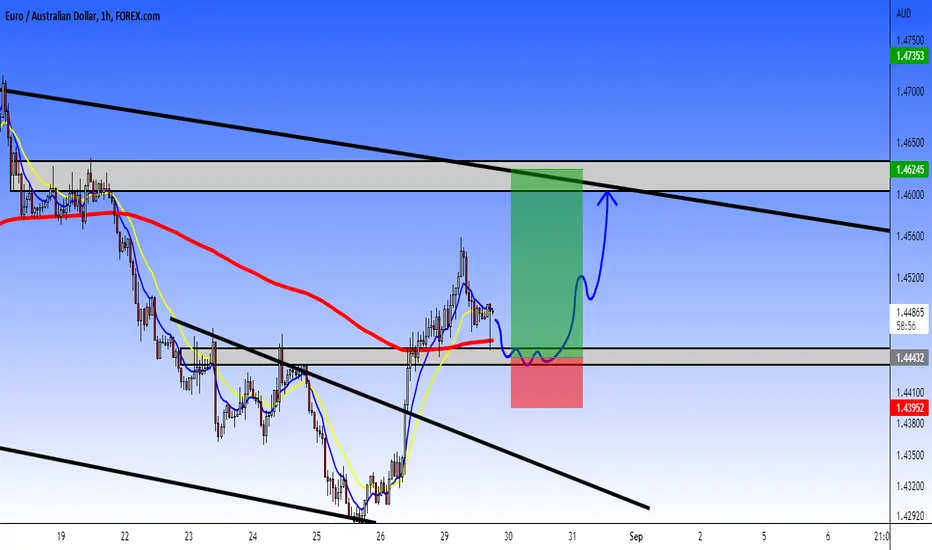
EUR/AUD: Buy Order Place in the smart zoneEuro/Australian Dollar look bullish as the same like Euro/Canadian Dollar. They've a lot correlation.
but technically, Euro its's look bullish in front of Aussie. What I will put a buy order place to $1.4444 AUD. Stop Loss to $1.4395 AUD. And take profit to $1.4623 AUD.
This it's an opportunity of 181 pips.
But now, it's very important to identify the smart point to put a buy order place and not now as we could to see the following movement in the blue arrow as example and model to watch in the next hours.
But we hope this trade that activate our target.
We see a bearish channel, but we're in the bullish side, but now, we can to use our resistance line and in other way we see the same situation that price want to react in it.
So guys, I hope that this idea support your technical analysis,
and beware, we're in the clearly bullish side, and not bearish as I thinking in the monring.
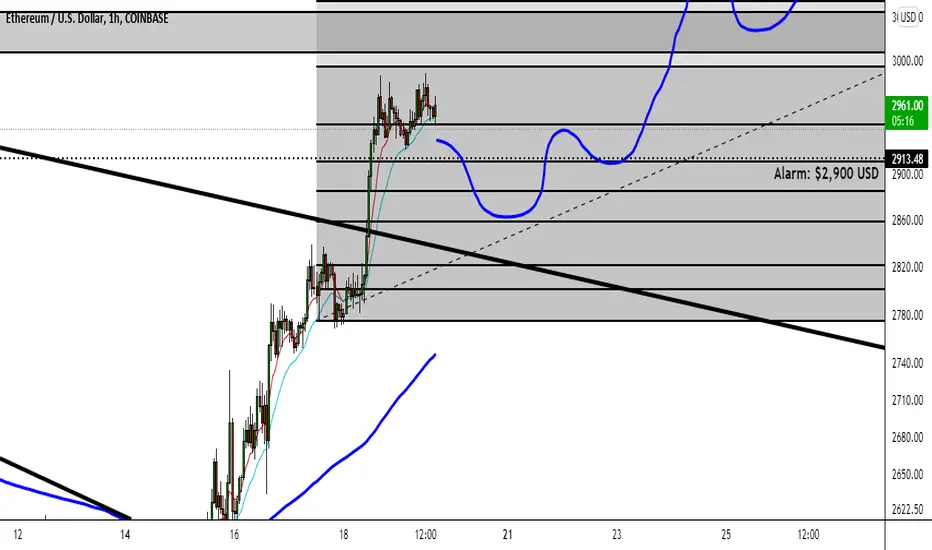
ETH/USD: Waiting for pull backEthereum it's another interesting position that I see. Maybe, we could to find up entries around 0.382% or 0.618% fibonacci key level. But to watch and hope for this long position. Also, I put an alarm on $2,900 USD to being informed if Ethereum cross this price and still pending if we forming any bullish candlestick formation in many hours more.
So guys, there're not any long position for now!!! We hope a pull back around $2,900 USD, and also in the 0.618% around $2,855 USD to entry in long in Ethereum with price action analysis and confirmed
We wait for next opportunity
And tomorrow, I will start analyzing Forex, my favorite global market that don't sleep 24 hours/7 days on the week to know the global economical trend in our financial world.
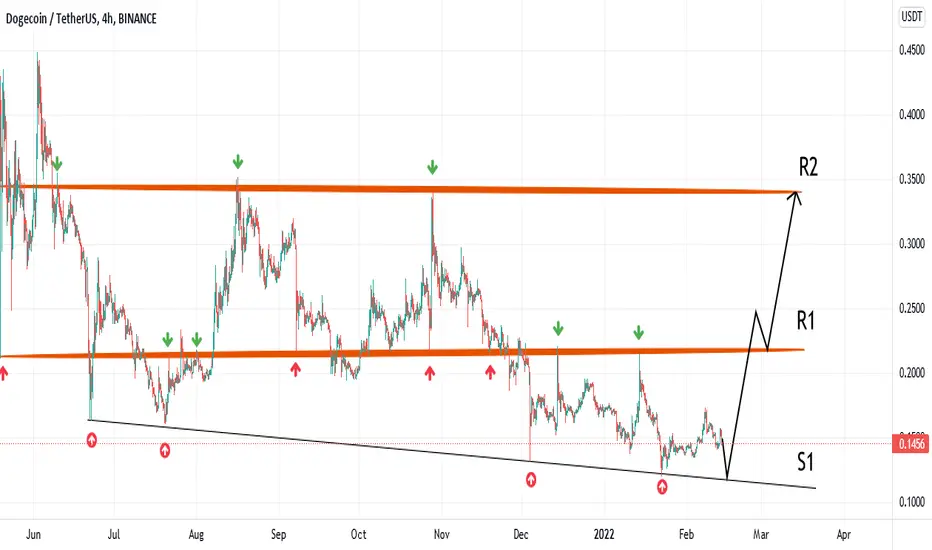
The most important doge support and resistance linesHello dear friends, let's take a closer look at the Doge chart in daily time frame.Since May 19, 2021, a strong S1 support line has been formed, which has been rejected upwards every time the price hits it.It is possible that the price will test the S1 level once again on the way to increase.The R1 line, which used to be a strong support in 2021, has now become a strong resistance.If a daily candle is closed above the R1 line and after completing the pull back to it, it is possible to increase the price up to the R2 line.In the event of a war between Ukraine and Russia and the loss of the S1 support line, there is a possibility of a sharp drop in prices.