#Finnifty Trading Important levelsOn 15 Min Timeframe, FINNIFTY trading important levels. Time to wait for either breakout or Breakdown (reversal) for the Finnifty.
Breakdown Move
- Confirmation for breakdown will be if Finnifty starts trading and sustain below 21450 level
- Downside rally nearly 300 points expected in case of breakdown
- Intermediate support expected near 21250- level
- Short Trader can place there stop loss if finnifty starts trading above 21550 level
Breakout move
- Long side movement expected in case banknifty starts trading and sustain above 21550 level
- Above this level finnifty can go upto the 21880+ level.
- Intermediate resistance expected near 21750 level
- Long trader can place there stop loss if finnifty starts trading below 21450 level.
Resistances

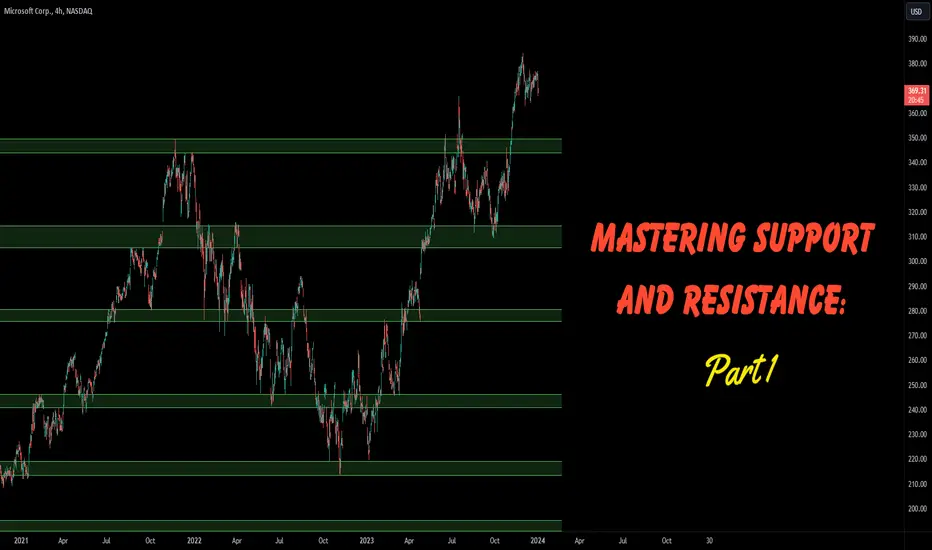
Mastering Support and Resistance: Part 1Hello Traders, and welcome to a new year of endless learning opportunities! Today, we will kick off 2024 by exploring the concept of support and resistance, how to identify these levels and common misconceptions about them. Support and resistance levels play a crucial role in technical analysis and can greatly impact your trading strategy. Understanding these levels and knowing how to effectively use them can make all the difference in your trading success. We will be doing a deeper dive in a subsequent article later this week where we will cover more advanced techniques and the psychology behind support and resistance. In the meantime, are you ready to dive in?
Understanding Support and Resistance Levels in Trading
Support and resistance levels are key aspects of technical analysis that traders incorporate into several different trading decisions. Support refers to a price level where buying pressure is expected to be strong enough to prevent the price from falling further. On the other hand, resistance is a price level where selling pressure is expected to be strong enough to prevent the price from rising higher. These levels are based on the idea that markets often go through similar patterns and respond to certain prices.
The Importance of Support and Resistance in Technical Analysis
Support and resistance levels are crucial in technical analysis for several reasons. Firstly, they provide traders with valuable information about market sentiment. When the price approaches a support level, it indicates that buyers are likely to step in and try to push the price up. Conversely, when the price approaches a resistance level, it suggests that sellers are likely to enter the market to push the price down. Understanding market sentiment can help traders avoid potential losses.
Secondly, support and resistance levels act as a reference point for setting profit targets and stop-loss levels. By analyzing historical price movements, traders can identify key support and resistance levels that are likely to be tested in the future. These levels can be used to determine when to take profits or cut losses, providing a clear framework for risk management.
Lastly, support and resistance levels can act as confirmation tools for trading signals. For example, if a trader receives a buy signal from a set of technical indicators and the price is approaching or bouncing off of a strong support level, it adds credibility to the signal.
Similarly, if a sell signal is generated and the price is approaching or moving away from a major resistance level, it strengthens the validity of the signal. By combining support and resistance levels with other technical indicators, traders can increase the accuracy of their trading signals.
Identifying Support and Resistance Levels on Price Charts
Identifying support and resistance levels on price charts is a fundamental skill for any trader. Several methods can be used to identify these levels, depending on the trader's preference and trading style. Here are a few common techniques:
Swing Highs and Lows: Horizontal support and resistance levels can be identified by analyzing price charts. A support level is typically formed by connecting multiple swing lows, where the price has previously bounced back up. Conversely, a resistance level is formed by connecting multiple swing highs, where the price has previously reversed its upward trajectory. By identifying these levels, traders can anticipate potential reversals or breakouts and adjust their trading strategy accordingly.
It is important to note that support and resistance levels are not exact price points, but rather zones where buying or selling pressure is expected to be strong. Traders should use a combination of these techniques and exercise discretion to identify the most relevant support and resistance levels on their price charts.
Moving Averages: Moving averages are commonly used to identify trends in price charts, but they can also act as dynamic support and resistance levels. For example, a 200-day moving average is often considered a strong support or resistance level. When the price approaches this moving average, it is likely to either bounce off or breakthrough, depending on the prevailing trend.
Fibonacci Levels: Fibonacci levels are based on mathematical sequences. These levels are used to identify potential support and resistance levels based on the percentage retracement of a previous price move. Traders often look for confluence between Fibonacci levels and other technical indicators to increase the reliability of their analysis. Several different tools on TradingView can be used to identify these levels such as a Fibonacci retracement or Fibonacci Channel.
How to Effectively Use Support and Resistance in Your Trading Strategy
Once you have identified support and resistance levels on your price charts, it is important to know how to effectively use them in your trading strategy. Here are some key considerations:
Combine with other indicators: Support and resistance levels should not be used in isolation but should be combined with other technical analysis techniques. Relying solely on support and resistance levels can result in false signals, as price can break through or reverse at unexpected times. Consider using trend lines, candlestick patterns, or oscillators to confirm your support and resistance levels and increase the accuracy of your trading signals.
Price Action: Observing price action around support and resistance levels can provide valuable insights into market sentiment. Look for signs of price rejection, such as long wicks or multiple failed attempts to break through a level. Price patterns may also form around support or resistance levels. These signs can indicate potential reversals or breakouts.
Risk Management: Support and resistance levels can be used to determine stop-loss levels and profit targets. When entering a trade, set your stop-loss just below a support level for long positions or just above a resistance level for short positions. Similarly, set your profit target at the next significant support or resistance level to ensure a favorable risk-reward ratio.
Multiple Timeframes: Analyzing support and resistance levels across multiple timeframes can provide a broader perspective on market dynamics. A level that appears strong on a daily chart may be insignificant on a weekly or monthly chart. Consider higher timeframe levels for long-term trades and lower timeframe levels for short-term trades.
Common Misconceptions About Support and Resistance
There are several common misconceptions about support and resistance levels that traders should be aware of. Understanding these misconceptions can help you avoid common pitfalls and make better trading decisions. Here are three common misconceptions:
Support and Resistance Levels Are Fixed: One of the most common misconceptions is that support and resistance levels are fixed and remain unchanged over time. In reality, these levels are dynamic and can shift as market conditions change. Traders should regularly reevaluate and adjust their support and resistance levels based on new price information.
Support Turns into Resistance and Vice Versa: Another misconception is that support levels always turn into resistance levels when broken, and vice versa. While this can sometimes be the case, it is not always true. Market dynamics can change, and a support level that has been broken may become irrelevant in the future. Traders should not blindly assume that a broken support level will act as a strong resistance level.
Support and Resistance Levels Are Foolproof: Many traders mistakenly believe that support and resistance levels are infallible and always result in predictable price movements. While these levels can provide valuable guidance, they are not guaranteed to hold or reverse the price. Traders should always use support and resistance levels in conjunction with other technical analysis tools and exercise proper risk management.
By understanding these misconceptions, traders can avoid relying solely on support and resistance levels and develop a more comprehensive trading strategy. We implore you to be thorough in practice and understanding of S&R as there is a great degree of subjectivity to them. The more you understand about these levels the greater accuracy you can obtain.
Tips for Mastering Support and Resistance
Mastering support and resistance requires practice and experience. Here are some tips to help you improve your skills in identifying and utilizing these levels:
Backtesting: Backtesting is a valuable tool for evaluating the effectiveness of support and resistance levels in historical price data. By analyzing past price movements, you can assess how well your identified levels have held or reversed the price. This can provide valuable insights into the reliability of your levels and help you refine your approach.
Focus on Key Levels: Not all support and resistance levels are equally significant. Focus on key levels that have been tested multiple times and have resulted in strong price reactions. These levels are more likely to hold or reverse the price and can provide more reliable trading opportunities.
Practice Patience: Support and resistance levels often require patience to be effective. Wait for clear confirmation before entering a trade, and avoid chasing price or making impulsive decisions based on a single level. Patience and discipline are key to successful trading.
By incorporating these tips into your trading routine, you can enhance your mastery of support and resistance levels and improve your trading performance.
What Does it All Add Up To?
In conclusion, understanding and mastering support and resistance levels is crucial for successful trading. These levels provide valuable information about market sentiment, act as reference points for setting profit targets and stop-loss levels, and can confirm trading signals. By identifying support and resistance levels on price charts using techniques like swing highs and lows, moving averages, and Fibonacci levels, traders can make better judgments in deciding what actions to take. However, it is important to use support and resistance levels in conjunction with other indicators and consider price action for confirmation. Overall, integrating support and resistance levels into a trading strategy can help break through barriers and achieve trading success.
DXY's Recent Shifts: Insights and ObservationsD ear Esteemed TradingView Community,
I'm sharing my recent analytical insights into the movements of the Dollar Index (DXY). Please note that the following reflections are not financial advice but rather a comprehensive analysis based on my observations.
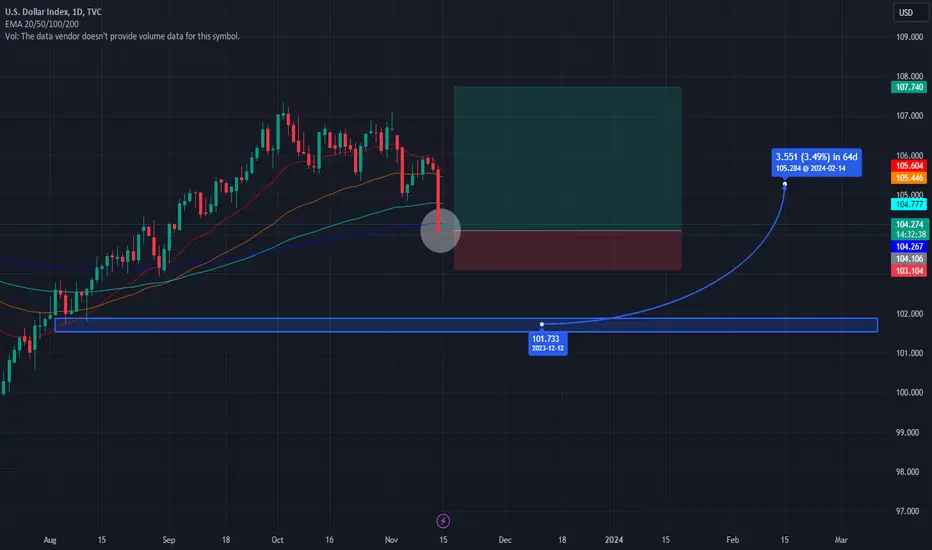
This week, DXY experienced a notable descent, and my analysis, driven by AI natural language processing, suggests a correlation with global news developments. Strikingly, the influence of news events appears to have a more significant impact on price action than technical indicators. As DXY found its way down, it eventually landed in a support zone. While this decline signals a bearish sentiment, it's crucial to recognize that the current position also places DXY in a support zone. Historical data indicates that predictions originating from support zones tend to favor upward price trends. Although some indicators still hint at a potential bearish outcome, extending downwards to the underlying support zone around $101 (as indicated by the blue rectangle), this zone might also act as a reversal point. Notably, the current support level aligns with the Exponential Moving Average (EMA) of 200, adding a layer of significance to its potential impact.
In this scenario, careful observation becomes paramount. One can monitor whether the price breaks below EMA 200, potentially signaling a short position with a target at the underlying support zone. Conversely, a long idea could play out if the observed support level, coinciding with EMA 200, acts as a shield, propelling DXY upward. It's essential to exercise caution when contemplating short positions from the current level, given its classification as a support zone. The risk-reward ratio may not favor such a strategy at this juncture. Adding a layer of complexity to the analysis is DXY's correlation with the stock market. The potential for DXY to follow a bearish trajectory could be heightened by a flourishing stock market. Conversely, a bounce in DXY might indicate a retracement in the context of a thriving stock market.
In conclusion, the intricacies of DXY's current position warrant careful consideration. The interplay between support zones, technical indicators, and global events introduces a degree of uncertainty. As we navigate these waters, it's crucial to remain vigilant and adaptable in our approach to market analysis.
With regard and an understanding heart,
Ely
AI-Driven Analysis: TSLA's Possible Outlook and Tactical EntriesDear Esteemed Members of the TradingView Community,
I n our continuous pursuit of precision, we've harnessed the analytical power of cutting-edge AI technology, utilizing a harmonious blend of Autoregressive Integrated Moving Average (ARIMA) and Seasonal Decomposition of Time Series (STL) methodologies to decode the market trends from June 26, 2023, to November 4, 2023.
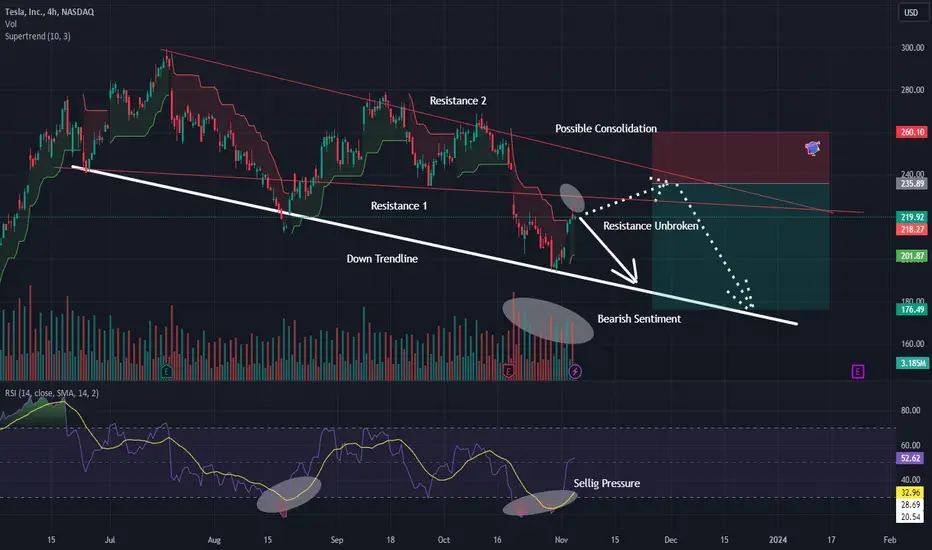
O ur AI indicates a prevailing bearish sentiment in this time frame, which traditionally corresponds to a sequence of lower lows. The chart exhibits a prominent white trendline, gracefully outlining the descending support trajectory of this bearish trend and pinpointing potential regions for the emergence of new lower lows. Should this trendline remain intact, a target price range for short positions spans from $175 to $195.
F or those contemplating entry into a short position, we suggest closely monitoring the nearest resistance levels. In bearish trends, historical support levels often transition into formidable resistance points. To map these potential hurdles, the AI has nimbly employed the K-Nearest Neighbors (K-NN) algorithm, highlighting two key resistance zones: "Resistance 1" and "Resistance 2." Resistance 1, marked by the vibrant red line, stands as the immediate barricade, while Resistance 2, also vividly red, awaits in the wings should Resistance 1 be breached. These insights have inspired us to craft two scenarios for your strategic consideration.
I n Scenario 1, we envisage Resistance 1 rejecting the price action, ushering in a descent towards the coveted target price zone. In Scenario 2, an alternate narrative unfolds, where the bulls surge past Resistance 1, eventually carving out a consolidation phase between the two resistance lines. Ultimately, this tactical hiatus is followed by an ebbing of market enthusiasm, permitting the anticipated descent into the target zone.
A perceptive examination of the volume reveals an uptick in selling pressure on TSLA, commencing on October 17, 2023. The red volume candles in the white circle signify an influx of market sell transactions, surpassing the norm. This pattern aligns with a prevailing bearish sentiment, setting the stage for a potential decline in keeping with our bearish expectations.
W hile on the indicators, the Relative Strength Index (RSI) appears. It's a tool often wielded together with others by seasoned traders. Although we've already discussed various indicators, it's worth casting an eye over the RSI. The RSI is signaling a persistent selling inclination in the market, displaying no discernible signs of waning. When considered in conjunction with the volume data and AI-derived insights, it further bolsters the case for impending bearish continuations.
tl;dr version:
T o sum up, here's a snapshot of the elements of our analysis:
Position: Short
Trend: Bearish
Entry: Near Resistance 1 or Resistance 2 (depicted in red)
Target Price Zone: $175-$195
Stop Loss: Positioned above the noted resistances
Indicators: ARIMA, STL, K-NN, Volume Candle Analytics, Trendline Analytics, RSI
H owever, please be mindful that this analysis is not an investment advice. Past performance is not indicative of future results. The trading parameters should be in line with your unique risk tolerance. It's crucial to undertake your individual research and remember to implement a range of safeguards, such as Stop Loss, Trail Profit, Target Price, Trade Timeout, and Liquidity Check. The ever-fluctuating market can often spring surprises, venturing into scenarios that may differ significantly from those outlined in this analysis.
Warm regards,
Ely
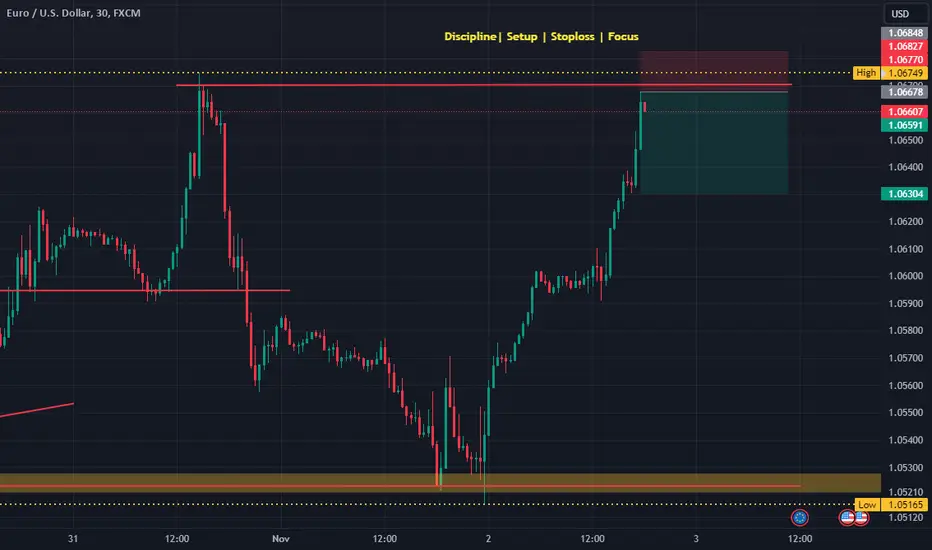
EUR-USDEUR-USD currently traded at 1.06650 near at resistance level seen as double top. Market range at price then down to 1.06350.
Mid Channel Resistance stopped Positive looking NiftyMid channel resistance acted on positive looking Nifty and levels above 19230 could not sustain. Closing below Mid channel resistance is not a good sign. If Nifty had closed above 19230 we would have seen a sharp rise. Now we are looking at an important support level of 19033. If Nifty can give a closing above 19033 tomorrow it will be considered a positive signal again. If Nifty is not able to sustain above 19033 then again the recent low of 18837 will be tested. If 18837 is not held in the coming week we may see a dip again upto 18489 levels. (Looks little unlikely but you can never be sure with the global tensions going on). Resistances on the upper side will be 19124 and 19230. Above 19230 the next resistance will be near 19492.

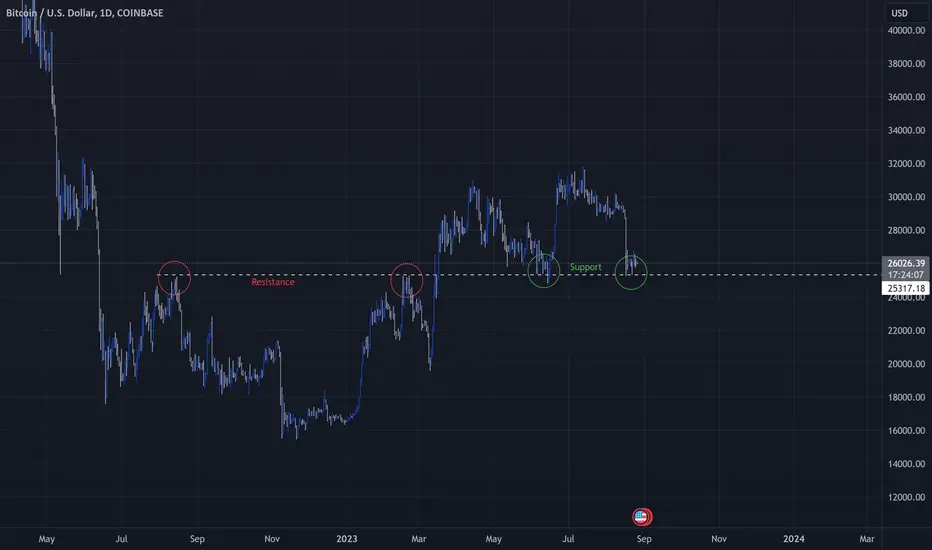
Bitcoin S&RSupport & Resistance :
- When the two prices meet, consolidation between support and resistance.
- Called support and resistance reversal happens.
- A key concept of technical analysis is that when a resistance or support level is broken, its role is reversed.
- If the price falls below a support level, that level will become resistance. If the price rises above a resistance level, it will often become support.
- So you got the idea, trading is magic.
- Always keep in mind all scenarios.
- Sometimes just watch and don't gamble!
Happy Tr4Ding !
BTC Short-Term Review 1HHello everyone, let's take a look at the BTC to USDT chart taking into account the one hour interval. As you can see, the price is moving above the local uptrend line.
After unfolding the FIb Retracement grid, we see that the price remains just above the support zone from $28,735 to $28,607, and then we have the second zone from $28,403 to $28,256.
Looking the other way, we see a strong resistance zone from $28,885 to $29,106, only when we go above it can we see an increase to the resistance level of $29,743.
Looking at the CHOP indicator, we see that the energy has been used, while the RSI indicator and the STOCH indicator show a movement at the upper limit of the range, which resulted in a slowdown in growth and may result in a price recovery.

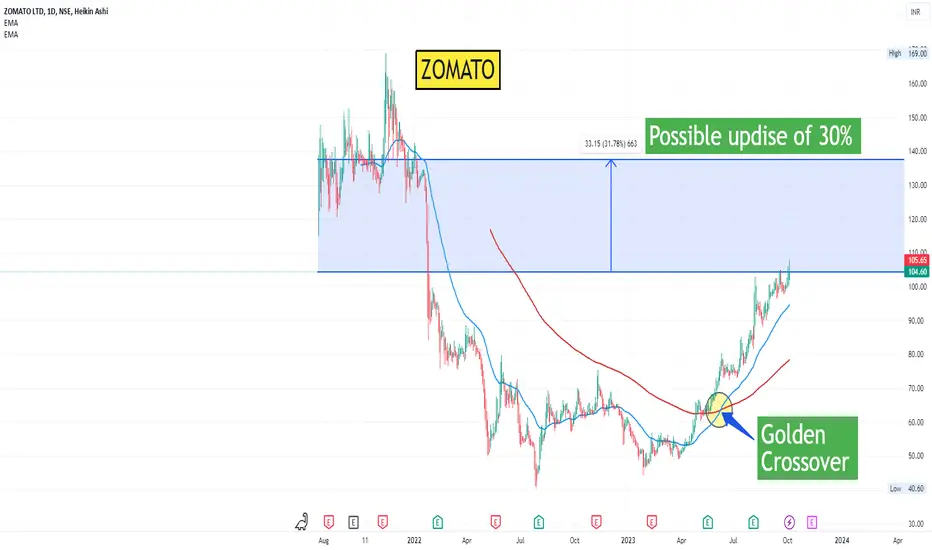
ZOMATO - Golden Cross Possible upside of 30%NSE:ZOMATO
After a year of downtrend, Golden crossover has formed indicating possible long upside for 3 to 6 months.
Highly possible that if the market give good rally then the share would break previous high (Rs. 168).
Note: Trade with caution! Do not trade solely based on my strategies, these are just individual ideas, kindly consult your investment advisor before taking trades.
Gap and go!!- Plan for 11th October 2023Nifty future and banknifty future analysis and intraday plan in kannada.
This video is for information/education purpose only. you are 100% responsible for any actions you take by reading/viewing this post.
please consult your financial advisor before taking any action.
----Vinaykumar hiremath, CMT

Retesting Previous High, Potential Shorting OpportunityWe've identified a potential opportunity for counter-trend traders in the form of a Bearish Fib-3 Bat Pattern completion on the Weekly Chart. This could be a great chance for traders to engage in the trade and make a profit.
However, we understand that the initial stop may be too large for some traders to handle. That's why we suggest waiting for the setup to form on the lower time-frame, such as the 1-hourly chart, for a shorting opportunity. You could wait for a retest at 149.44 for a shorting opportunity. The initial Stop-Loss at 149.74 (-30pips) or approx. -300usd/lot.
Target1 could be at 148.76 (+68pips) or approx. +680usd/lot. But keep in mind that it's always important to plan your trade and not follow any trader blindly. We encourage you to have a solid plan in place before making any trades.

📈 AUDJPY: Watch This Textbook Bullish Flag Breakout!Full-time trader. Follow for more free tips & like/ share this idea. Thanks in advance!
Bullish flags typically typically show some profit-taking after a strong uptrend without any violent selloffs. The pole needs to have an impulsive and violent move upwards. The breakout from the flag should be followed by a volume spike. This is exactly what we have on the FX:AUDJPY
Watch how this plays out in the next few weeks. Learn from it, then do it again on another pair.
Possible max target at 101. Of course, like with any currency or stock, expect bumps and dips along the way. Look for higher lows which would void the bullish flag.
First resistance break (see chart) should cause an impulsive move upwards, as many traders will spot the pattern and FOMO into it.
The lower timeframe shows a nice trend forming. This strong trend can help break resistance faster than expected:
If you don't have experience trading this pattern, it's better to sit this one out and watch it unfold and take notes.
If you trade stocks, you'll love our community. Link below!

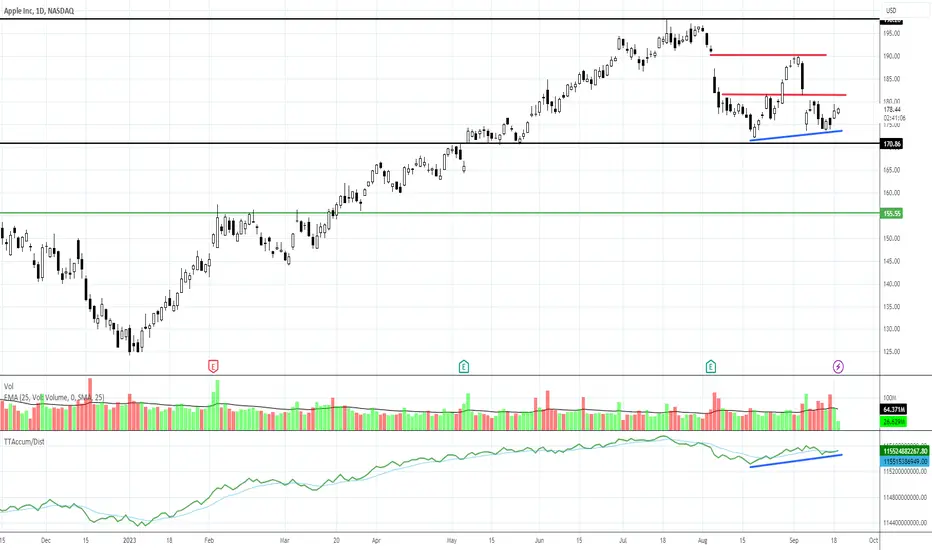
$AAPL: Top or Not?Is this a top or just a sideways correction to pattern out excessive price gains that are above current fundamentals?
This is the big question when studying stocks right now.
NASDAQ:AAPL is definitely not a sideways trend right at the moment, but is it a downside run after a top? What is missing? There are 2 lower highs BUT just ONE lower low.
To confirm a Top, you need the second lower low. AAPL doesn't have 2 lower lows at this time. The recent low is slightly higher than the previous first low.
So selling short has high risk for AAPL at this time. Resistance for swing trades is at the red lines, which are the highs of each minor gap down.
GBP/USD Analysis - A Patient Approach to TradingWhen it comes to trading GBP/USD, a well-thought-out strategy can make all the difference. In this analysis, we'll discuss a potential trade setup that involves retesting a support line and aiming for a resistance line. Remember, patience is key in trading, and risk management is crucial for long-term success.
Support Retest:
The first step in our analysis is identifying a retester support line. Currently, we are looking for a pullback that could potentially retest the support line at 1.24900. This retracement is a crucial phase in our trade setup.
Entry Points:
Once we observe the price reaching the support line at 1.24900, we can start looking for entry points. Timing is essential here. Keep a close eye on the price action, and consider using technical indicators or patterns to confirm the entry. Be cautious not to rush into the trade; wait for a clear confirmation signal.
Take Profit Levels:
For our trade, we have two take profit (TP) levels:
TP1: 1.25430
TP2: 1.25760
These levels are where we anticipate the price may encounter resistance. It's crucial to have multiple TP levels in your strategy to secure profits along the way.
Stop Loss:
To manage risk, we should always have a stop-loss (SL) in place. For this trade setup, we recommend setting the SL at 1.24730. This level should protect your capital if the trade goes against you.
Risk Management:
Remember that money management is the cornerstone of successful trading. In this analysis, we recommend risking no more than 1% of your trading capital on this trade. This conservative approach helps preserve your account in case of unfavorable market movements.
In summary, trading GBP/USD requires patience and a well-defined strategy. By waiting for the support retest at 1.24900 and carefully selecting entry points, along with setting appropriate take profit and stop-loss levels, you can increase your chances of a successful trade. Remember to stick to your risk management plan to protect your capital and maintain a disciplined approach to trading.

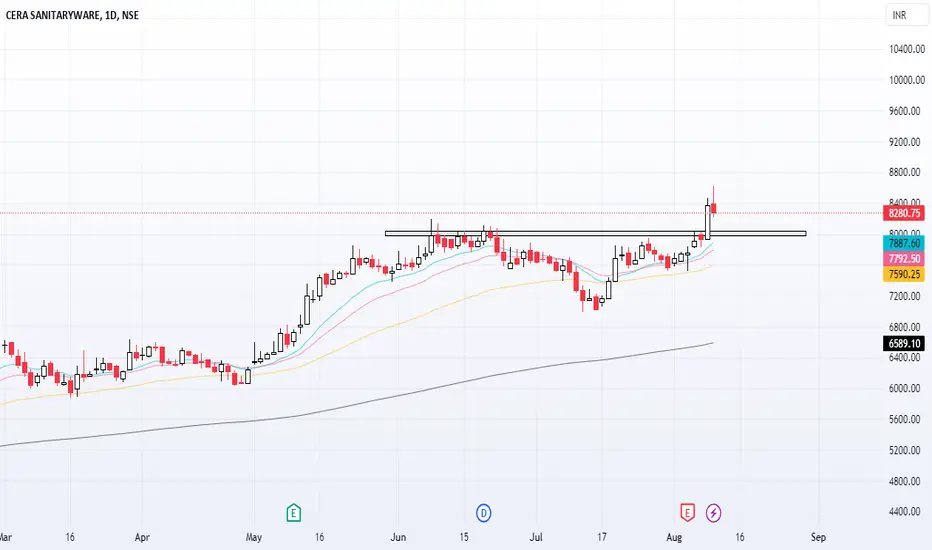
Cera looks good hereCera has given good breakout at ATH levels.
Can add with SL below breakout area.
Safe can add at retest
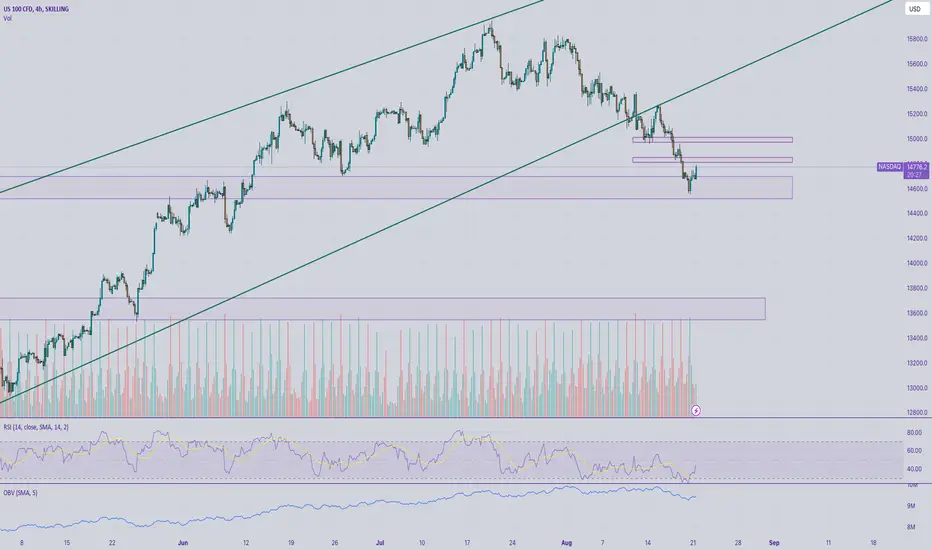
NASDAQ continues the reaction from last FridaySKILLING:NASDAQ has started the week with a nice continuation from last Friday. However, we have two important resistances ahead of us. One is 14840 which is the weekly pivot point. The price should first establish a base above it. Then, we can see an attack to the stronger resistance around 15000, which was the point that we saw a big break-down. Clearing these resistance would make the trend bullish again.
Disclaimer – WhaleGambit. Please be reminded – you alone are responsible for your trading – both gains and losses. There is a very high degree of risk involved in trading. The technical analysis , like all indicators, strategies, columns, articles and other features accessible on/though this site is for informational purposes only and should not be construed as investment advice by you. Your use of the technical analysis , as would also your use of all mentioned indicators, strategies, columns, articles and all other features, is entirely at your own risk and it is your sole responsibility to evaluate the accuracy, completeness and usefulness (including suitability) of the information. You should assess the risk of any trade with your financial adviser and make your own independent decision(s) regarding any tradable products which may be the subject matter of the technical analysis or any of the said indicators, strategies, columns, articles and all other features.
Review and Trading plan for 16th AugustNifty future and banknifty future analysis and intraday plan in kannada.
This video is for information/education purpose only. you are 100% responsible for any actions you take by reading/viewing this post.
please consult your financial advisor before taking any action.
----Vinaykumar hiremath, CMT


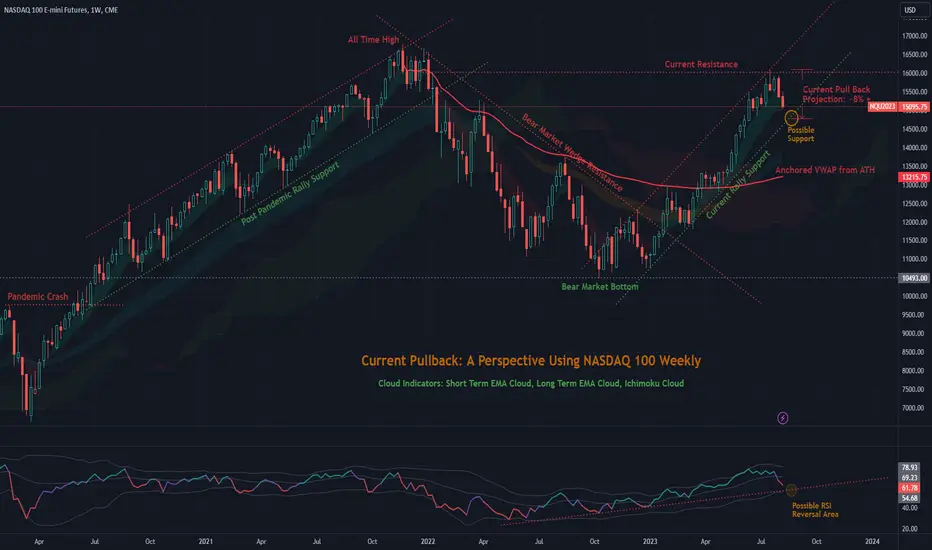
Current Pull-Back: A Perspective Using NASDAQ 100 WeeklyCME_MINI:NQ1! has had the sharpest pullback in last couple of weeks. The Semiconductor Industry NASDAQ:SOXX has been the largest driver in this selloffs. In this Trend Analysis, I tried to draw a perspective as to how deep this pullback could be given Support and Resistance areas that stood the test of time in recent years. I used Weekly chart to gain a broader perspective of where the index will end up in coming months.
It is easy to establish that the TOP of the Current Rally (~16,100), i.e., the Resistance has been determined by the Start of the Recent Bear Market in 2022. Which technically started with the collapse of the Post Pandemic Rally in early January, 2022. This is the most important Control Level that the current market needs to break for a further rally in the future.
The Bear Market in 2022 was strictly bound by the Wedge Resistance as we can see. The same phenomenon can also be shown by simply drawing an Anchored VWAP from the All Time High. Throughout the course of the Bear Trend CME_MINI:NQ1! could not break above the AVWAP. After the market established a bottom between October and December of 2022, it finally broke above the Wedge in the last week of January, 2023. We can call this the beginning of the current Bull Market. NASDAQ eventually broke the AVWAP in the last week of March 2023 to further confirm the Bull Trend. The AVWAP has worked as a Support Level since then until the market boosted up in May.
Now coming back to the Current Pull-back, It is not hard to identify that there is a possible Support Area at the bottom of the range (~14,775) which the Current Bull Trend has established. If this Support Level is held then the projected size of the pullback from the top will be approximately 8.0 %. Current price action has confirmed a breach of the Short Term EMA cloud in the Weekly chart. In the Daily chart it came down below the 50 day Moving Average which indicates Short Term bearish tendency. If CME_MINI:NQ1! doesn't take support at the Range Bottom, then we could think of the Long Term EMA cloud as secondary Support Area. The next Support Area could be the AVWAP from ATH. For now, there is no reason to believe that there will be a lingering pull-back in the market going forward to start another Bear Market. Our best "hope" is that the market will take support and continue the Bull Trend in coming months.
Please note that historically, in Pre-election years, August and September had been the most bearish months. This write-up is solely based on Technical and Trend Analysis to figure out the best case scenario.
Thanks for Reading!
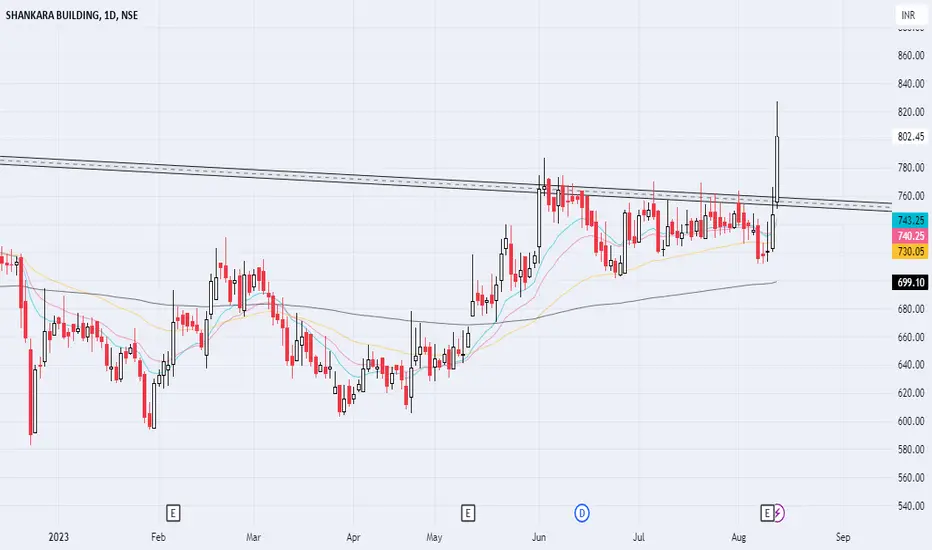
Shankara BreakoutShankara has done strong breakout.
Best buy price will be around 770.
Add to watchlist.

Prakash pipe looks goodPPL Has given very strong breakout.
Now waiting for a retest entry.
Keep on watchlist.
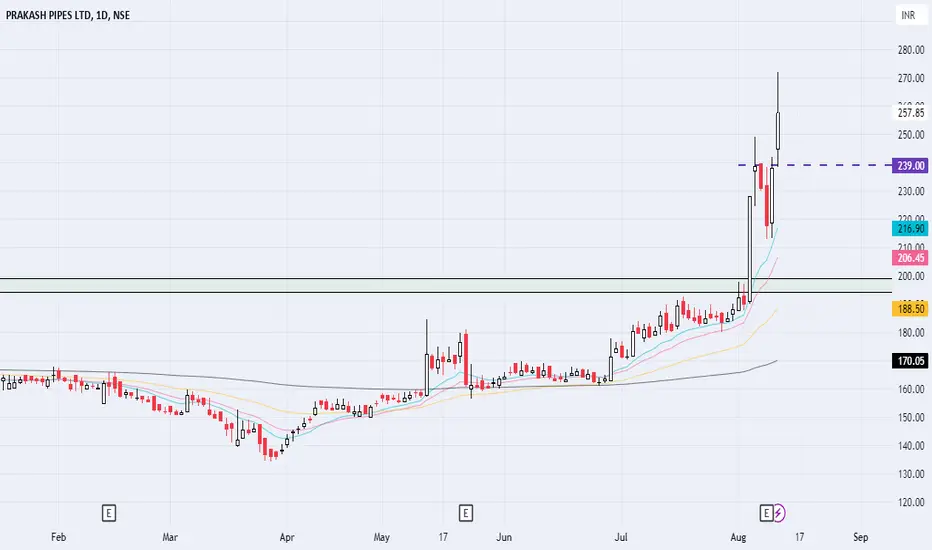
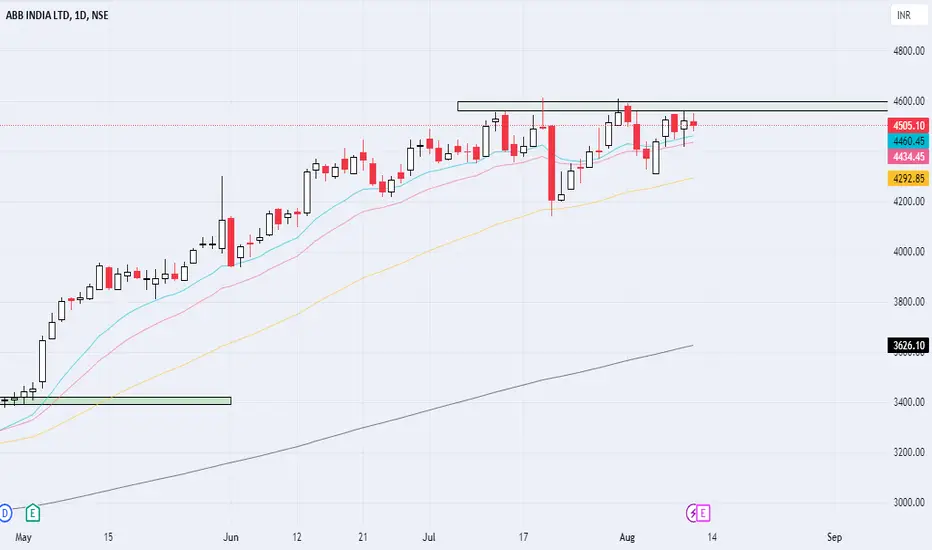
ABB Getting ready for next legABB After previous trade again getting ready for next leg if it breakouts.
Keep on watchlist.