Fuel for a EUR/USD move down/ euro retail sales down MomThe EUR/USD pair has broken down below a steep trendline. This morning, the euro area's retail sales were down .5 percent MoM. I believe this is going to fuel a move down on the pair and we can continue to see the pair trend down as the dollar strengthens and the euro area's economy slows a bit. I think we can see levels all they way down to 1.14 over the first half of the next quarter.
Retailsales
GBP/CAD 1H Chart: Channel DownGBP/CAD 1H Chart: Channel Down
The British Pound is losing value against the Canadian Dollar in a two day long descending channel.
The pattern was shaped by a reaction on release of information on the UK CPI and Average Earnings Index.
At the moment, the currency pair struggles to pass through the support level set up by the weekly S3 at 1.6268.
Generally, the rate is expected make a rebound and surge to the top for some short period of time.
Firstly, because in the end of the previous trading session the pair made a second fully-fledged rebound from the bottom trend-line of the channel.
Secondly, because a number of technical indicators point out that the currency rate is oversold.
However, there is a need to take into account that release of data on the UK Retail Sales at 8:30 GMT, depending on the result, will either help the Pound to reach the pattern’s upper boundary for the third time, or it will accelerate the fall towards the monthly S1 at 1.6187.

Ahead of FOMCComing down from the last week's NFP, today's retail sales, CPI, and ahead of FOMC.
Making lower lows and below the neckline of a potential double bottom on daily chart.
Let's see if the support area holds after today's meeting. A hike is fully priced in and movement would be dependent on the speech delivered during the meeting.

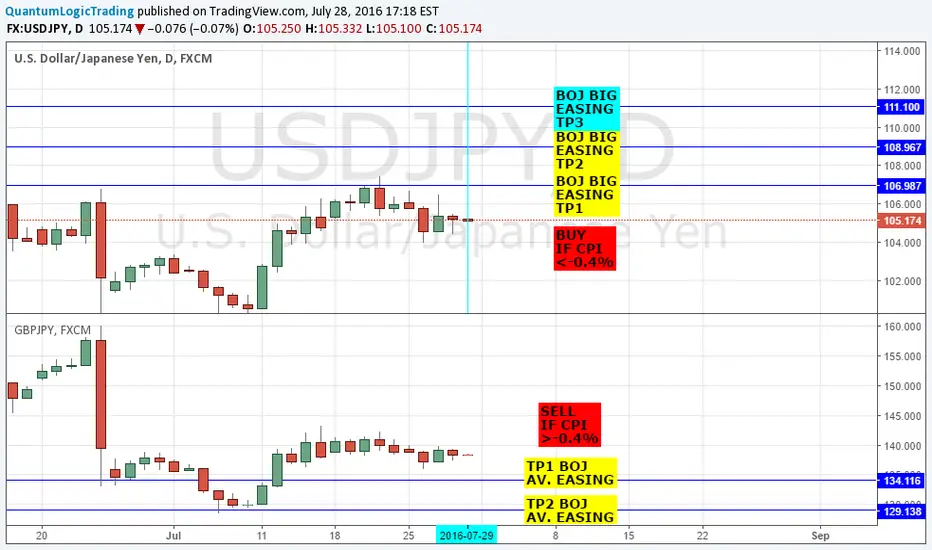
USDJPY/ GBPJPY: BUY $YEN IF DATA MISSES; SELL £YEN IF DATA HITSThe Risky BOJ front run trade using CPI inferences
- I find it very interesting that the BOJ is releasing ALL of its key economic data (minus GDP) before making the easing decision, especially as we have already had CPI data this month so we will have an 2 CPI releases in one month which ive never seen happen before (CPI from JPY is usually due next week).
- This to me indicates strongly that 1) All of the data released e.g. CPI, employment, retail sales, industrial production has some weighting on the BOJ decision and 2) that CPI especially has perhaps the strongest weighting on the BOJ decision as they are releasing 2 CPI prints in one month which means they brought forward the measurement by a week - this means they value the CPI print strongly.
- Therefore, knowing this, in an ideal world either 1) ALL of the data will contract, which puts more pressure on a big BOJ easing package or 2) ALL of the data improves which eases the the pressure on the BOJ package - thus from here we are then able to take risk with an "educated" guess of what the policy will tend to be i.e. big or smaller.
Long USDJPY if CPI less than -0.4% and generally weak/ miss other data:
1. The rationale is that a lower than expected and last print shows the JPY economy is decelerating even more aggressively than in previous months and therefore the BOJ will me MORE inclinded to ease heavier, as the data suggests there is a bigger problem.
- Obviously the data/ CPI print imo acts as a function of BOJ easing, if we get massive misses across the slew of data then we should expect a bigger easing package than if there is only a slight miss - therefore we should treat our trades the same way.
2. Long USDJPY by xlots depending on the serverity of the data miss e.g. if CPI was -1.0% and unemployment ticked up to 3.4% i would do 3lots long usdjpy. If it was -0.5% and 3.3% i would do 1lot for example.
Short GBPJPY if CPI is greater than -0.4% and other data generally hits/ is positive
1. The rationale is the opposite of the above - we assume if data improves that the BOJ will be less inclined to do a big easing package so we expect yen to remain strong so we go long yen and short GBP.
- Once again the lot size is a function of the serverity of the data e.g. if CPI turned positive to 0.1% and unemployment dropped to 3% we would short 3lots. vs only 1lot if CPI ticked up only 10bps from last and unemployment ticked down only 10bps.
Risks to the view:
1. The First risk is that data in general is considered to have "underlying trends" so the fact one print is outstandingly bad/ good might NOT impact policy e.g. thin about US NFP that was less than 100k and shocked markets - but it was a one off so didnt make the FOMC cut rates back.
3. Data underlying trends thus can reduce the weighting this data is given e.g. even if CPI improved to 0.1% from -0.4%, the BOJ could argue this is a one off print as the underlying trend for the past 6m+ has been negative inflation thus they will go ahead with a big easing package.
- HOWEVER , the above point "3" in mind i believe data to the downside will be given a greater weighting than data to the upside, so we should have a short yen bias as weak data has been the underlying trend for most data points (especially CPI).
-Further, i also think tail-end/ RHS/ LHS results will be given a proportionately larger weighting in their decision so this should also be reflected in our trading e.g. if CPI was -2% from -0.4% i would be a much much more aggressive buyer of UJ than if a -0.5% print from -0.4% is seen. The same can be said to the topside, if i saw +1.5% inflation from -0.4% last i would be a much greater seller of GBPJPY than if i saw -0.3% CPI from -0.4%.