HINDCOPPER - Breakout & Re-test structure - Monthly chartThe above analysis is done purely based on price action and chart patterns.
The analysis is done on monthly charts, hence it may take the price few weeks to few months to reach the target.
Logic as well as the trade setup is shown in image itself. The level which was earlier acting as major resistance, may act as major support for price to move up.
Entry can be done at CMP to any pull back. SL can be around 100. Targets are shown in image as well.
The above analysis is purely for educational purpose. Traders must do their own study before entering into any trade. Traders must trade as per their own risk taking capacity and money management
Feel Free to comment for any queries regarding the above stock or price action analysis in general.
To understand the re-test structure more clearly, check out the ideas linked here - APOLLOTYRE , SCI , SBICARD
Also check out my other ideas to understand how price action works and how it can be used to make regular profits without any complex strategies.
Retest-structure

ABCAPITAL - Weekly - Breakout, Re-test & Reversal - Swing TradeThe above analysis is done purely based on price action and chart patterns.
The analysis is done on Weekly TF hence it can take couple of weeks/months to reach the target.
Trade setup (Entry, SL and Target) is shown in image itself.
Entry can be also be made based on Daily TF candles.
Safe Traders can wait for closing of candle above the reversal candle and then enter.
The above analysis is purely for educational purpose. Traders must do their own study before entering into any trade. Traders must trade as per their own risk taking capacity and money management.
Feel Free to comment for any queries regarding the above stock or price action analysis in general.
The same stock was analysed couple of weeks ago on Daily TF. Do check out the analysis linked below.
Also check out my other ideas to understand how price action works and how it can be used to make regular profits without any complex strategies.

SBICARD - Morning Star at support level - Short Term swingThe above analysis is done purely on basis of Price Action & Chart Patterns.
The analysis is done on daily TF hence price may take few days to few weeks in order to reach the targets
Logic, Entry range, SL are shown in image itself.
The above analysis is purely for educational purpose. Traders must do their own study before entering into any trade. Traders must trade as per their own risk taking capacity and money management.
Feel Free to comment for any query or suggestion regarding this stock or Price Action Analysis.
Checkout my other ideas to understand how one can earn from stock markets with simple trade setups.

4H Perspective of USDCAD - Bearish PatternUSDCAD is currently making a correction move back to the bearish trendline. We are patiently waiting for a bearish pattern to form after price has just hit the 0.786 Fibonacci level. If price continues this push up past 0.786 we may need to step away from our short bias and watch the movement unfold.

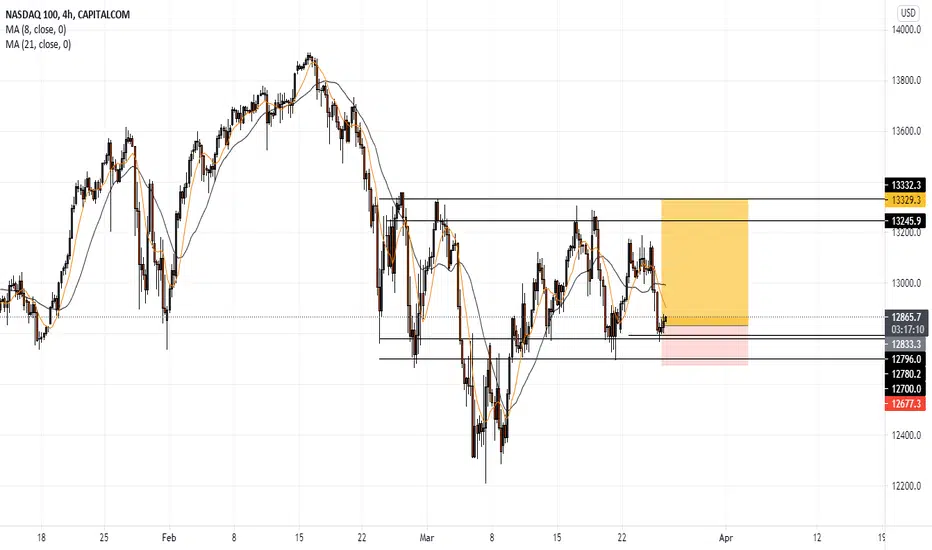
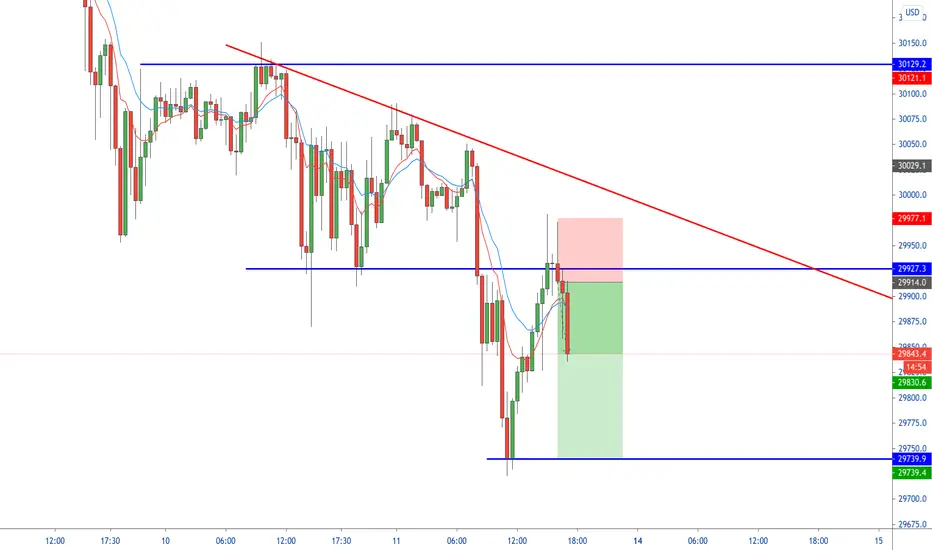
nasdaq long Price is rejecting a very strong level after failing to continue making LL,s. I went in on a early buy yesterday and got taken out at breakeven after my 1:1 was attained.
Looking to see price making new higher highs.
SCI Weekly - Re-test after beautiful breakout - Swing TradeThe above analysis is done purely based on price action and chart patterns.
The analysis is done on Weekly TF hence it can take couple of days to couple of weeks/months to reach the target.
Logic as well as the trade setup (Entry, SL and Target) is shown in image itself.
The above analysis is purely for educational purpose. Traders must do their own study before entering into any trade. Traders must trade as per their own risk taking capacity and money management.
Feel Free to comment for any queries regarding the above stock or price action analysis in general.
Also check out my other ideas to understand how price action works and how it can be used to make regular profits without any complex strategies.

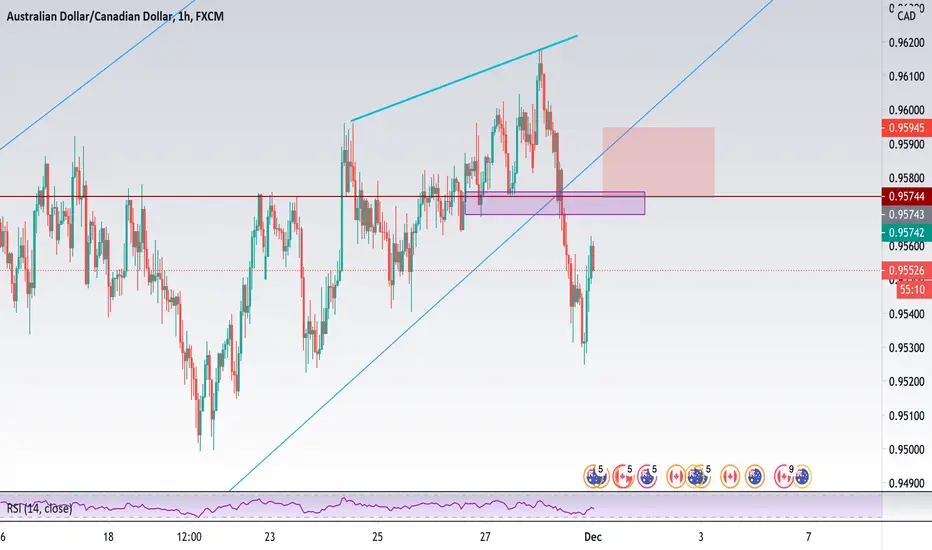
USDCAD 1.24432 + 0.01 % * SHORT IDEA CONTINUATION AND PRICE ACTIHello everyone
Hope everyone is good having a good week in the markets... here's an idea on the DOLLAR / CAD
* follow your entry rules on entries
* significant moves with the bulls change the plan.
lets see how it goes.
AS ALWAYS PROPER RISK MANAGEMENT AND A LOT OF PATIENCE & AGAIN many stars must align with the plan before executing the trade, kindly follow your rules.
HAPPY TRADING EVERYONE & LET YOUR WINS RUN...
_________________________________________________________________________________________________________________________
ENTRY & SL - FOLLOW YOUR RULES
RISK-MANAGEMENT
PERIOD - SWING TRADE
__________________________________________________________________________________________________________________________
If this idea helps with your trading plan kindly leave a like definitely appreciate it.

$T Symm.Triangle Breakout vs Fakeout?Hello Everyone!
I recently had a successful play on ATT purchasing some calls before this past weeks uptrend on $T
Unfortunately, since I didn't enter the trade with any real, calculated goal targeted, the position was exited once I saw an enticing percentage of gains.
While I'm overall happy with the results, I couldn't help but notice the disappointment in myself as the price on the calls continued to rise even more after I sold them, knowing I could've quite
easily returned even more from the position.
So I've pulled up AT&T to get a closer look to see if I can identify any other clear opportunities on a new position.
If things play out along with my idea, I'll enter a new position and this time with a more calculated plan- as is my main trading goal for this new year.
To trade with more calculated entries and target goals to exit & improve accordingly.
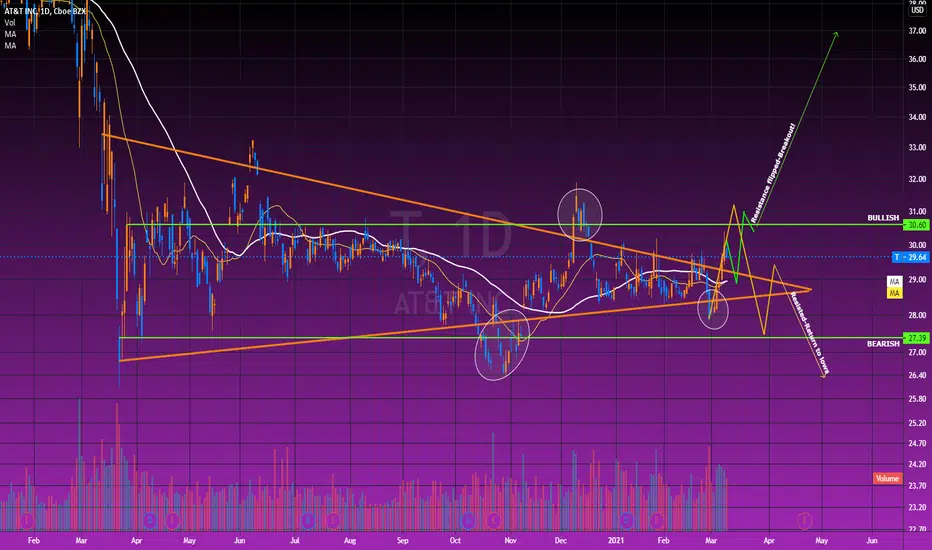
$T seems to be bouncing within a more symmetrical triangle pattern, with no real success breaking out- as noted by the circles marking the failed attempts.
Personally I'm predicting that with some of the new business strategies AT&T is aggressively taking on recently, we could see some buyer confidence based off of those fundamentals. This could support the possibility of finally breaking out of this Symmetrical Triangle. We also seem to be retesting the resistance more than the support.
If price breaks above the horizontal line (marked BULLISH), a pullback using that line as new support would be a great point for an entry. The top of that green arrow marks the target, slightly under $37
While watching this play out, I'm considering if taking on this move in the form of going long on both shares & some Options calls would be a strong move?
That play would require some closer consideration to avoid over exposure to risk.
I say that, because at this point it seems equally telling that ATT could continue downward, especially if resistance holds on a retest and buyer confidence weakens.
I've laid out the 50 MA (thicker white band) & the 20 MA (thinner yellowish band)
the 50 MA will help as a tool to plot safe stop losses without being too overprotective of the position resulting in getting stop'd out.
I'll try to update on which way my view of this potential plan plays out on this idea.
Please feel free to give friendly but honest critiques!
Happy Trading!
*this is not financial advice*
**all my charts are for educational & personal tracking purposes**
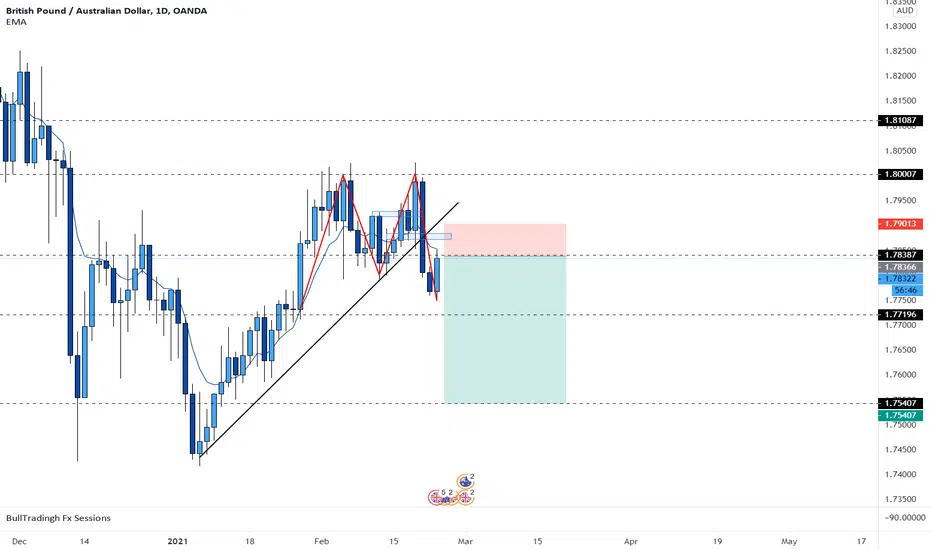
GBPAUD 4.5 R:R swing tradeConfluences:
-Daily M pattern
-Price broke out of consolidation range and it's retesting it
-Price is also at a major zone (now resistance) and has been under it for multiple 4h candlesticks indicating lack of bullish momentum
-It's a beautiful 4.5 risk-reward
Tell me what you guys think!
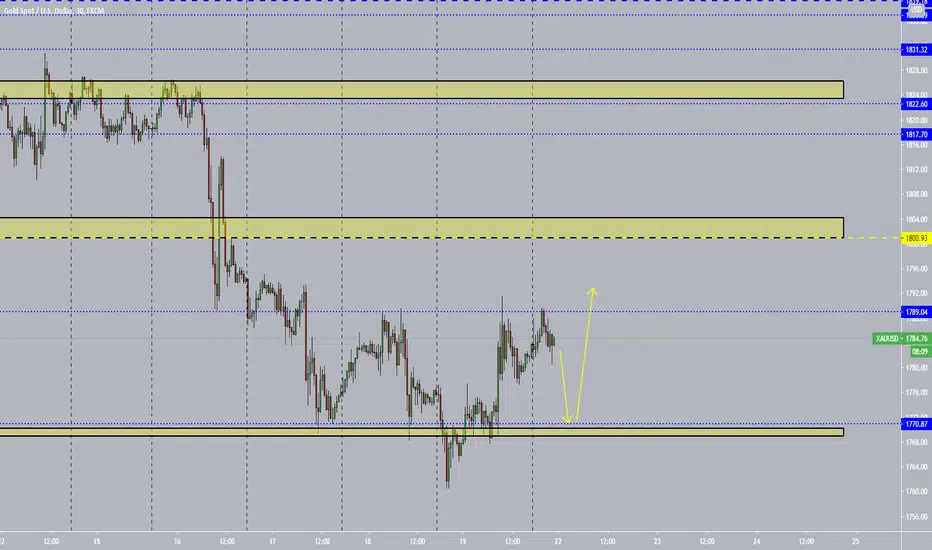
GOLD SELL MAY RETEST 1772 ZONEPROBABLE RETEST TO HAPPEN BACK TOWARDS 1775/1772/1770 ZONES BEFORE WE SEE MORE BUYS HAPPENING
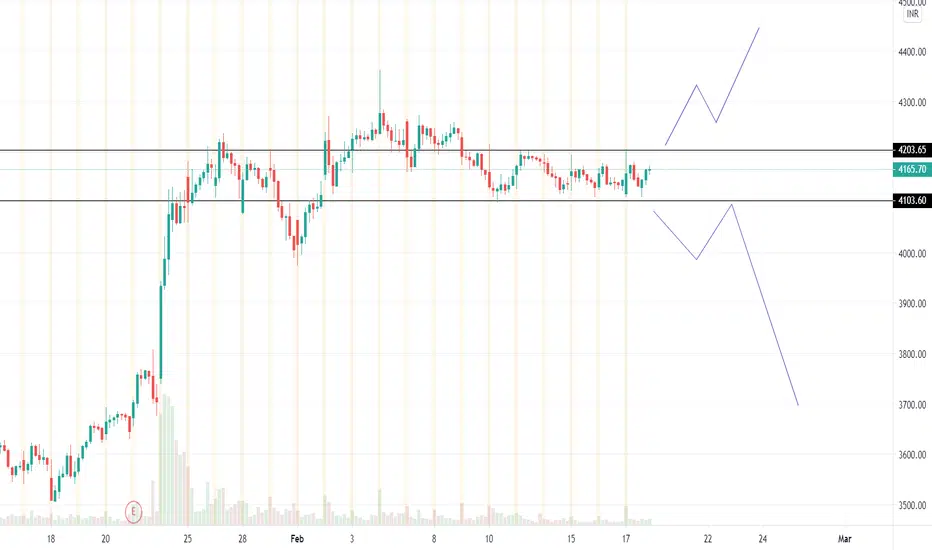
Analysis on Bajaj AutoBreak out of the level 4200 with retest will lead min 4400
SL 4050
probably high chance of downside, it looks like a distribution phase However wait for the confirmation
breakdown of the level 4100 with retest will lead min 4000
Target 3700
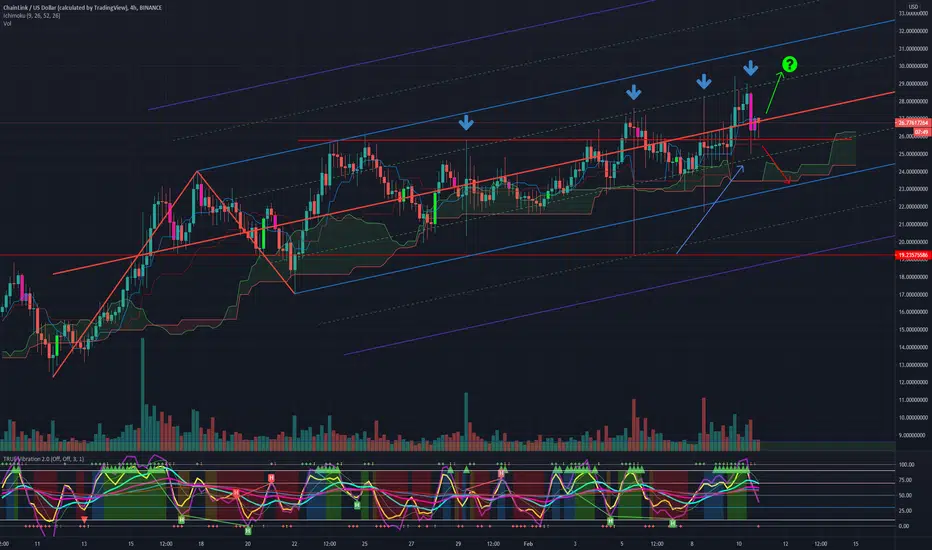
$LINK Testing the patience of the market$LINK's breakout from 25 dollars went as high as $29.37, but was quickly forced down by massive sell pressure from the #Chainlink team. A nice retest of the $25 area and a large wick on the 4 hour candle still looks pretty bullish to me. If this 4 hour candle is followed by a push above the pitchfork's .5 deviation? That would put price around $30, which would be a big psychological S/R flip.
TL:DR look for link to break above the pitchfork median and continue to 30 dollars? If it does, I'd imagine more volume would follow and people chasing the pump would dive back in. It could also fail to establish itself over the median and fall to retest the .5, and even the 1.0 deviations. Either way, $LINK is a strong buy at sub 30 dollar levels for me. I'm only stacking and holding while waiting for staking to be implemented.
RECLTD - Breakout and retest - Positional TradeThis analysis is done purely on basis of price action and chart patterns.
The analysis is done on weekly TF hence it can take couple of days to couple of weeks/months to reach the target.
The image is self explanatory.
Range for entry, SL and Target is shown in image itself.
This analysis is for study purpose.
Traders must do their own study before entering into any trade. Traders should trade with their own risk capacity and money management.
Feel Free to comment for any query or suggestion regarding this stock or Price Action Analysis/Chart Study

APOLLOTYRE - Breakout & Retest - Good for swingThe above analysis is done purely based on price action and chart patterns.
The analysis is done in live market on daily TF hence price may take few days to few weeks in order to reach the targets
Logic as well as the trade setup (Entry, SL and Target) is shown in image itself.
Safe traders can wait for today's candle closing and if the level is sustained and volume is still not increasing, then entry can be taken above today's high. SL and Target will remain same
The above analysis is purely for educational purpose. Traders must do their own study before entering into any trade. Traders must trade as per their own risk taking capacity and money management
Feel Free to comment for any queries regarding the above stock or price action analysis in general.
Also check out my other ideas to understand how price action works and how it can be used to make regular profits without any complex strategies.

EUR/CHF Are we correcting to the 0.618 FIB ? Good Day traders !! On this pair we have a "W" formation on the daily timeframe and we are heading toward the neckline of this pattern in order to complete the pattern. Also we can realize a impulse correction impulse pattern and head to the upside after the retest of the neckline which is in confluence with the 0.618 FIB retracement. From an institutional perspective the Eur is strong this week and can expect a continuation to the upside without any issue.
On the Swiss franc institutions didn't add any long during the last report of Friday but they closed a few short positions which can explain this retracement that we wish to see. On the flip side institution added a massive amount of long positions on Eur and that explains the power of the bulls from the beginning of the week.
Now if you enjoyed this analysis smash that like button and share. If you have a different opinion please leave a comment below as I would love to have your insights on this pair.

RVNL - Retest of Breakout - Swing TradeThe above analysis is done purely based on price action and chart patterns.
The analysis is done on daily TF hence price may take few days to few weeks in order to reach the targets
Logic as well as the trade setup (Entry, SL and Target) is shown in image itself.
The above analysis is purely for educational purpose. Traders must do their own study before entering into any trade. Traders must trade as per their own risk taking capacity and money management.
Feel Free to comment for any queries regarding the above stock or price action analysis in general.
Also check out my other ideas to understand how price action works and how it can be used to make regular profits without any complex strategies.

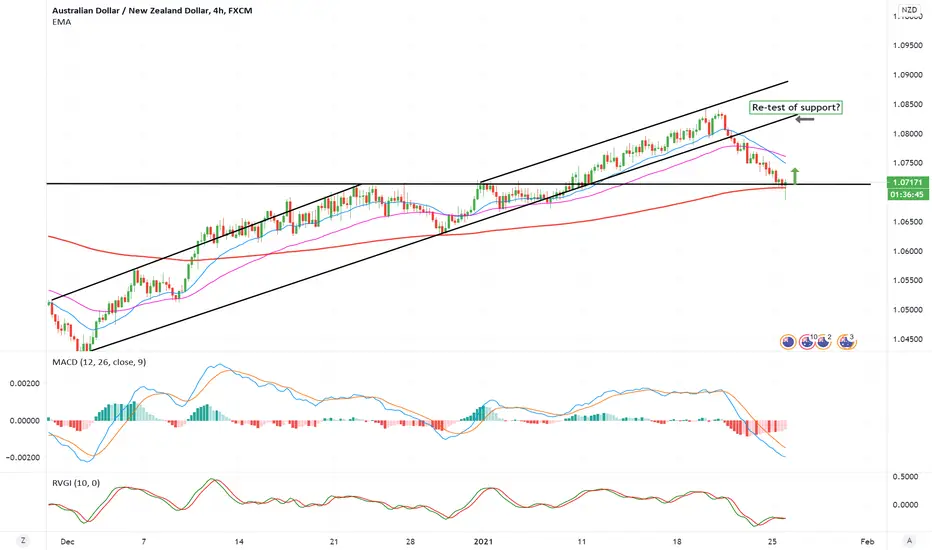
AUD/NZD - LongPossible long oppotunity on AUD/NZD.
Price has broken out of its ascending channel has returned to an area of support at the 1.0720 level.
If we see strong bullish rejection at the 1.0720 level I believe we could see bullish momentum to re-test the support of the ascending channel at the 0.0820 level, where I would take profits.
Pullback Setup | Broken Structure Confluences | Gap FilledLooking for longs on 0.5 fib retracement retesting previous confluences: broken descending TL, respectable ascending TL, and previous area of S&R. Long term target: 2060

AGRX Long TradeSignals:
Terminal flag in Trading range - 3 bottom Buy Divergence on decreasing supply & Increasing demand. Four Month Non Climactic accumulation pattern
Entry 2.83
1st target $3
2nd Target $3.25-3.30
3rd Target Retest of 52W Highs
Stop Loss- $2.75
**May re-enter on Buy Stop above $3 if stopped out

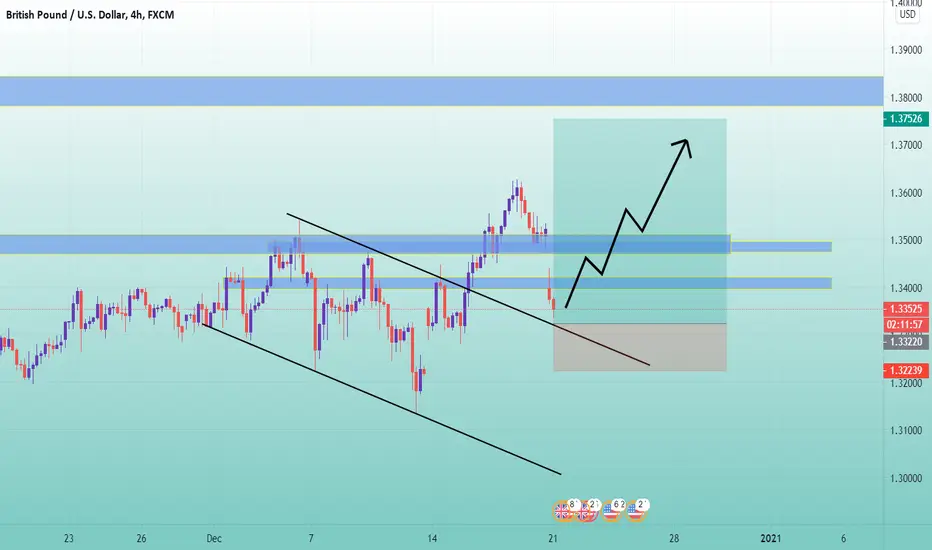
GBPUSD longGBPUSD revised the forecast, as the week gap was completely changed by the previous pattern.
AUDCAD Break and RetestBroke and retest of structure and previous low in structure
Have an Sell Limit placed in that zone
Going for a trailing SL with a starting SL of 20 pips and a Open TP
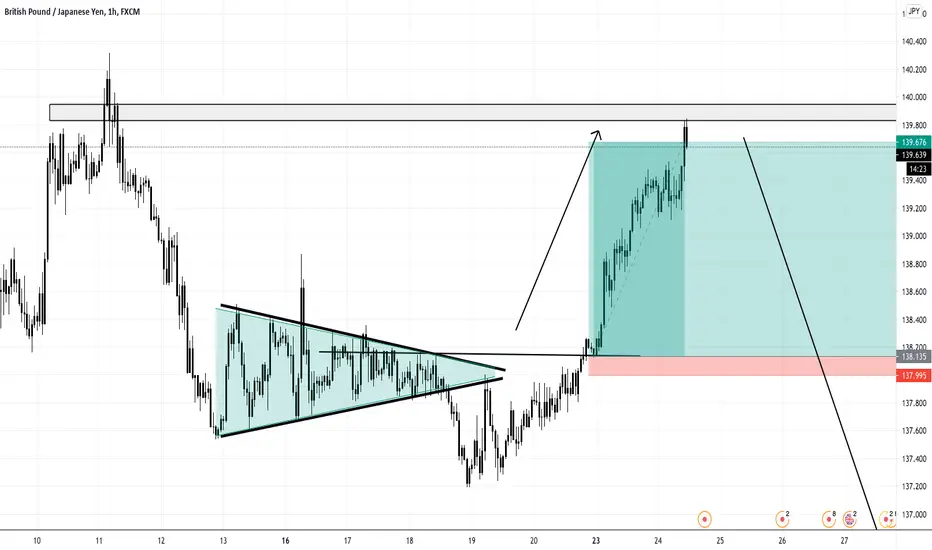
GPBJPY wedge breakout, retest and confirmation.GPBJPY was forming a neutral wedge, which it broke out from towards the downside. After waiting for a retest, price broke through our resistance and had a retest towards the upside. After confirmation from the retest, a buy was placed for a r/r of 11/1.