Week 46: ZSF 2021 Buy at retest levelWeekly analysis for ZSF2021
Week 46: 09 to 13 November 2021
Market was pushing the price higher and made a new Higher High last week.
The Head and Shoulder formation was not happening, on Friday the momentum was slower and today not much happening too in Asian session.
Overall trend is still bullish, but don't jump to the band wagon now; we better wait at a retest level to long.
My personal trade call for this week :
Buy Limit at $1,084
Stop Loss at $1,061
Take Profit at $1,130
RR = 1.92R
Special note :
As there is no reference on the Take Profit, we do not know how bullish it will be.
My advise, watch for the Price Action in H1 and H4; they will give you an early warning whether to close manually or let it ride.
If I happen to watch it, I will update it here on comment section.
Disclaimer :
The analysis above for educational purposes only, I do not responsible for your losses. Please adjust your own lot-sizing according to your appetite.
If you are benefiting from my trade opinion, please buy me coffee.
As always, move your SL when you are in the profit zone.
Retest-structure

USDAUD - BEARISH MOVEMENTA retest has occurred on both the support level and trend line, we anticipate a bearish movement.

XAUUSD Short Daily Retest/PullbackRetested the ressistance level which acted as a strong structure level previously.
With this the Rally for the next support level of 1745 starts and gold is gonna be cheaper till 14 Nov Diwali
Happy Diwali with gold going low
R-R 1:1.7

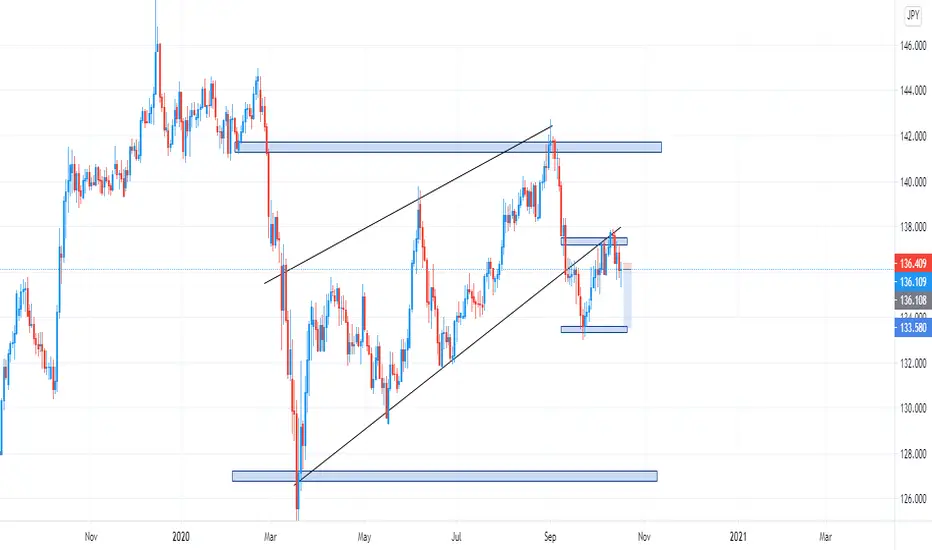
What do You Think on GBPJPY????As we can see guys we have a break on our trendline support and the price has already retested our trendline support, As long as we have a break and retest we anticipate bears to be in control for the next week.
WE ARE TRADERS I KNOW YOU MIGHT HAVE SOME IDEAS, LETS US SHARE AND DISCUSS MORE IN THE COMMENT SECTION.
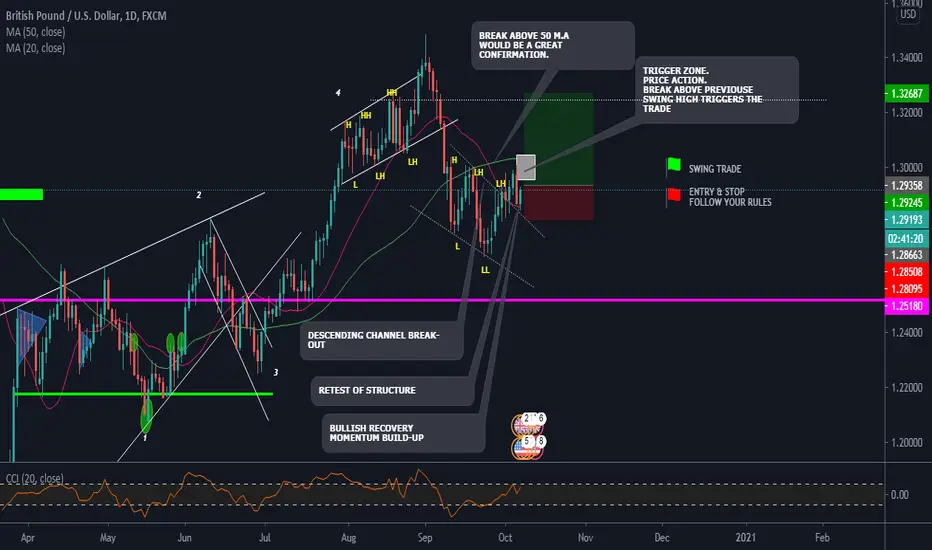
GBPUSD 1.29188 + 0.39 STRUCTURE & PRICE ACTION IDEAHELLO EVERYONE
Here's an idea on the DOLLAR/POUND that broke out of the descending channel structure pushed up with the bulls then came down to retest structure and is currently trading in a nice recovery candle with the bull. looking at what price will do or rather will it break previous previous swing high and push up has will be watching price in my trigger area and a break above the 50 M.A would be one of those nice confirmations that trend momentum is shifting with the bulls. hope this idea assists in a way with your trading of the DOLLAR / POUND.
LET'S SEE HOW IT GOES..
HAPPY TRADING EVERYONE
_________________________________________________________________________________________________________________________
ENTRY & SL - FOLLOW YOUR RULES
RISK-MANAGEMENT
PERIOD - SWING TRADE
__________________________________________________________________________________________________________________________
If this idea helps with your trading plan kindly leave a like definitely appreciate it.
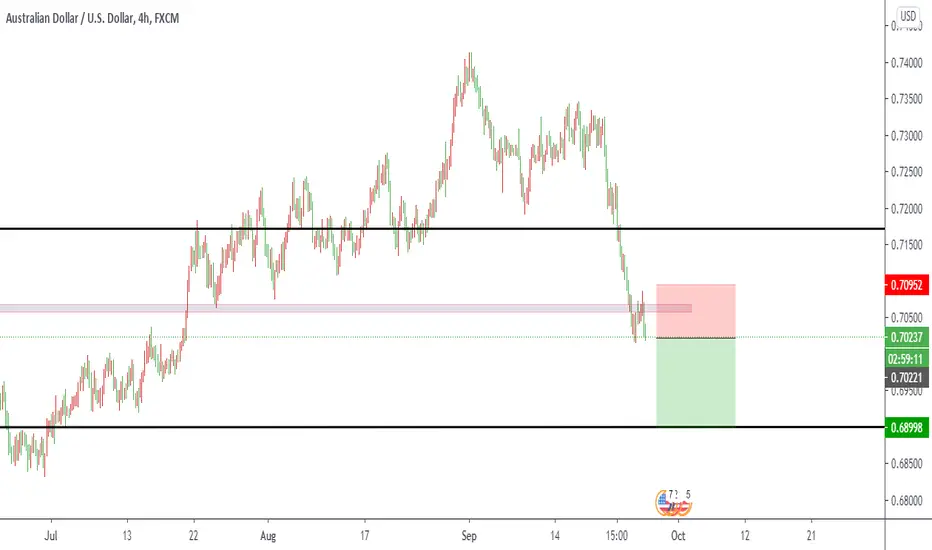
AUDUSDBack to basics. You follow the price and all it's action. we are looking at a simple breakout and retest in a downtrend.
USDCAD Long Opportunity Ahead - RetestAfter breaking the previous structure Ressistance level and the Daily Ressistance Trend Line the pair is in the move for a retest of the zone again.
A good Price Action pullback entry pattern candle on the 0.382 Fibo level is what I will be watching tomorrow.

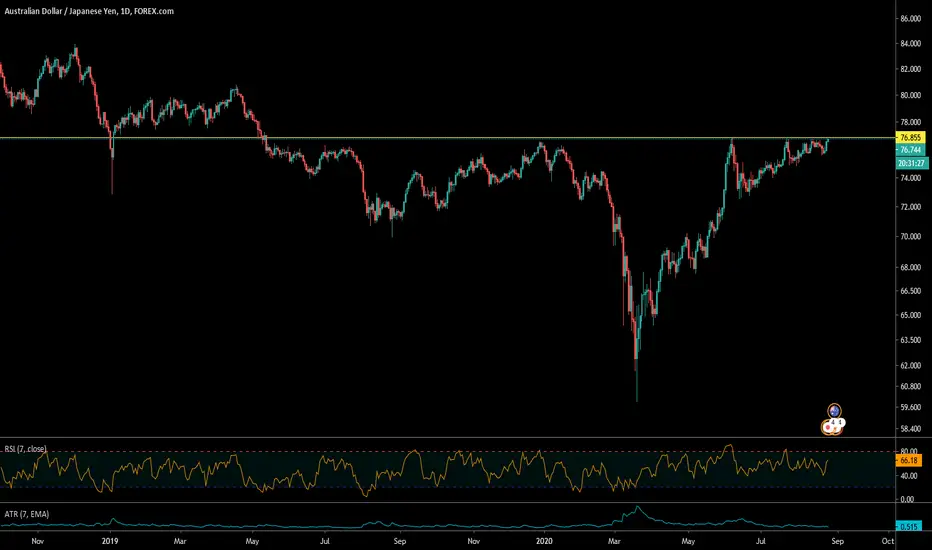
AUDJPY Bullish BreakoutI have been waiting on this breakout for a while now. Predicted this one a few weeks back. Once we get a break above then look for a retest to get involved. If we get the break then short term 77.80's and long term possibly 80.50's.
-Raymond J.
Pullback Approaching Entry LevelAfter a major breakout of the descending daily trendline, NZDCHF is now approaching to retest it on a pullback in confluence to our 0.5 fib retracement and a small area of previous support where we can consider opening our long positions from.

Break and retest of sell zone Price has completed a head and shoulders pattern and is retesting the neckline, for a sell.

LINK - DO NOT SELL YETHello,
the bad candle today was due to
1-the linkusd price to approach the psychological level of 10$, and many people set a TP slightly below in order to make sure it was triggered.
2- a retest of the fibo retracement area in the linkbtc chart. As far as we do not fall in it again, I am still bullish.

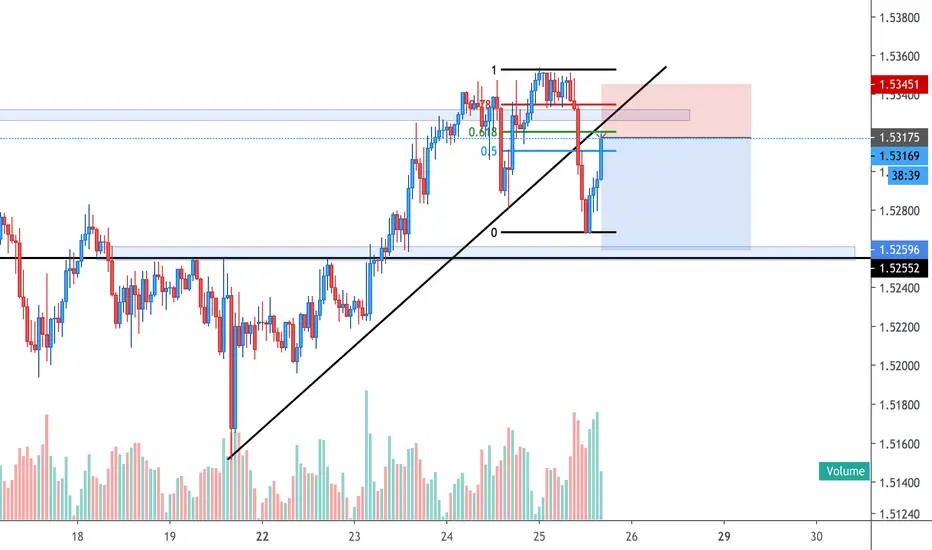
Potential H&S SetupAUDUSD approaching to retest the broken ascending trendline in confluence with our 0.618 fib retracement and previous resistance. Overall, structure could be forming a H&S on 4H time-frame - which can provide a reasonably good short opportunity.

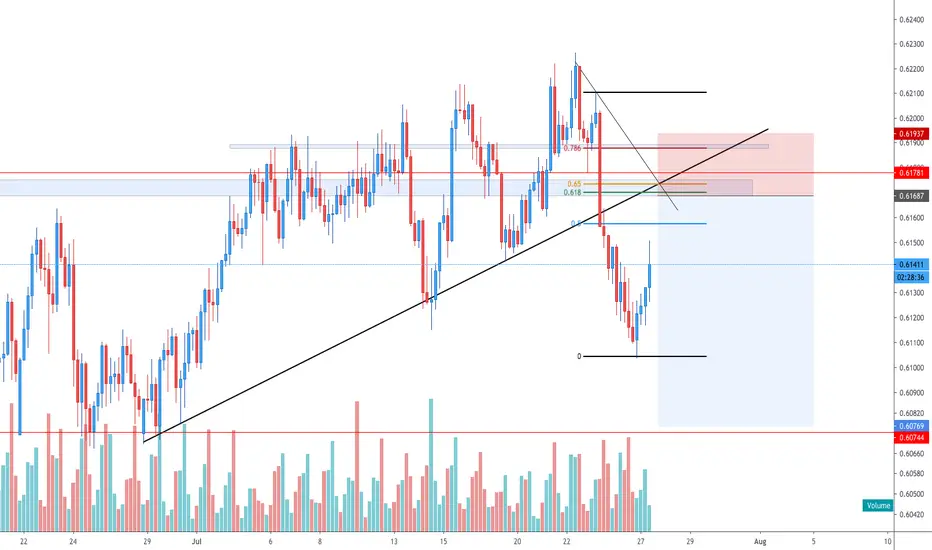
Golden Pocket Short Setup on PullbackLooking to enter shorts on a pullback to retest the broken ascending trendline and the currently descending trendline in confluence to our 0.618-0.65 fib retracement area, ultimately creating a golden pocket to open our positions from. Furthermore, there is a strong historical S&R zone which can act as a rejection spot for the price.
Intra-day Long & Swing Short SetupIntra-day:
Looking for a pullback to retest the recently broken hourly trendline in confluence to our 0.618 fib retracement and a strong hourly support area.
Swing:
Assuming the intra-day setup plays out in accordance to the plan, a strong short setup is formed on the respectable descending trendline in confluence to the outer 0.618 fib retracement and previous S&R area.

Pullback to Retest Trendline | Daily Short SetupCADJPY slowly approaching to retest the descending daily trendline, which ultimately can experience a rejection from it. Looking to open shorts near the 0.618 fib retracement and previous level of S&R.
USOIL back to run 🦐The market after consolidating below the 41 area has now break the Daily structure.
We will wait for the closure of the daily candle and check for a long position at the retest of it to set a long order according with our strategy.
–––––
Follow the Shrimp 🦐
Here is the Plancton0618 technical analysis, please comment below if you have any question.
The ENTRY in the market will be taken only if the condition of Plancton0618 strategy will trigger.

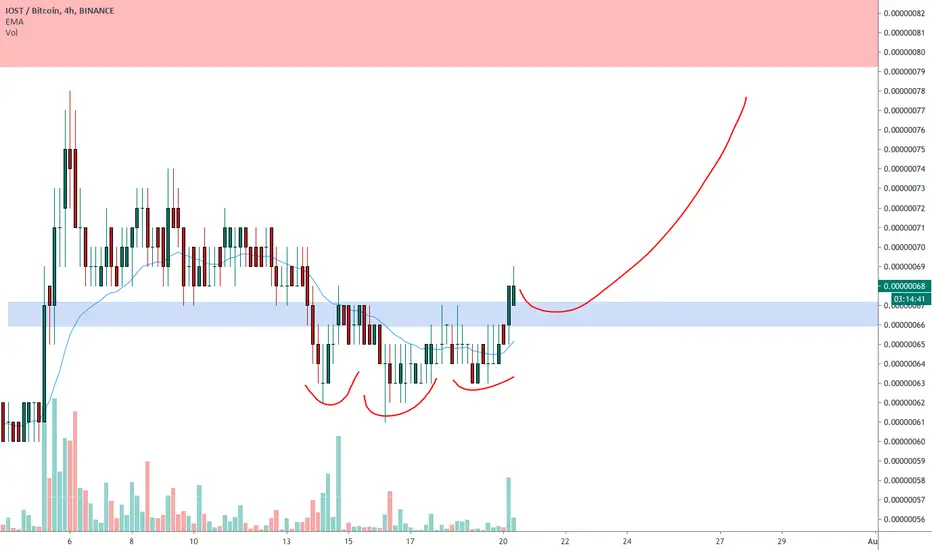
IOSTBTC nice breakout on 4h 🦐IOSTBTC nice breakout on 4h, now we are waiting for a retest According to Plancton's strategy, we can set a nice order
–––––
Follow the Shrimp 🦐
Here is the Plancton0618 technical analysis, please comment below if you have any question.
The ENTRY in the market will be taken only if the condition of Plancton0618 strategy will trigger.
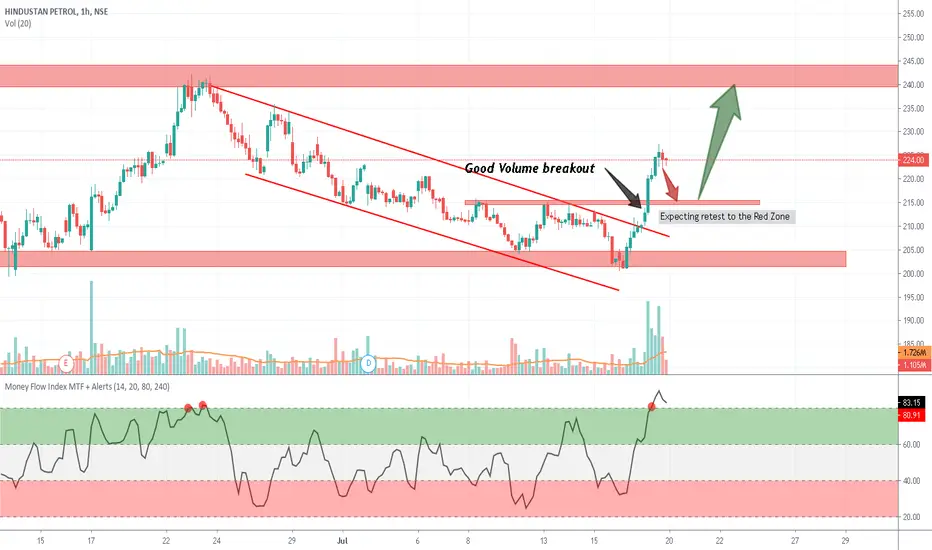
Hindustan Petrol from 17 July 2020The stock has come out of downtrend and pushing towards the upper range
Currently buyers exhaustion ( retracement ) can be seen --> MFI also started decreasing --> expecting price to come to red zone than continue its push to the 240 target range
Trade Setup :
When price comes down to 215 Level --> SELL PE option which has value of 5rs ( possibly 205,200)
Possible Retest & Long Position - GBPCHF - 7.68% R:R Hi All! Hope you're keeping well and having a great weekend! Just wanted to share a personal analysis I've made on GBPCHF! Please feel free to comment below any questions you may have!
With GBPCHF, I would personally like to see some movement to the downside towards the marked 4hr structure, to retest it as a support for price then to move back and follow the price trend to the upside. As you may not know, the Bank of England has a speech tomorrow which will greatly affect the pound - if the speech is 'hawkish' then we could see some strength for GBP which will support this long position.
You may notice that the fib retracement isn't on the highest wick, which is something I've personally done because I feel that maybe the last two candles on Friday could be very sketchy to work off, especially towards the market close. By doing this though it's lining up perfectly with the structure, and would be nice to get a long from that position. We're also above the 40EMA which I personally work with on minor pairs which will support this - also this could count towards a touch on the ascending trendline (subjective) which could also show support.
I have chosen to have my stoploss at 20pips + 3pips for spreads, and I will be risking 1% of my capital for this trade.
Confluences:
Trendline
Structure
40EMA
Fib Retracement
Conformation
"Pending" 😉
Obviously please do your own analysis, so please don't take this as gospel and please ensure that you use the correct risk management for this trade.
Let me know your guys thoughts!
Cheers
Daniel
Instagram: @DanielJamesFX
Twitter: @DanielJamesFX

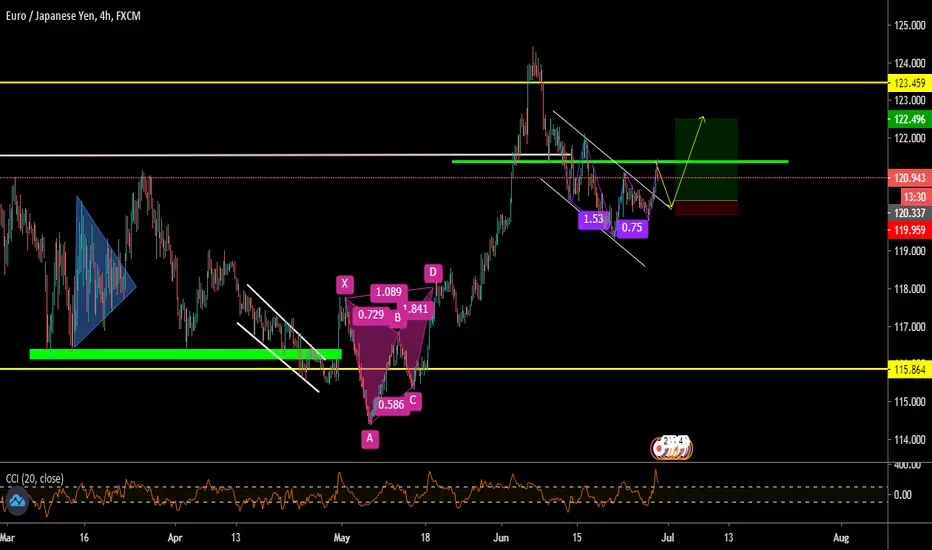
EURJPY 120.703 - 0.55% LONG IDEAGood Day Everyone
Here's an idea on the EURJPY pair, we just broke above the descending channel overbought on multiple indicators which may signal a correction or retest of the structure then continuation to the upside. looking for long entries on the pair should everything be satisfied.
_____________________________________________________________________________________________________________________
RISK-MANAGEMENT
ENTRY & SL - FOLLOW YOUR RULES
PERIOD - DAY TRADE
TARGET1 - 121.098
TARGET2 - 122.098
________________________________________________________________________________________________________________________
If you like the idea kindly leave a like and a follow will definitely follow back and leave your idea & Comment on the pair in the comment section. APPRECIATE IT
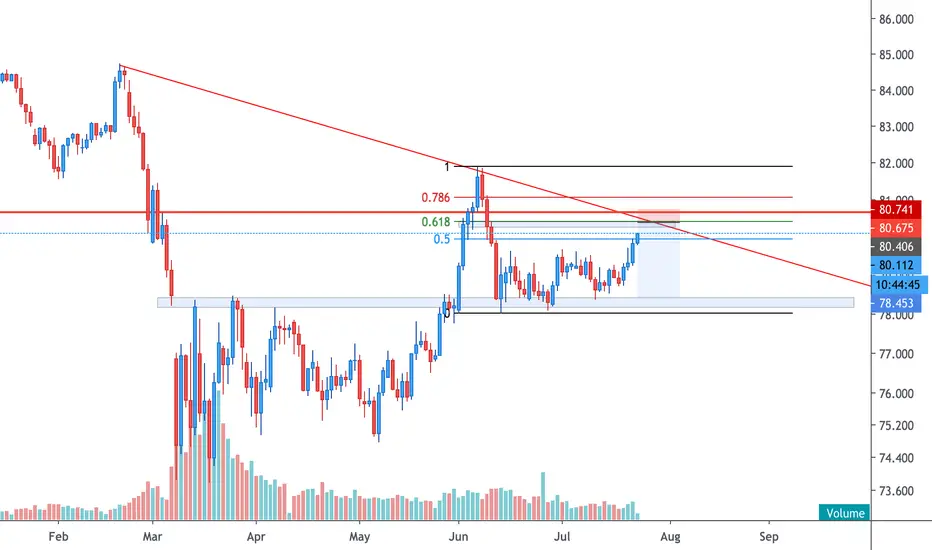
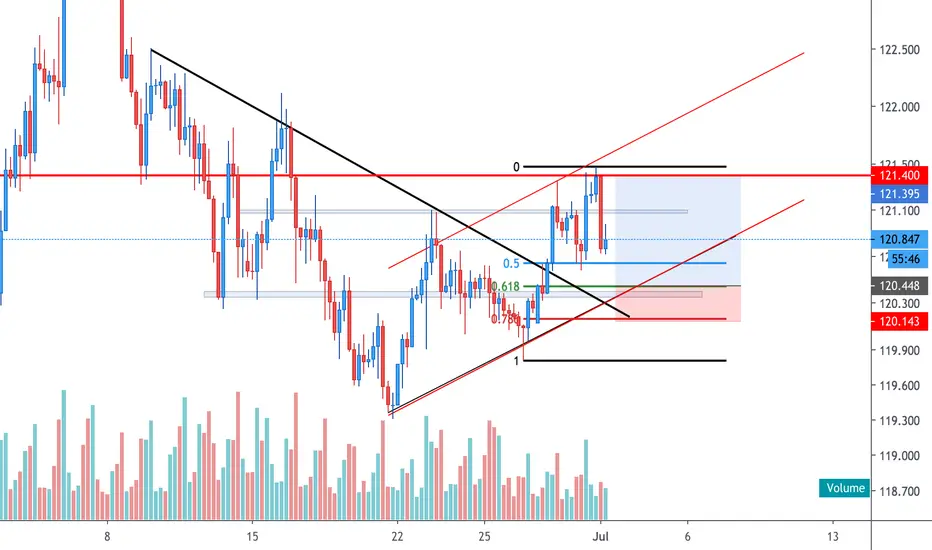
Trendline Breakout & Retest SetupEURJPY currently finds itself trending within an ascending parallel channel after successfully breaking out of the descending trendline. We will be looking to enter longs on a pullback towards the 0.618 fib retracement, in confluence to our outlined parallel channel and the previous level of support.
EURUSD Short on Trendline RetestEURUSD broke out of the ascending trendline last week and now retracing back to retest it. We will be looking to open shorts on a pullback towards the 0.618 fib level, in confluence to the previous level of S&R.

Trendline Retest | Short SetupSelling EURCAD on a pullback towards 0.618 fib level to retest the previously broken ascending trendline and continue to the downside.