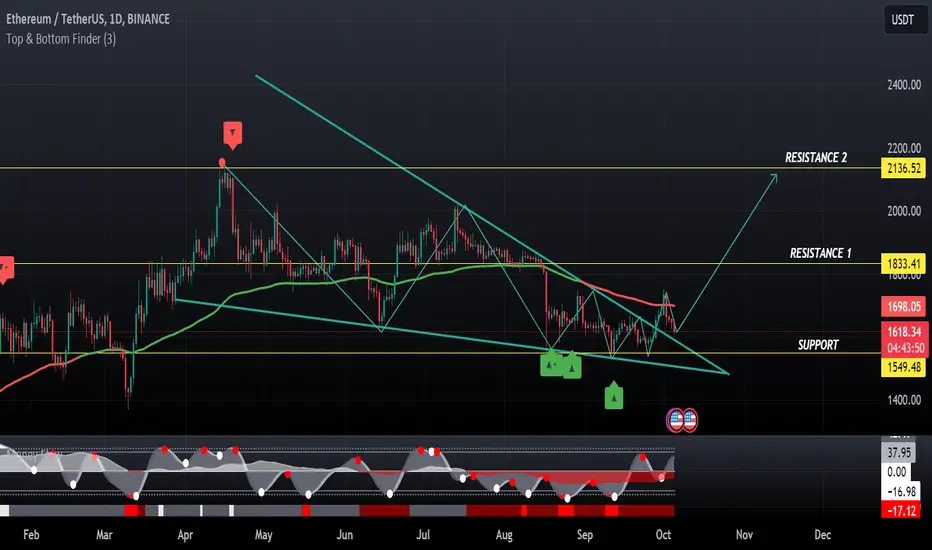
ETH ANALYSIS🌸#ETH Analysis : Breakout and Retest ✅️ ✅️
🚀#ETH was following falling wedge patten on 1 day time frame and we can see a confirmed falling wedge breakout with retest which indicates a bullish move in #ETH.💲💲
🔖 Current Price: $1617
⏳️ Target Price: $2000
⁉️ What to do?
- We can trade according to the #ETH chart and make some profits. Keep your eyes on chart price action, observe trading volume. Always observe market sentiments and update yourself everyday.🔰🔰
🏷Remember, the crypto market is dynamic in nature and changes rapidly, so always use stop loss and take proper knowledge before investments.
#ETHAnalysis #Cryptocurrency #Breakout #Retest #DYOR
Retest-structure
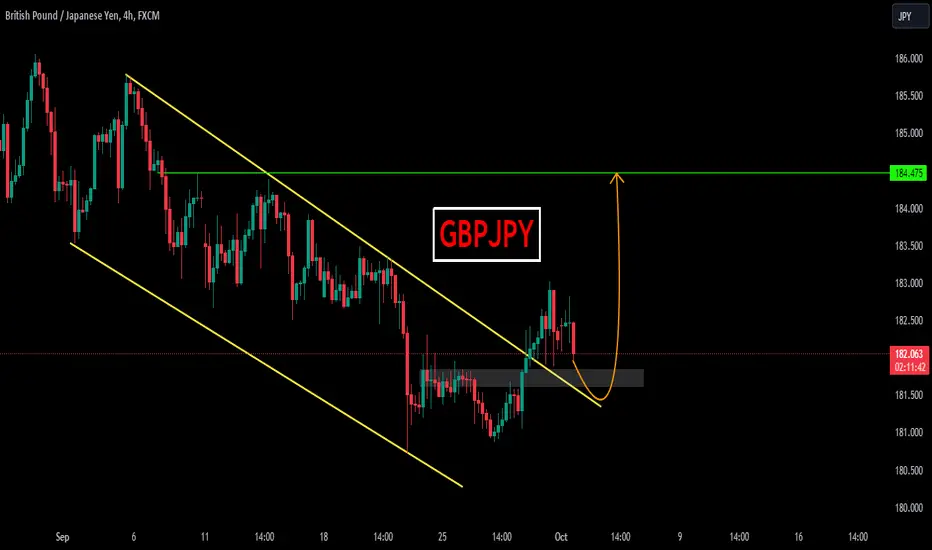
GBPJPYGBPJPY was trading in descending parallel channel and recently it seems like the sellers are bit exhausted now and bulls took the charge and now has given the breakout from descending channel.
Currently the price is forming a local support around 181.80 region.
Will the bulls take charge again continue for leg higher?
What you guys think of this idea?
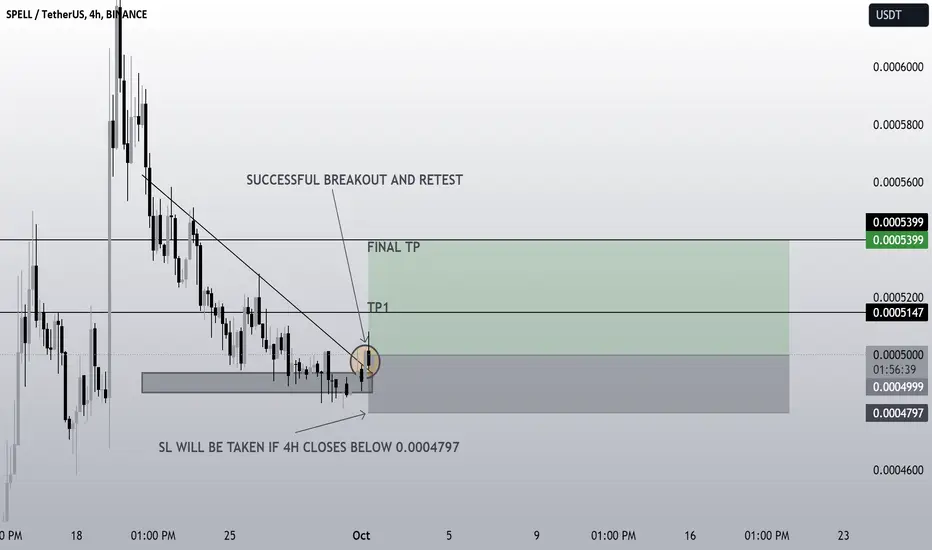
SPELL ANALYSIS POSSIBLE MID TERM TRADEAs we can see that the spell made a good outbreak from the trendline and retest it successfully. Now I am hoping it could give 15% from this point. Total profit will be of 8% where the SL is only 4%.
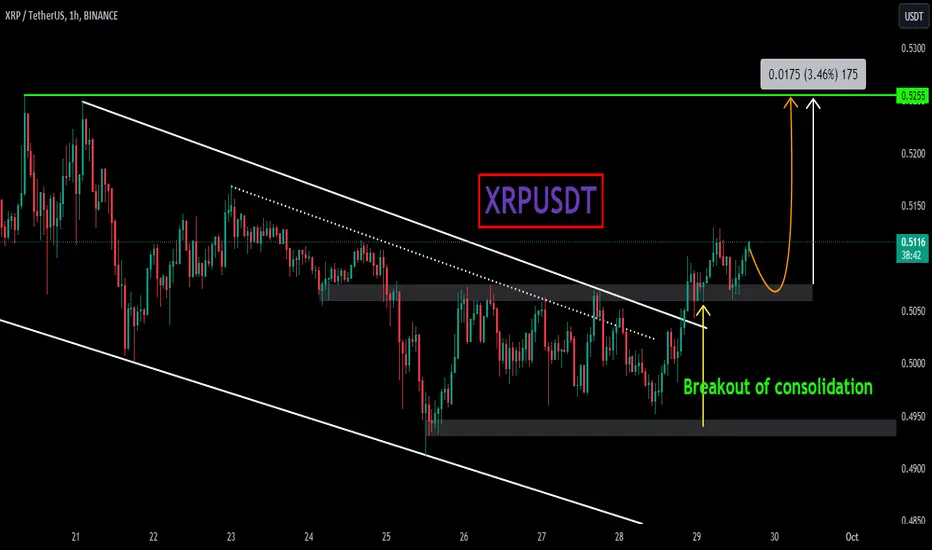
XRPUSDTXRPUSDT was trading in descending parallel channel and recently it seems like the sellers are bit exhausted now and bulls took the charge and now has given the breakout from descending channel.
Currently the price is forming a local support around 0.5070 region.
Will the bulls take charge again continue for leg higher?
What you guys think of this idea?
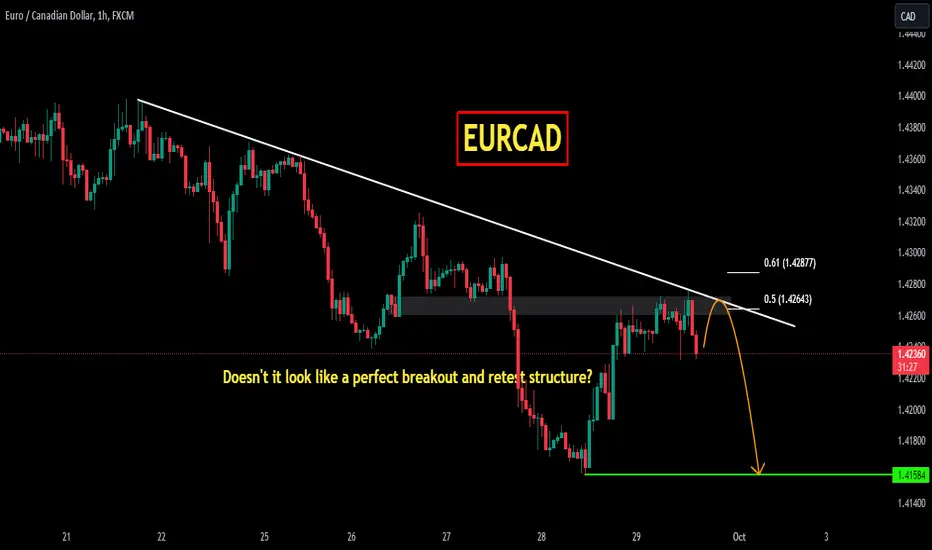
EURCADEURCAD is trading under the declining trendline and break through Support and closed below this zone. now the price perfectly retest of broken level at 50% fib retracement level.
Will the sellers attack again and send the price to 1.4160 level?
What you guys think of this idea ?
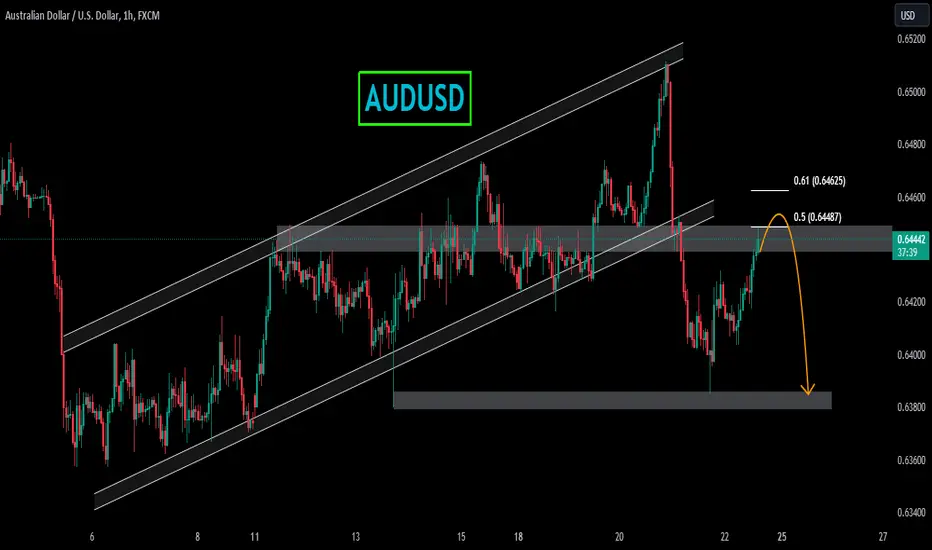
AUDUSDAUDUSD was trading in bullish parallel channel till the sellers took control from channel resistance and has given the massive sell rally. That sell rally break the ascending channel.
Now the price is retesting the broken channel and broken support level. which is also the 50% fib retracement level.
it seems like the sellers can attack again this bearish confluence.
If the sellers takes charge again, the next target could be 0.63800.
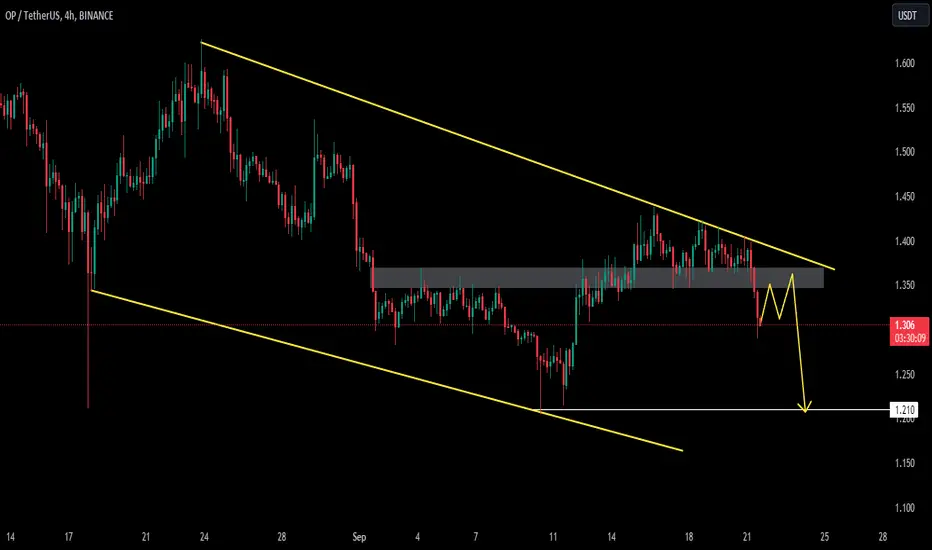
OPUSDTOPUSDT is trading in descending channel and printing consistent LLs LHs. Recently the price is broken the important support zone and now the retest of the broken level is highly possible, which is also the Fib retracement level.
If the sell momentum continues the next target could be 1.210 region.
What you guys think of this idea.
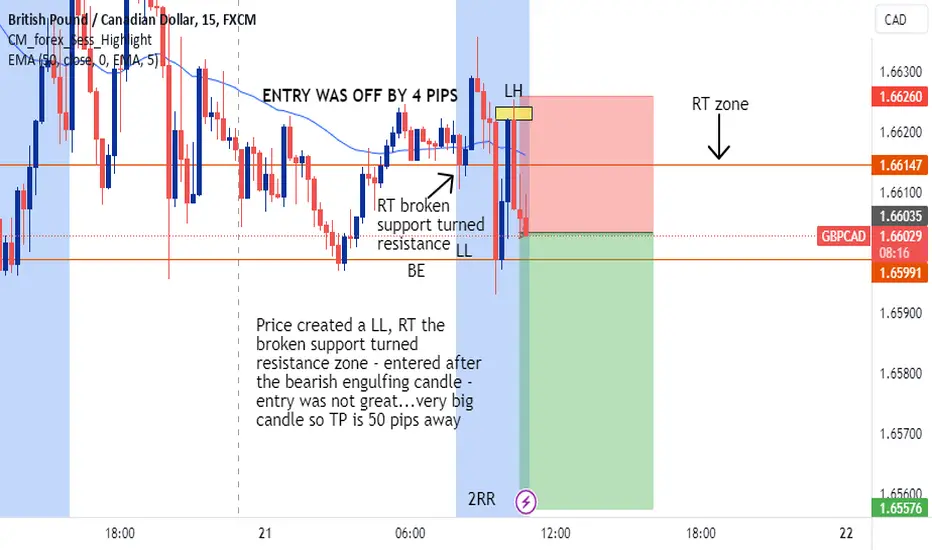
GBP/CAD Short Opportunity - SeptemberExplanation within the chart - entry could have been better. Going for a 2RR
USD/JPY Short Opportunity - September Market structure was clean, clean traffic to the left. Every rule / confluence was met - great RR and great RT to EMA on HTF and entered TF - however took a chance on price action as the entered bearish engulf was 50% body & wick.....then trade is invalid !!

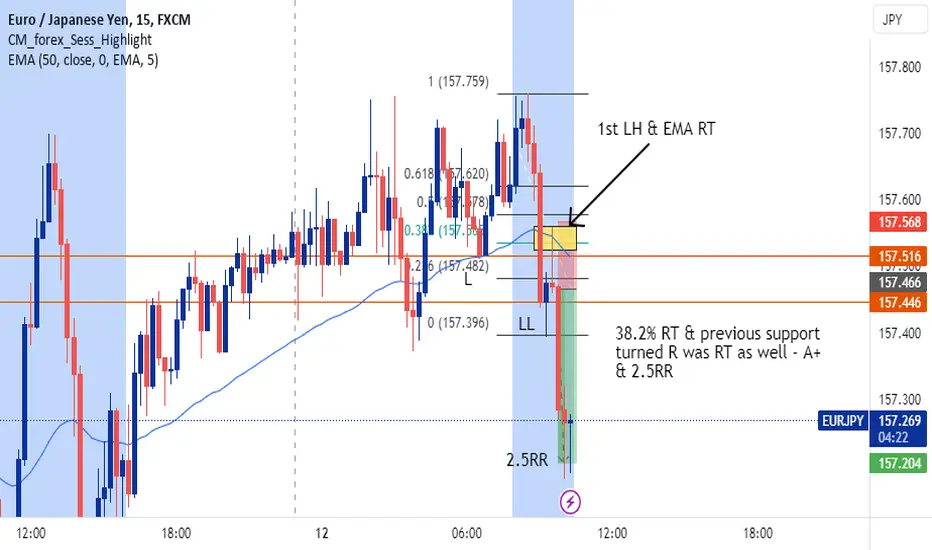
EUR/JPY Short OpportunityA+ Setup !! combination of both my plays - RT with broken support zone and a 38.2% RT !
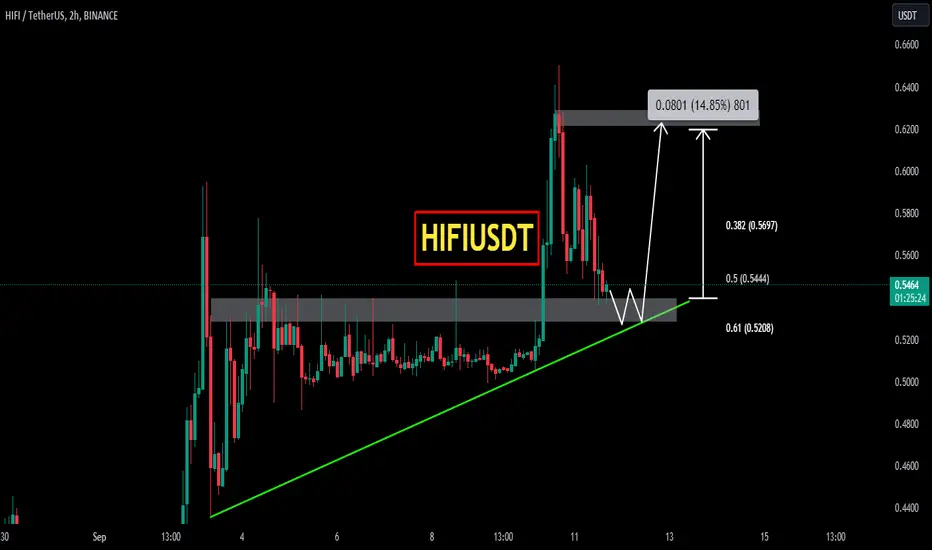
HIFIUSDTHIFIUSDT is in strong bullish trend.
As the market is consistently printing new HHs and HLs.
currently the market is retracing a bit after last HH, which is also the 50% fib retracement level and broken resistance which is also reacting as a support. if the market successfully sustain this bullish confluence the next leg high could be 0.6300.
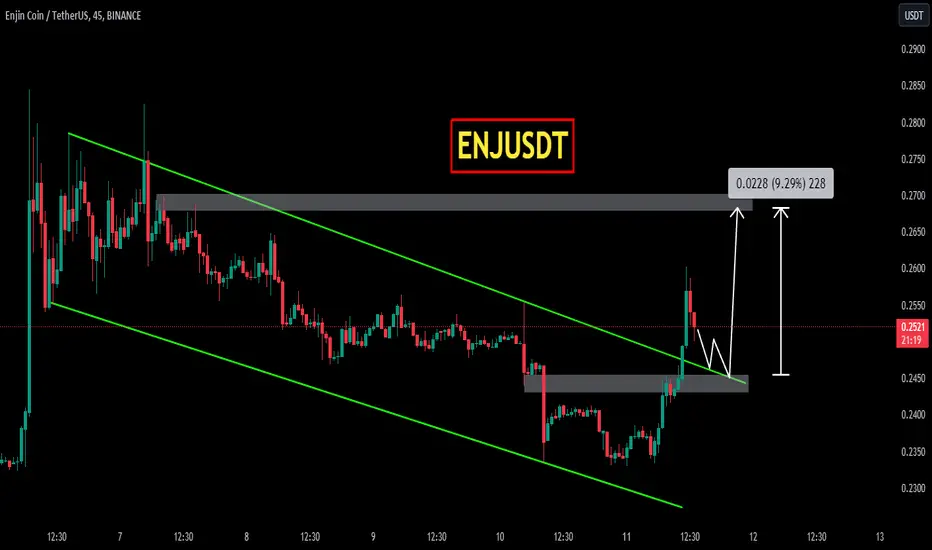
ENJUSDTENJUSDT was trading under declining trendline and recently it seems like bulls are starting to take the charge and has given the breakout from declining trendline with significant bullish candles .
Currently the price is retesting the broken trendline , if the retest level holds it could be a nice buying option.
What you guys think of this idea?
EURAUDEURAUD is trading in descending channel and printing consistent LLs LHs. Currently the price is broken the important support zone then any retest of broken level will be another sell option.
If the sell momentum continues the next target could be 1.6550 region.
What you guys think of this idea

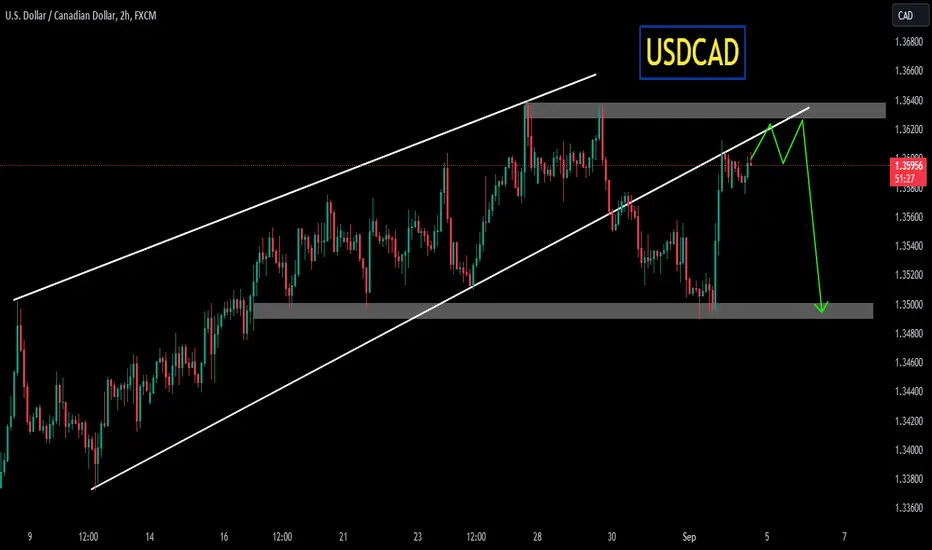
USDCADUSDCAD was trading in bullish parallel channel and then has given the break out from channel. Currently the price is retesting the broken levels and it seems like the bears will take control again and send the price even lower level.
What you guys think of this idea?
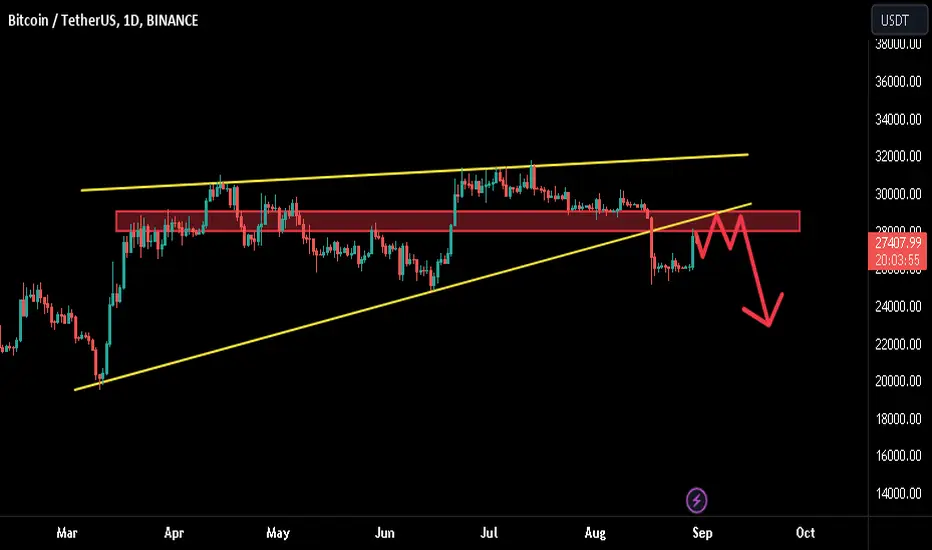
BTC QUICK UPDATE!!Hello everyone, if you like the idea, do not forget to support it with a like and follow.
Welcome to this quick BTC update. After the positive news of Grayscale's wins against the SEC, the market broke the long boring range. But the question is, is this enough to start a bullish rally? Let's find out....
As you see in the chart, BTC is forming a rising wedge-like structure in the daily time frame and it broke down. Now looks like it is going for a bearish retest.
We have a very strong resistance at the $28k- FWB:29K level. As of now price showing initial rejection from this level but in the short term we might see another test of this zone and after that real fall begins.
Overall the structure looks bearish. In the short term, we might see some greenery for a few days and after that another dump.
What do you think about this?
Share your views in the comment section.
If you like this idea then do support it with like and follow.
Thank You!
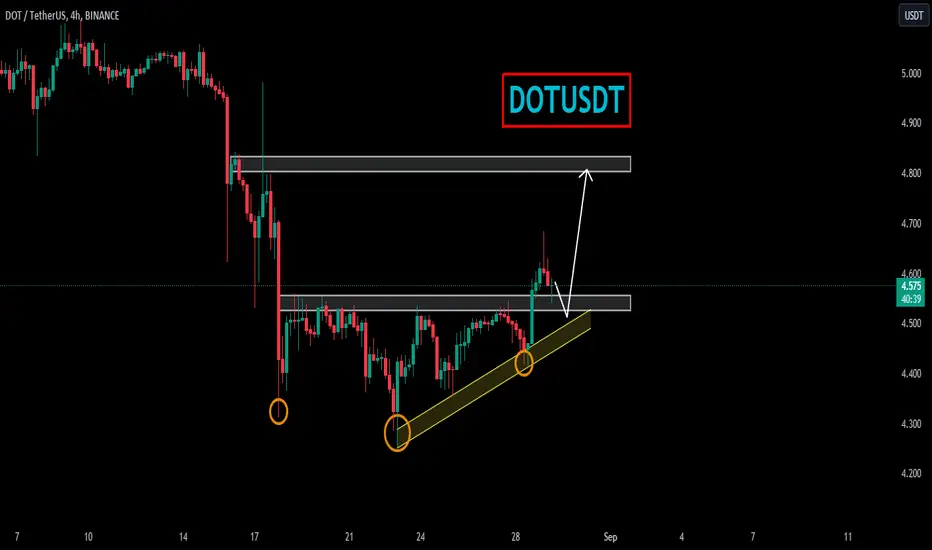
DOTUSDTA Bullish Movement May Happen Soon
DOTUSDT has formed inverted head and shoulder and break the neckline as well.
Currently the price is testing neckline and it seems like it is ready to fly.
Currently the price is maintaining bullish momentum as well.
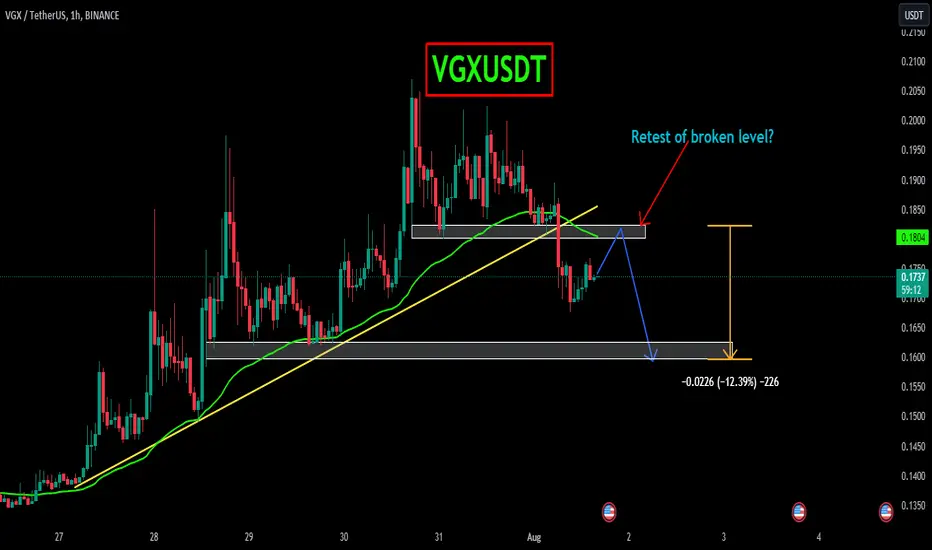
VGXUSDTVGXUSDT has broken very important support zone and currently retesting that support. As the price is under 50 EMA pressure it seems like after successful retest of broken structure price may head even lower.
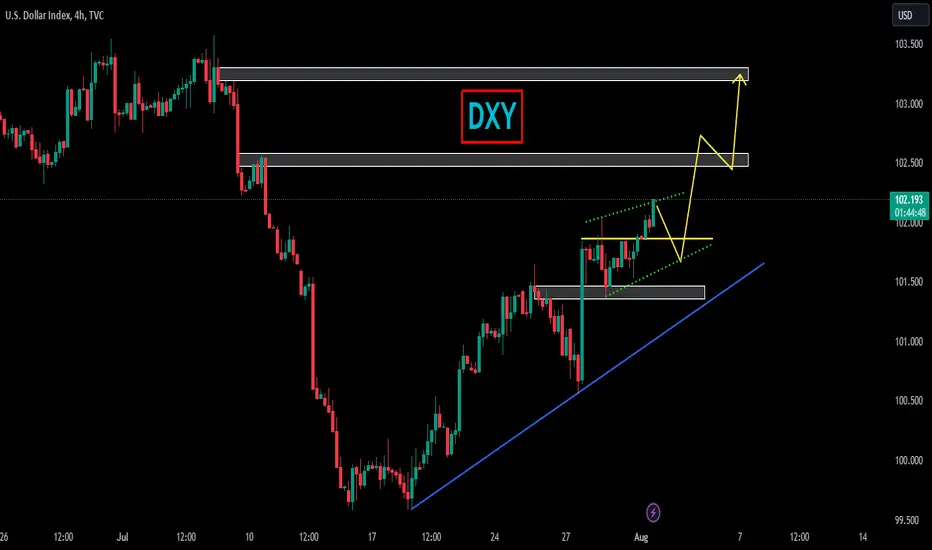
DXYDXY is looking in nice bullish momentum and continuously breaking through the major levels. Following the breakout retest pattern. Recently it break through 102 level. If it successfully retest this level it will be a nice bullish momentum.
Equal lows forming on Eurjpy Retest aka W pattern forming on Eurjpy. Orderblock retracement. FX:EURJPY

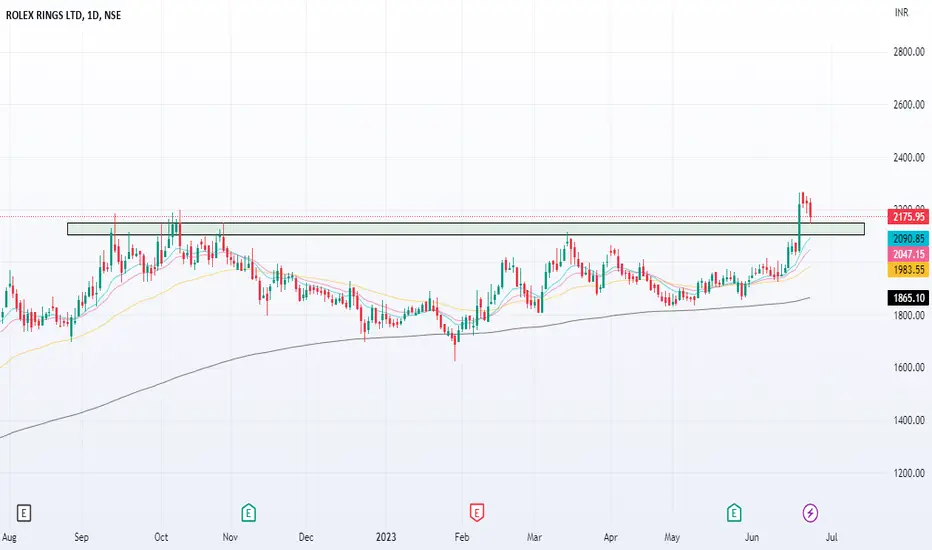
Rolex Rings Breakout retestRolex rings doing breakout retest attempt.
Will wait for a good candle to take confirmation and entry.
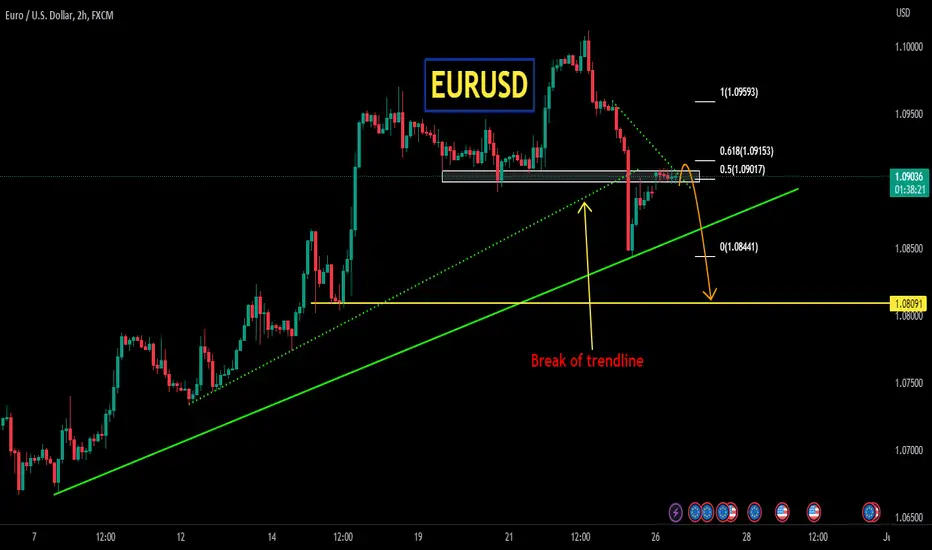
EURUSDEURUSD has broke through important support zone and one of the inclining trendline. and currently testing the broken support as a resistance around 1.0900 region. Will the pair hold bearish trend and move even lower?
USDJPY uptrend scalp to higher highThe daily closed bullish but with some buy exhaustion which led me to believe that there still some bullish momentum but not much. The 1H made a clear higher high and decided to hold at its lows but created some bullish reversal signals on top of support. The moving avergae plays as support as well. Upon the breach of a 30min correction trendline. I believe price is on its way back to test its high or create a new one. Afterall, this is an overall uptrend.
