Virgin Galactic - SPCE outlook showing signs of strengthLooking a the SPCE chart from a birds eye view it shows the company is overdue for a run. For months it's been trading sideways. It almost looks like it's break out of an inverse head and shoulders pattern. Until recently a spike caused by bullish news sending the stock from around 4.04 to 6.50.
On the run up it rejected the 6.50 price and came back mid day to the 4.50 level. The Fixed range volume profile showed from 4.04 to 6.50 on the initial the point of control was shifted to 6.50 where most volume was traded at the top. It showed a new level of support based on the visible range volume profile after it was rejected in the 4.81 - 4.63 range which to me was a buy zone. Even if it drops a little bit im okay with the risk to reward ratio with calls out to July 7th.
I wanted to get in it but I wasn't going to buy in at the top. The visible range volume profile showed me that most the volume came from these price levels. The fixed So I took the trade and look for a momentum run up in anticipation of the commercial flight between june 27th and june 30th.
The blue horizontal lines represent my take profit levels with the first retesting the 6.50 level. If price moves agressive I'm looking for it to close gaps from the prior months. The closer to launch date I can see it running up because people don't want to miss the run and a lot of buying pressure should be coming in up to these dates. Not to mention there's another flight shortly after in July I believe if there are no delays.
We will see how this plays out. My calls don't expire until July 7th after the first flight if there are no delays.
Thanks for taking the time out to read this.
Trade responsible,
Jay
#TradeTheWave
Retest-structure

USDJPY ceases to create lower lowsAfter an indecision pullback to retest a 4H bullish engulfing, I took a long position based on the higher high and retest of the 30MIN. I'm taking long positions based on the 23.6 retracement of the daily chart. I expect for price to continue to make higher highs as I believe this uptrend is still strong.

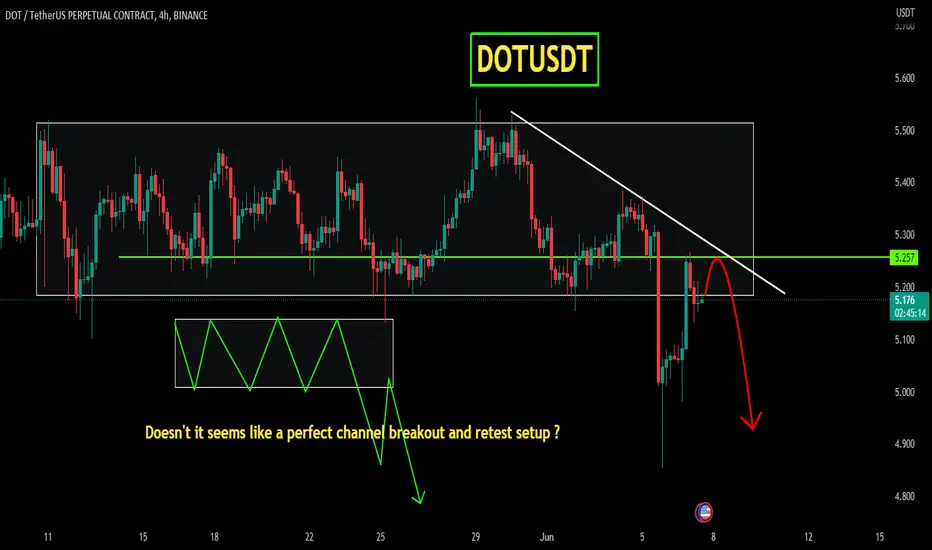
DOTUSDTDOTUSDT was trading in range from sometime , and recently broke through the range and now testing the broken level. It also facing the pressure from declining trendline.
Will it head even lower ?
Buying Ethereum once moreEthereum is on its journey of creating many higher highs along with bullish reversal candlesticks to initiate the move. The Daily has retraced to a key level on the daily chart. This is our first signal to go long. A morning star on top of structure and support. The 4H chart will inform us on whether price is still retracing bearish or if its time to get in long NOW.

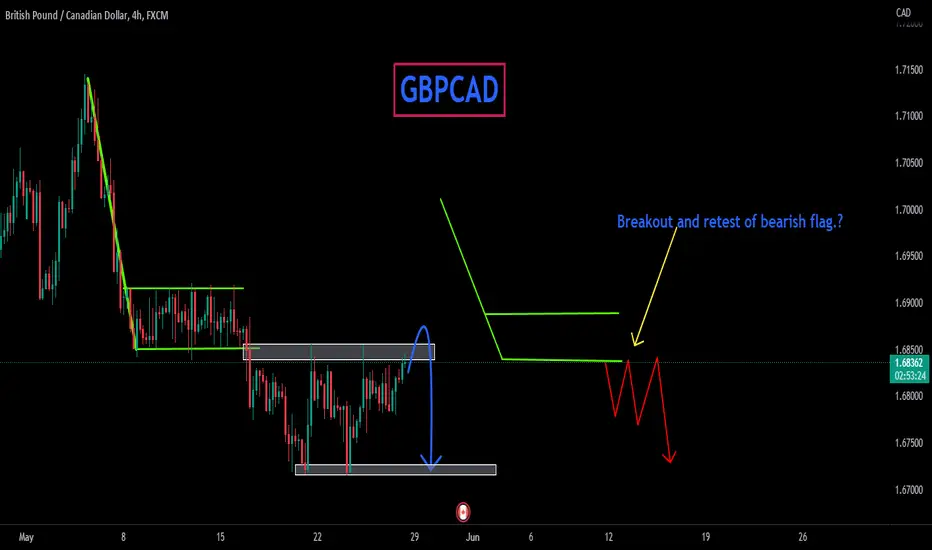
GBPCADGBPCAD recently form bearish flag pattern. And then break through flag , now retesting the broken flag. Will it continue its trajectory to downside?
Part 1 of catching a reversal is to trust structureI noticed that Ethereum was re-testing the neckline of an inverted head and shoulders pattern while at the bottom of a range and on top of support. Price provided an indecision candle on top of support as well as 61.8 fib. I anticipate that price will push back higher to retest a prz level. we have to get there first. It could begin with this purchase at a higher low.

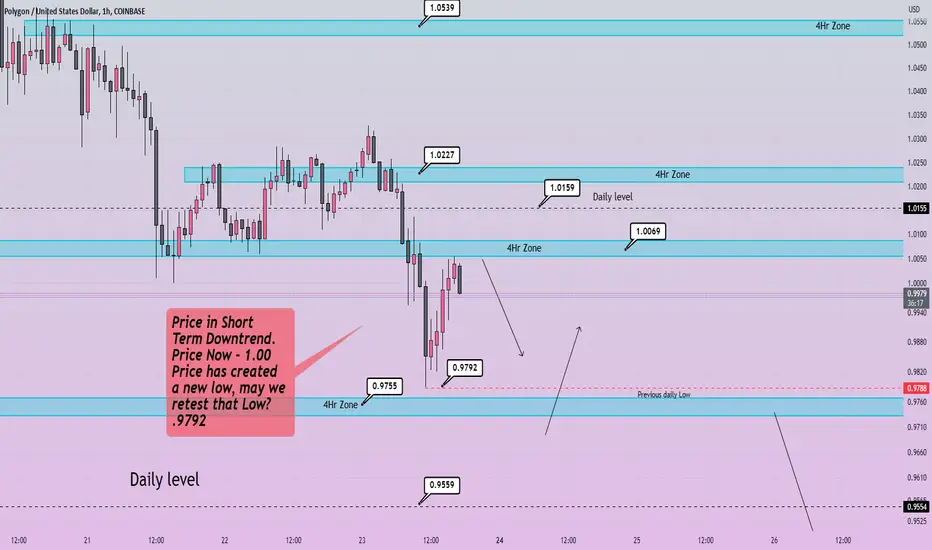
Matic 🛤️ Break + Retest 1.0069?Looks Like we can continue the Bearish momentum here back down to yesterday's low at .9792 and beyond to our next daily level at .9755.
Matic Polygon did a faekout yesterday above 1.0227. It returned back into the range, then to the bottom of the range then did a break and retest of the daily level on the 30m TF. Left a very large wick rejection and off we go onto the next zone at .9755. We have bounced but I can observe a retest of the low with momntum left over from earlier.
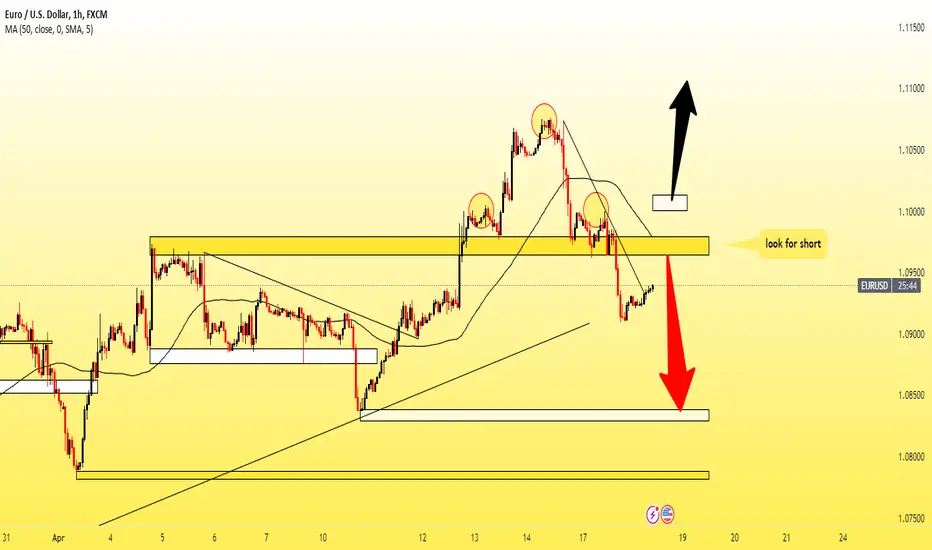
EURUSD H1Hello traders,
EURUSD is setting up for a downside move watch price to retest and look for a short position opportunity, if price break the yellow box and also 1.10000 area with the candle body then only look for long otherwise look for short.
This is just analysis, not the exact trade or any kind of signal that proven with wining or losing % so be sure trade with your own according strategy do not depend on my analysis.
I wish you good luck and good trading.
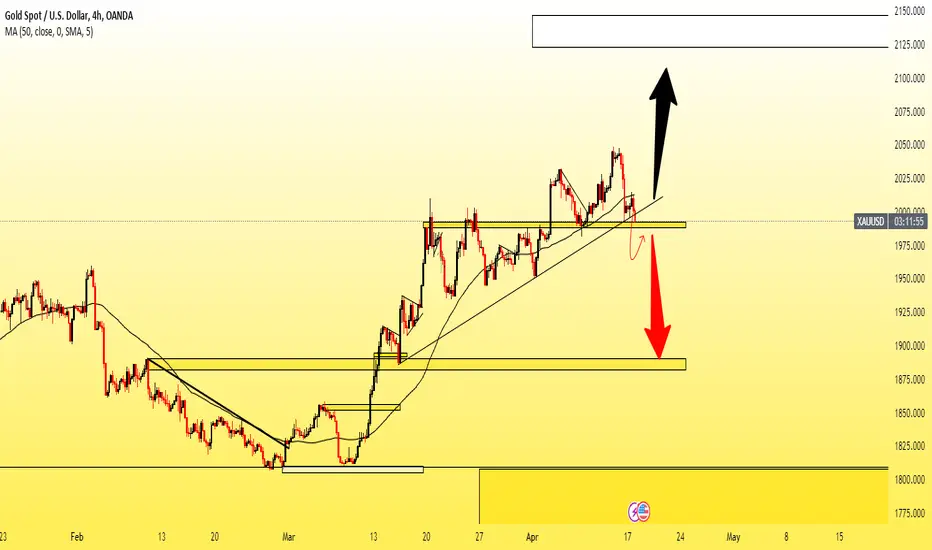
GOLD H4Hello traders,
watch GOLD to break the support wait for price retest and look for a short position opportunity, if price hold the support and didn't break watch price to break the 50 moving average and look for a long position opportunity.
This is my analysis and view about GOLD.
This is just analysis, not the exact trade or any kind of signal that proven with wining or losing % so be sure trade with your own according strategy do not depend on my analysis.
I wish you good luck and good trading.
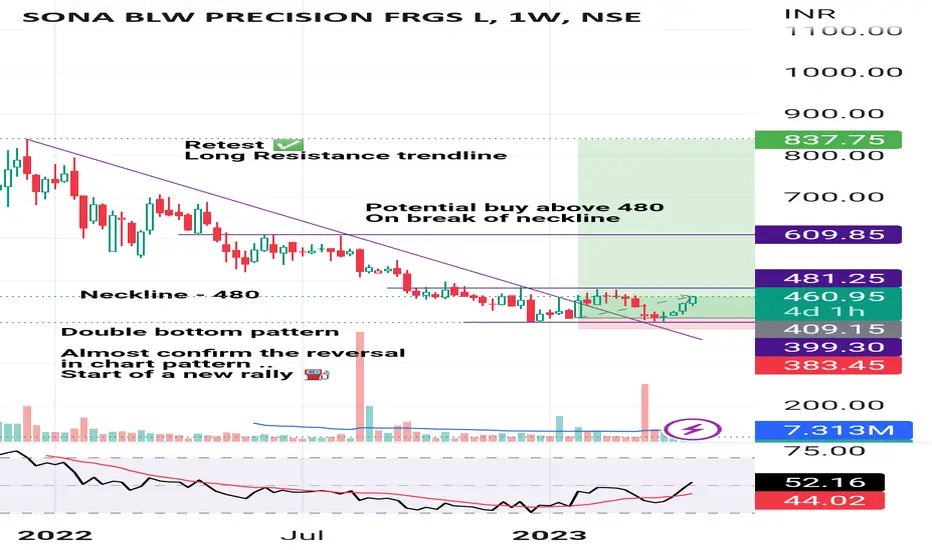
Potential stock SONA BLW
After fall from 840 to 400
The stock now seems to be prepared for a stronger upmove from here as the chart shows..
The fundamental of the company are somewhat okay but the shareholding changes in the recent years can't be ignored but to me chart is superior..
So buy above 480
TGT 620-700-ATH
SL can be placed at 390
Note: Do your analysis this is not any personal recommendation for the mentioned stock for buying or selling with me. It's just for educational purpose and backtesting .. also i have the share from very low levels 🚩
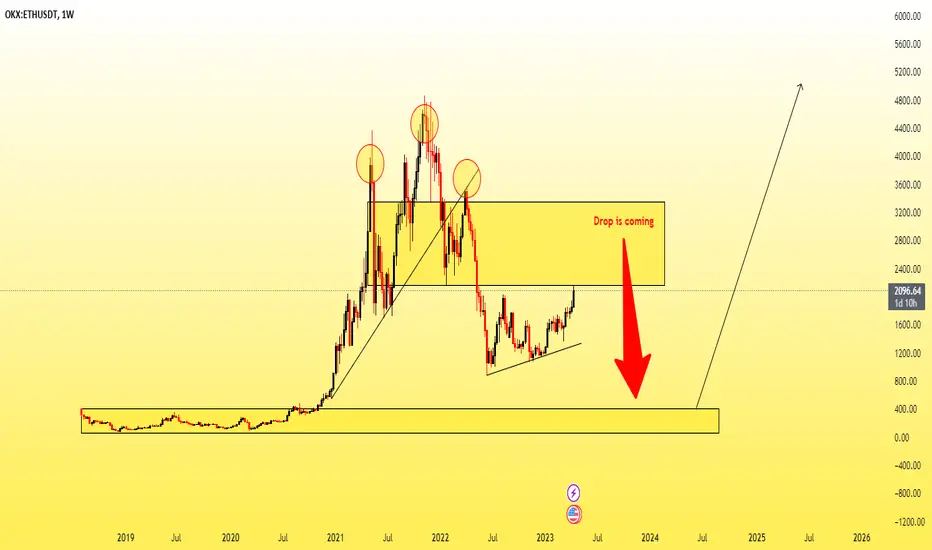
The Last Drop of ETHHello traders,
A one more drop is coming before creating a new high, ETH is setting up for a drop its showing me a lot of weakness on the weekly timeframe.
i am waiting for ethereum to drop and buy from the low price as much as possible, the price area that i am looking for is around 500 it will take time not a few days or few weeks analysis so patience is the key to succeed.
In the weekly timeframe price is formed head and shoulder pattern now price is going to retest that and drop from there, the area that i mentioned in the chart is around 500 to buy the ethereum for the long run, now ethereum is just going up and every one is wanted to enter in the market and try to make some profits but i am pretty much sure that this is going to be drop before creating a new high of all time and i am just basically waiting for that.
This is my analysis and view about ethereum.
This is just analysis, not the exact trade or any kind of signal that proven with wining or losing % so be sure trade with your own according strategy do not depend on my analysis.
I wish you good luck in trading.
GOLD H4Hello traders, GOLD is setting up for a potential upside move watch price to hold the 50 SMA and look for a long position opportunity, in case if price break the 50 SMA and also the yellow box resistance become support area then i will be looking GOLD for a long position opportunity around 1965 level.
This is just analysis, not the exact trade or any kind of signal that proven with wining or losing % so be sure trade with your own according strategy do not depend on my analysis.
I wish you good luck in trading.
USDCAD- Near HArmonic support USDCAD is in bearish trend.Support zone marked if USDCAD spend significant times on support then it can be a good buying zone.
If breaks short position can be opened on retest of support zone.
Plan both and then enter trade on confirmation in favour of trend.

Zen Technologies - Retest ✅After the strong breakout the stock has potentially completed the retest now moving forward:
CMP 290
TGT 340-350+
Sl Below 255 (Jarurat nhe padege par pherr b)
Note : Just an idea not any personal recommendation for the stock here just for education purpose.

Bitcoin at Triangle Pattern #Bitcoin 1hr. #TA at @binance
Right now as per 1 hour chart #BTC movement is slowly following #TrianglePattern and pattern will break soon on 13th March at 5:30 AM with 80% chance to Downtrend but 20% chance to $21.5k Can also retest..!

XRPUSDT : Bullish Flag Continue patternBINANCE:XRPUSDT
Hi , Trader's .. As you Can see Market is Trading In Bullish Flag pattern
price can touch support zone and can retest upper resistance level
breakout of upper trendline will make it bullish again
❤️ Please, support my work with follow ,share and like, thank you! ❤️

Gold Breaks Resistance, Tests Support at 1847 for Potential PopGold has recently broken through a key resistance level and is currently being tested as support near the 1847 level. With a potential drop in the USD on the horizon, this setup is looking bullish for gold. If the current support level holds, traders could see a rally back up to 1870 for this precious metal.

Zydus Life Science's: breakout retest Keep it on your radar!!! Zydus life science after giving a breakout can retest its support.

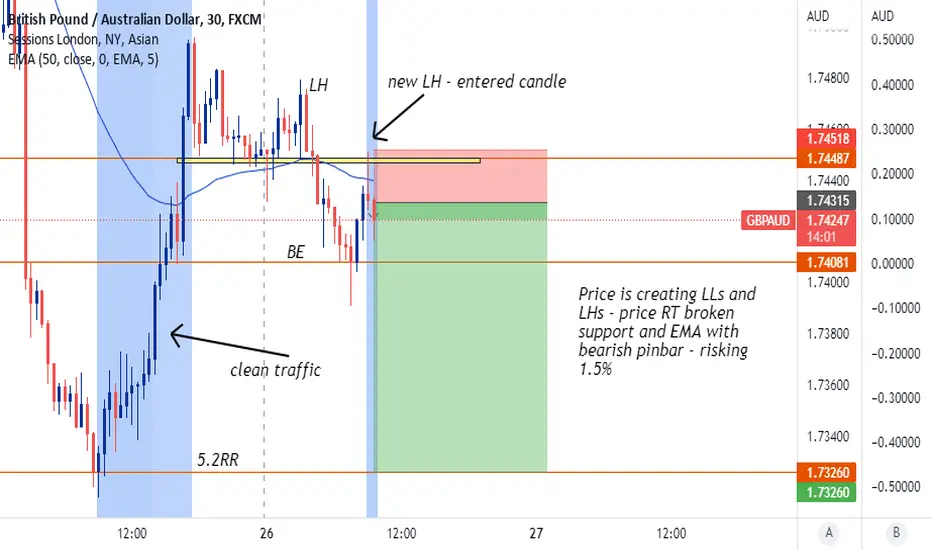
GBPAUD Short Opportunity - JANUARY RECAPExplanation within the post:
1.LLs and LHs
2.RT towards broken support level
3.EMA acting as added dynamic resistance and added confluence
4.Clean traffic to the left
5.Bearish pinbar which entered on close
5.2RR - will monitor P.A
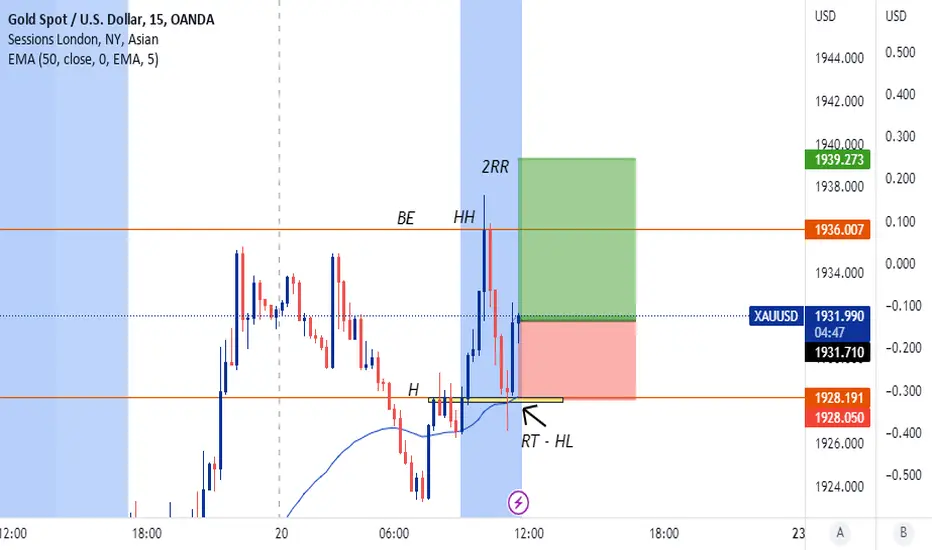
XAUUSD Long Opportunity - JANUARY RECAP
1.HH and HL
2.Price RT the broken R zone and formed a bullish engulfing candle (filled with momentum)
3.EMA holding as dynamic added support
4.Clean market structure and price action
5.RR2
Monitor P.A accordingly. Trade safe everyone !
AUDUSD I Scalp and intraday buy from supportWelcome back! Let me know your thoughts in the comments!
**AUDUSD Analysis - Listen to video!
We recommend that you keep this pair on your watchlist and enter when the entry criteria of your strategy is met.
Please support this idea with a LIKE and COMMENT if you find it useful and Click "Follow" on our profile if you'd like these trade ideas delivered straight to your email in the future.
Thanks for your continued support!

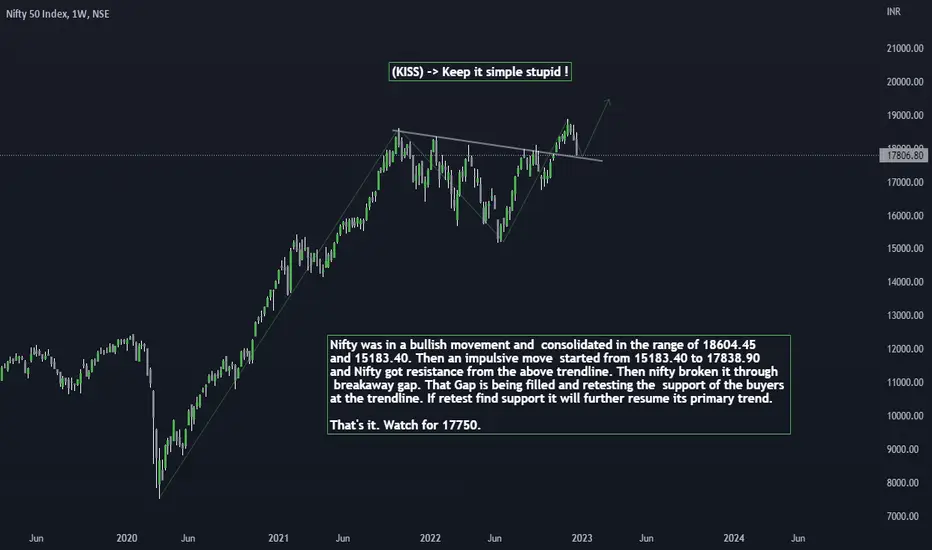
(KISS) -> Keep it simple stupid !Nifty was in a bullish movement and consolidated in the range of 18604.45
and 15183.40. Then an impulsive move started from 15183.40 to 17838.90
and Nifty got resistance from the above trendline. Then nifty broken it through
breakaway gap. That Gap is being filled and retesting the support of the buyers
at the trendline. If retest find support it will further resume its primary trend.
That's it. Watch for 17750.
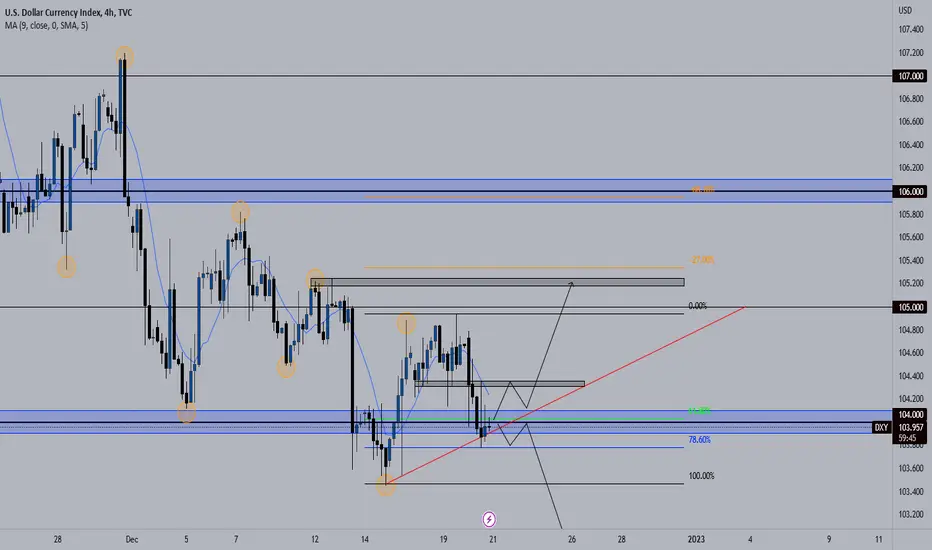
DXY TVC:DXY
English:DXY for me right now is at a point where I woulnd't enter yet. I would wait until it makes a clear move above or under the major level (104.00), wait for a retest and then enter when it gives me a clear candle.
Deutsch: DXY ist für mich gerade an einem Punkt, an dem ich noch nicht einsteigen würde. Ich würde warten, bis es eine klare Bewegung über oder unter das Hauptniveau (104,00) macht, auf einen erneuten Test warten und dann einsteigen, wenn es mir eine klare Kerze gibt.