4 Stages of Price Delivery (ICT Concepts)In this video I go through the 4 stages of price delivery as it pertains to ICT Concepts.
Generally, the market is going through either of the following:
Consolidation
Expansion
Retracement
Reversal
Price starts from a consolidation, where Smart Money accumulates their position, and then an expansion, where price is trending in a direction for the purpose of seeking liquidity and/or manipulating sentiment. From an expansionary phase, price will either retrace to re-accumulate orders and expand again, or have a complete reversal.
Now, it is important to note that price is fractal, meaning the signatures you see on a lower timeframe perspective could also be seen on a higher timeframe perspective. In a singular candlestick, there can be multiple phases of price delivery happening.
Once one can fit all these pieces together in regard to how market makers book price, one can have a clear insight into where price is likely going and where it likely won't go again, all with a high degree of accuracy.
Thanks for watching and reading!
- R2F
Reversal

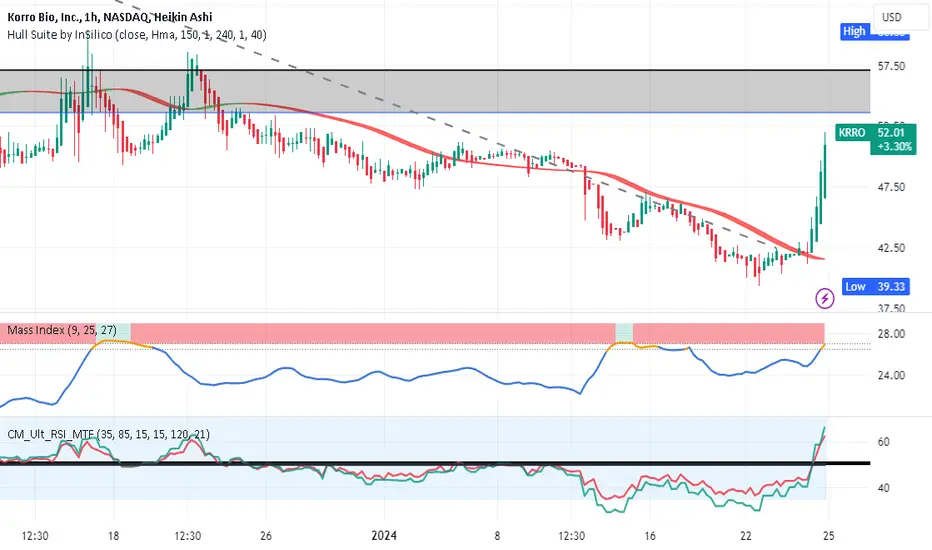
KRRO a biotech company with earnings coming LONGKRRO is in the biotechnology space in the gene-editing realm. It is in portfolios of C. Woods .
A recent analyst gave it an upside to 100 which is very favorable given its product line and track
record with an all-time high of about $250 ( which is about 450% over current valuation)
On the one-hour time frame, it has had a great week and is breaking out over its moving
averages as well as bullish momentum on the dual TF RSI indicator. This is a stock-long trade
in the biotechnology sector which is prognosticated to be among the best of 2024. The dramatic
reversal on the chart tells me this is a long entry. Targeting $57.5 in the short term and
$75.00 for most of the position in consideration of the analyst report.
Long Nasdaq Turtle soup from potential Low of weekSeasonally bullish July. HTF still bullish imo. Turtle soup long after deep sweep of Weds 3rd July low and after touching +bkr 4hr CE, and after reaching ABCD down projection. Ideally now i want hourly bodies to respect one of these levels, and us to get a lower timeframe break up in structure. If it keeps spooling down all day, then i'll take the loss.
-NQ has been very much weak sister for many days now, feels to me like it's time for it to start showing relative strength now and and become the stronger sister to ES.
-Seeing if we put in Low of week here in the opening hour, or later today.
-Buying around the ABCD downleg projection, and the +OB wick CE W
-Stop below +OBMT W and just below an old daily low (Tues 2nd July): Basically full exit/loss if we properly lose the +OBMT W below.
-Ultimate target is the nice 20600 ABCD confluence (ABCD projections align here from both the 2023-2024 swing and the June'24 swing). Gut says we have NOT properly topped in indices.
-Will take paritals at FVG H nearby overhead, and move stop for remaining position to breakeven.
-Will take further partials and trail stop if we breach ATH Nasdaq.
-Will take last of position off at the beautiful ABCD projection confluence 21600, if we get up there before early August.
-If this runs up, i'm willing to hold til the end of the month (Indices are seasonally bullish in July)
-For confirmation of shift back to bull in earnest, i want to see the FVG H above us 'flipped' bullish (resist, small retrace, then power on up through it)
*Note to self: i should really wait to enter after getting low timeframe confirmation of a bottom, but i'll be totally honest: i want the satisfaction of potentially catching the low of week; I accept the risk of price just spooling on down and stopping me out today.
**Just an idea for paper trading, not financial advice

USD/JPY - Expect Buyers above 156.78The Primary trend in the Dollar-Yen 4hrs timeframe is still Bullish, we can see a completed Bullish wave structure. If we apply the trending market truth it says the trend will not change easily. Also, a reversal is not a trend change.
What we can see is normal behaviour in a trending market, the price has become too high at the Momentum high (5), the buyers took profit and we saw a strong decline.
The play is to buy if the price trades above 156.78, this is the price point that confirms the last Bullish run.
The Minimum Target is 159.02.
Stop Loss is 156.05

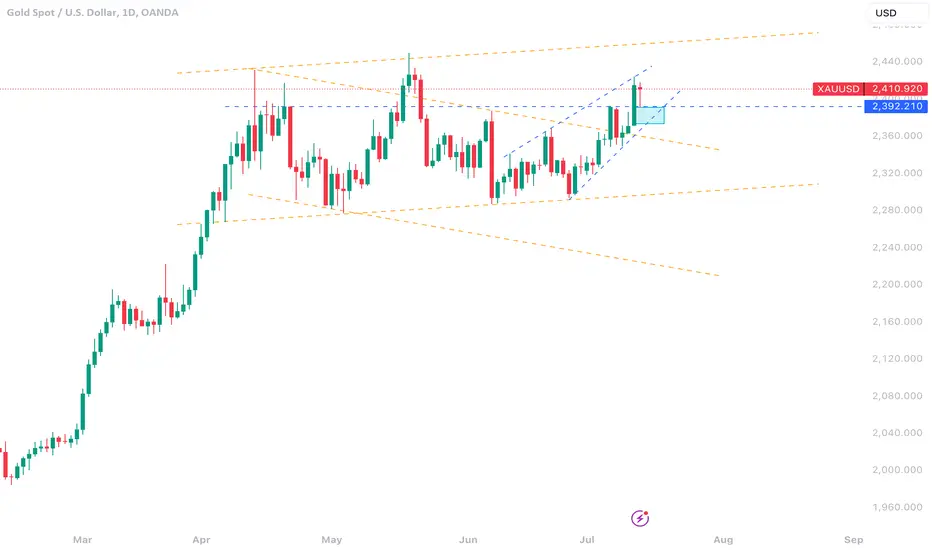
The Last Candle from the GOLD is the Hanging Man???Dear my Dragon Friends
i saw the closing candle at this week with time frame Daily is "Hanging Man", that was means by monday we can see the reversal pattern (going down) our watchlist for down side is 2380-85 for the support if break we can get big pattern with Rising Wedge and will be going to 2280-2300.
But if HOLD at this number 2380-85 we can see GOLD will Rise again and me Higher High will break all resistance and make new resistance again, may be 25XX...
For now and this week i will try to trade sell and i will Buy next week.
Lets See
Happy Trading
Disclaimer On
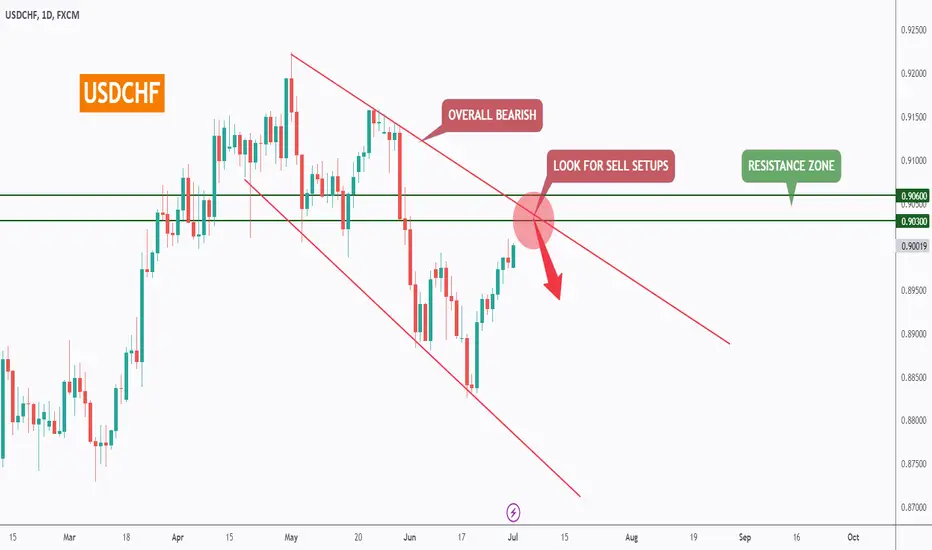
USDCHF - Follow The Trend!Hello TradingView Family / Fellow Traders. This is Richard, also known as theSignalyst.
📈 USDCHF has been overall bearish, trading within the falling wedge in red.
Currently, USDCHF is hovering around the upper bound of the wedge.
Moreover, it is retesting a resistance zone marked in green.
🏹 Thus, the highlighted red circle is a strong area to look for sell setups as it is the intersection of the green resistance and upper red trendline acting as a non-horizontal resistance.
📚 As per my trading style:
As #USDCHF approaches the red circle zone, I will be looking for bearish reversal setups (like a double top pattern, trendline break , and so on...)
📚 Always follow your trading plan regarding entry, risk management, and trade management.
Good luck!
All Strategies Are Good; If Managed Properly!
~Rich
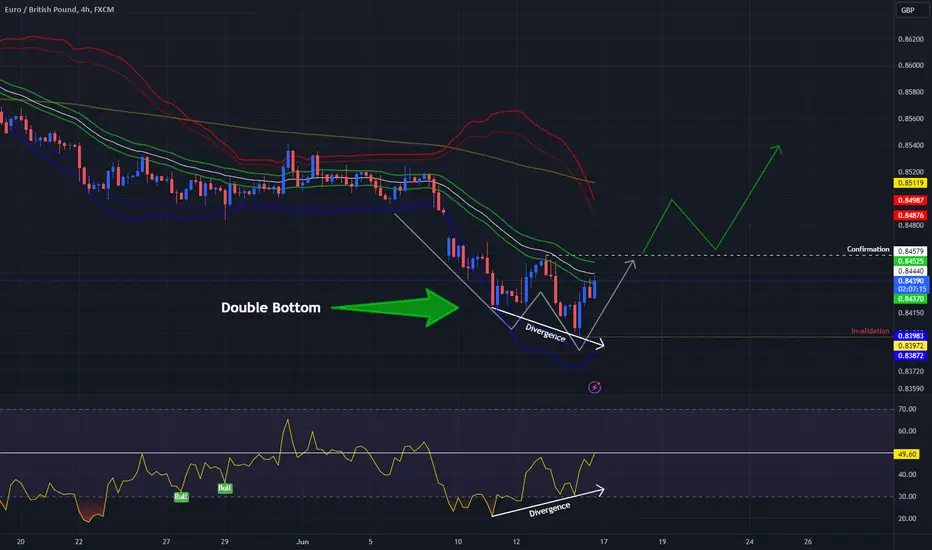
Potential Bullish Reversal! - EGHere I have EUR/GBP on the 4 Hr Chart!
Here we see Price has made 2 clear Lows ( Latter Lower than Previous Low ) with a High @ .84579
-Now to bring attention to the RSI Indicator, we can see Price is showing a different picture ( Latter Higher than Previous Low )
-We also have a Double Tap on the Lower Bollinger Bands
These events add up to what seems to be a Divergence taking place where Price has made its True Low and RSI indicates its no longer looking to go LOWER!!
Now for CONFIRMATION of this Potential Double Bottom Pattern, we NEED Price to Break and Close ABOVE the High @ .84579 and then to Re-test!
INVALIDATION of Pattern will come if Price decides to go Lower than our Low @ .83972
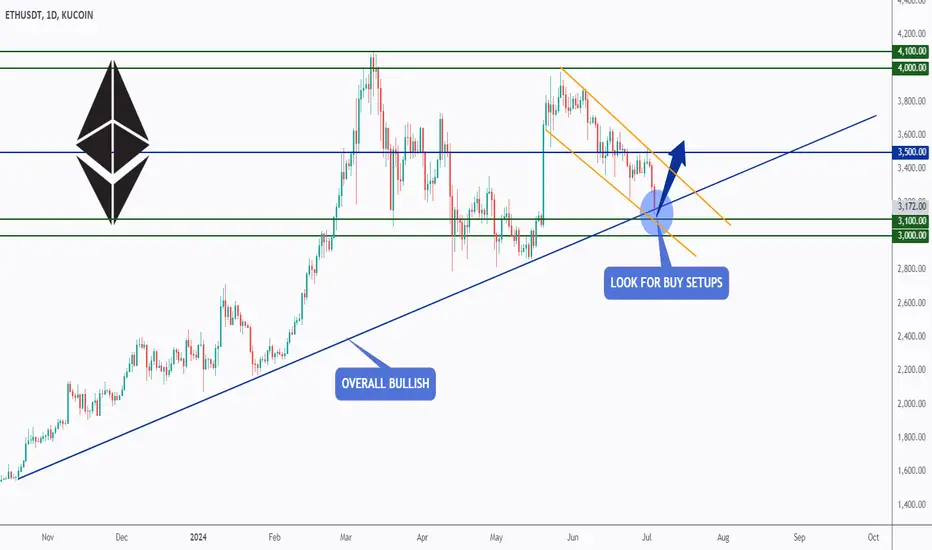
ETH - Next Bullish Impulse Soon?Hello TradingView Family / Fellow Traders. This is Richard, also known as theSignalyst.
📈 ETH has been overall bullish, trading above the rising trendline marked in blue.
Currently, ETH is undergoing a correction phase and approaching the lower orange and blue trendlines.
Moreover, it is retesting a strong support and demand zone marked in green.
🏹 Thus, the highlighted blue circle is a strong area to look for trend-following buy setups as it is the intersection of the green support zone and blue/orange trendlines acting as non-horizontal support.
📚 As per my trading style:
As #ETH is around the blue circle zone, I will be looking for bullish reversal setups (like a double bottom pattern, trendline break , and so on...)
📚 Always follow your trading plan regarding entry, risk management, and trade management.
Good luck!
All Strategies Are Good; If Managed Properly!
~Rich
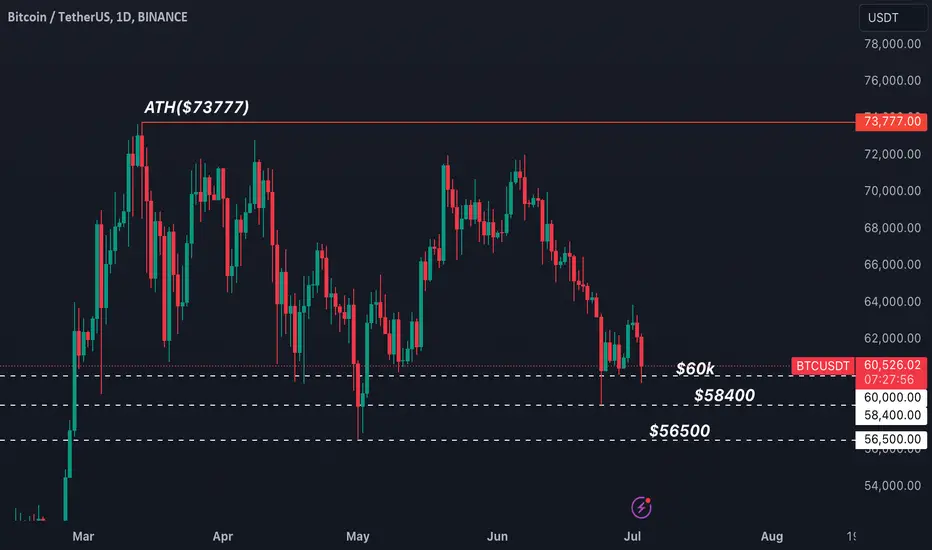
BTC support levels Bitcoin Analysis
There are 3 support levels
1. $60k
2. $58400
3. $56500
These are very crucial and important support levels for #BTC
From these levels we can see a reversal
Only very bad news can break these levels
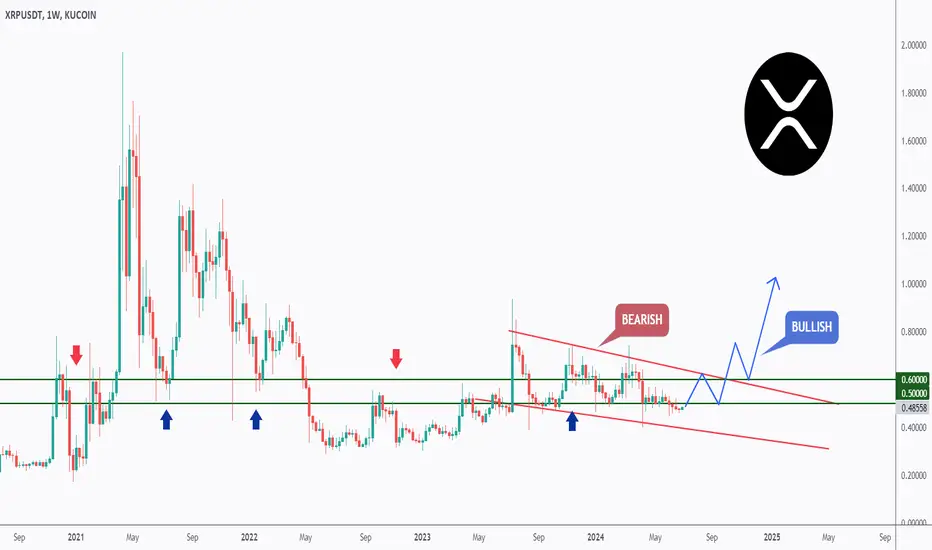
XRP - Shift in Momentum in Action!Hello TradingView Family / Fellow Traders. This is Richard, also known as theSignalyst.
📈 XRP has been overall bearish , trading within the flat falling wedge pattern in red.
Moreover, it is hovering within a massive weekly support zone $0.5 - $0.6.
🏹 For the bulls to take over from a long-term perspective, a break above the upper red trendline and $0.6 resistance level is needed.
📚 Always follow your trading plan regarding entry, risk management, and trade management.
Good luck!
All Strategies Are Good; If Managed Properly!
~Rich
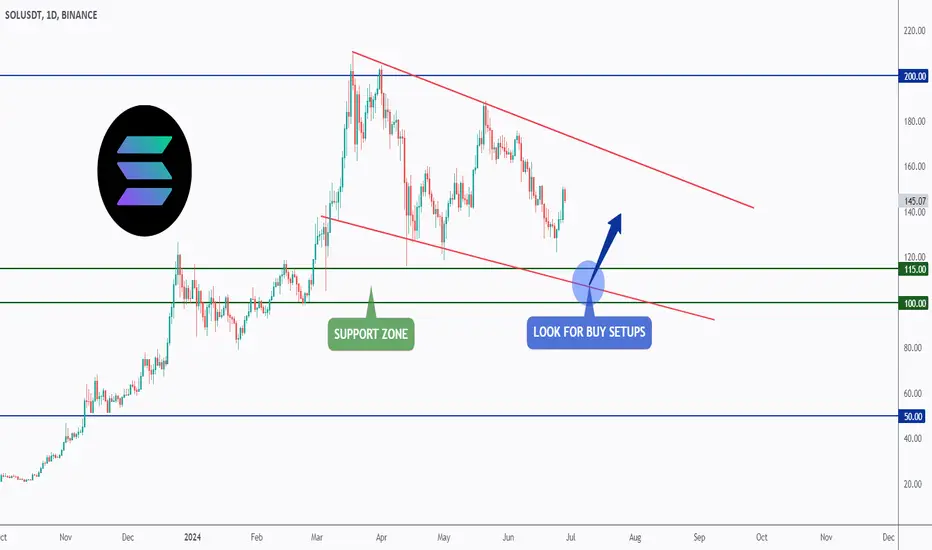
SOL - Wait for Solana's ETF!Hello TradingView Family / Fellow Traders. This is Richard, also known as theSignalyst.
📈 SOL has been bearish trading within the falling channel pattern marked in red.
Moreover, the $100-$115 is a strong support and demand zone.
🏹 Thus, the highlighted blue circle is a strong area to look for buy setups as it is the intersection of the green demand zone and lower red trendline acting as a non-horizontal support.
📚 As per my trading style:
As #SOLANA approaches the blue circle zone, I will be looking for bullish reversal setups (like a double bottom pattern, trendline break , and so on...)
📚 Always follow your trading plan regarding entry, risk management, and trade management.
Good luck!
All Strategies Are Good; If Managed Properly!
~Rich
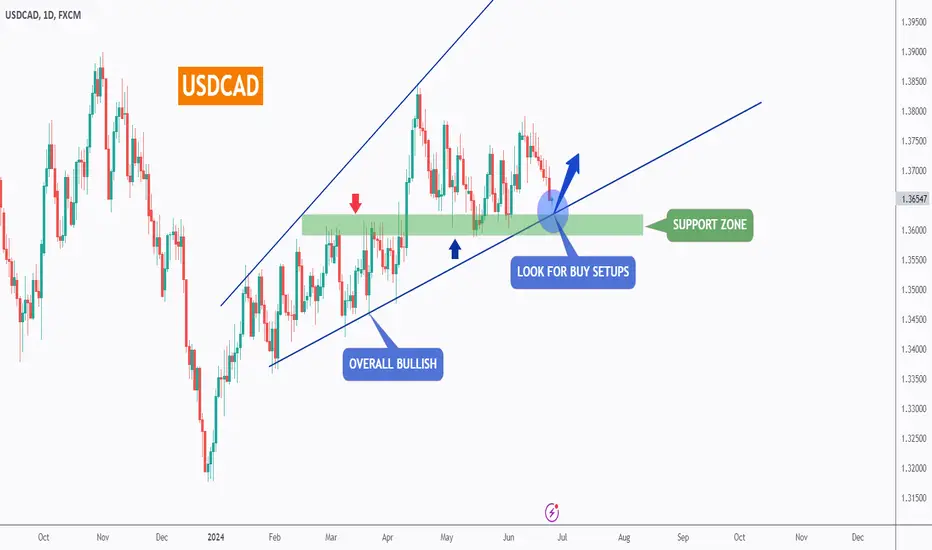
USDCAD - Next Bullish Impulse Soon!Hello TradingView Family / Fellow Traders. This is Richard, also known as theSignalyst.
📈 USDCAD has been overall bullish, trading within the rising wedge in blue.
Currently, USDCAD is undergoing a correction phase and it is currently approaching the lower bound of the wedge.
Moreover, it is retesting a strong support zone marked in green.
🏹 Thus, the highlighted blue circle is a strong area to look for trend-following buy setups as it is the intersection of the green support zone and lower blue trendline acting as a non-horizontal support.
📚 As per my trading style:
As #USDCAD approaches the blue circle zone, I will be looking for bullish reversal setups (like a double bottom pattern, trendline break , and so on...)
📚 Always follow your trading plan regarding entry, risk management, and trade management.
Good luck!
All Strategies Are Good; If Managed Properly!
~Rich
Weekly Analysis Part 2 - Daily Sessions/ Reversals- Forex
- Gold Analysis Session Reversals
- Zone and Volatility indications
- RSI14
- Consolidation and Patterns

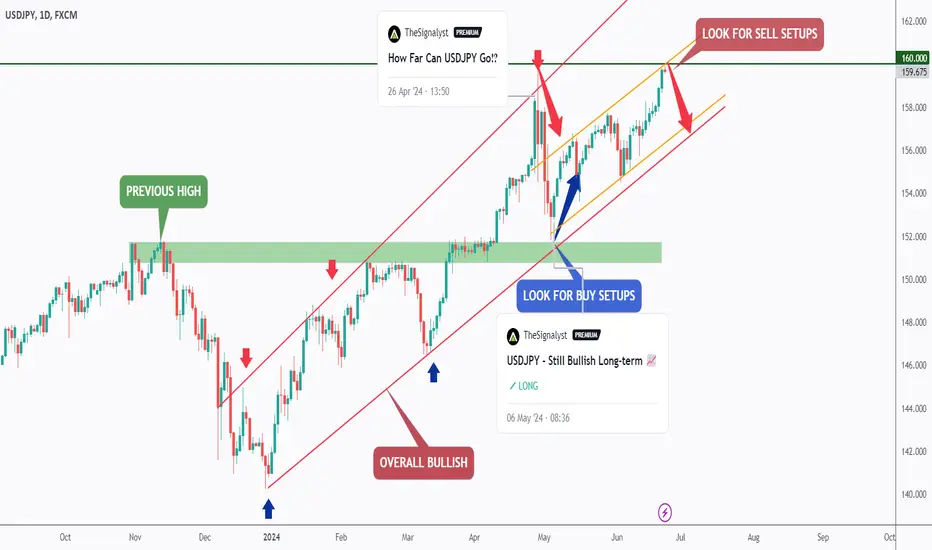
USDJPY - Bearish => Bullish => Bearish?Hello TradingView Family / Fellow Traders. This is Richard, also known as theSignalyst.
📈 As per my last two analysis (attached on the chart), USDJPY rejected the $160 resistance and traded lower, then rejected the lower trendlines and traded higher.
What's next?
USDJPY has been trading within a medium-term rising channel marked in orange. And currently, it is hovering around the upper bound of the channel.
Moreover, it is retesting the $160 resistance level again.
🏹 Thus, it is a strong area to look for sell setups as it is the intersection of the green resistance and upper orange trendline acting as a non-horizontal resistance.
📚 As per my trading style:
I will be looking for bearish reversal setups (like a double top pattern, trendline break , and so on...)
📚 Always follow your trading plan regarding entry, risk management, and trade management.
Good luck!
All Strategies Are Good; If Managed Properly!
~Rich
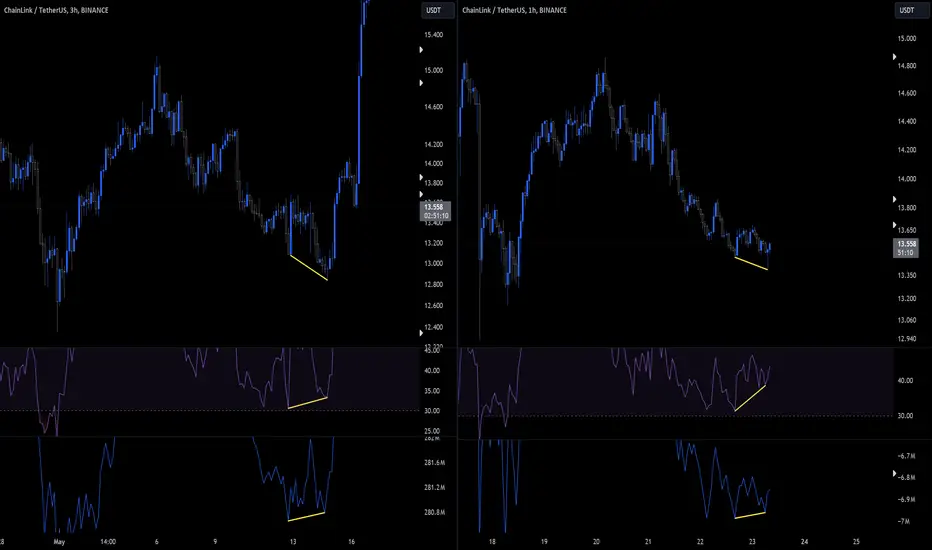
LINK - Bullish DivergencesBIST:LINK - Printing Multiple Bullish Divergences while reprinting a 2nd Wave Fractal
QQQ Thursday Gap Up ReversalShort-term & small sample, but an interesting pattern nonetheless...
If we look back at similar events to Thursday's action, they've all been short-term tops in the market. We're looking at: (1) Gap up open on a Thursday; (2) Bearish reversal closing near the lows of the day; (3) Increased Volume from the prior day(s); (4) Preceded by a good run in the market.
I think it's worth noting, although I'm not sure the market dynamic behind it, that these recent short-term tops have all occurred on a Thursday. So seeing similar-type action this past Thursday is sending up a short-term cautionary signal, especially after such a strong runup over the last few weeks. I want to emphasize 'short-term' though, because the long-term trend is still very much in tact. It may also be worth noting the lack of breadth under the hood as an additional short-term cautionary sign, although there are certain areas and groups that have been participating... it's been very much a stock picker's type of environment.

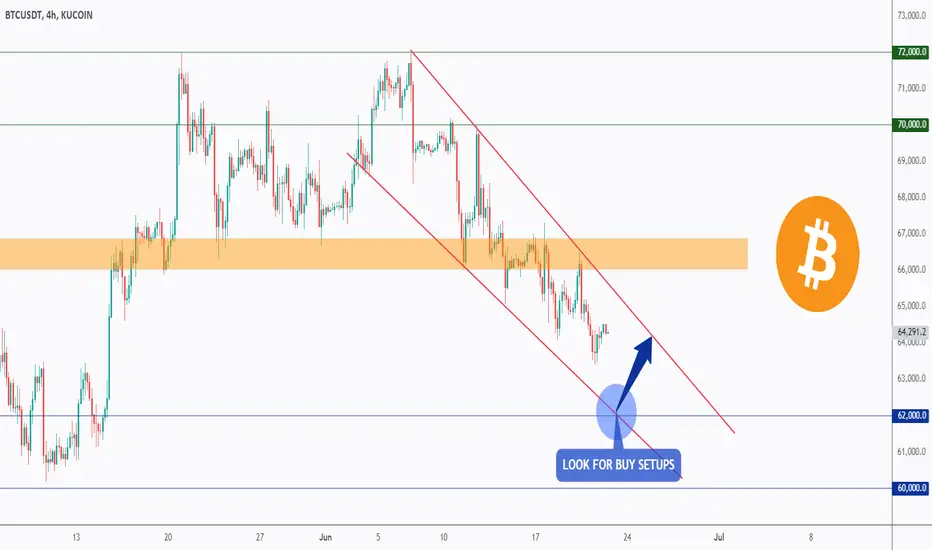
BTC - Wait For The Bulls!Hello TradingView Family / Fellow Traders. This is Richard, also known as theSignalyst.
📈 After breaking below the structure marked in orange, BTC has been bearish trading within the falling wedge pattern marked in red.
Currently, BTC is approaching the lower bound of the wedge.
Moreover, it is retesting a strong support zone $60,000 - $62,000..
🏹 Thus, the highlighted blue circle is a strong area to look for trend-following buy setups as it is the intersection of the blue support zone and lower red trendline acting as a non-horizontal support.
📚 As per my trading style:
As #BTC approaches the blue circle zone, I will be looking for bullish reversal setups (like a double bottom pattern, trendline break , and so on...)
📚 Always follow your trading plan regarding entry, risk management, and trade management.
Good luck!
All Strategies Are Good; If Managed Properly!
~Rich
Delta Corporation Trend Reversal Chances are HIGHin monthly TF delta corp is taking support from is monthy trend line and there is an event also which can be in favour of the company which is related to GST

Never bet against America - But it is time for a correction!Hello TradingView Family / Fellow Traders. This is Richard, also known as theSignalyst.
It is true that the legend Warren Buffett says: "Never bet against America"
But it is time for a correction in my opinion.
I find the daily chart for US500 to be interesting as it appears to be forming one of my favorite patterns. What I call TRIO RETEST
1️⃣ => Non-Horizontal Resistance
US500 has been overall bullish from a long-term perspective, trading within the rising channel in orange and currently hovering around the upper bound / orange trendline acting as a non-horizontal resistance.
2️⃣ => Overbought
From a medium-term perspective, US500 has been trading inside the rising channel in red, and it is currently hovering around its upper bound / red trendline acting as an over-bought zone.
3️⃣ => Round Number
Moreover, the $5,500 is a massive round number.
Thus, as long as the $5,500 mark holds, I expect a bearish correction towards the lower bound of the red channel.
📚 Always follow your trading plan regarding entry, risk management, and trade management.
Good luck!
All Strategies Are Good; If Managed Properly!
~Rich

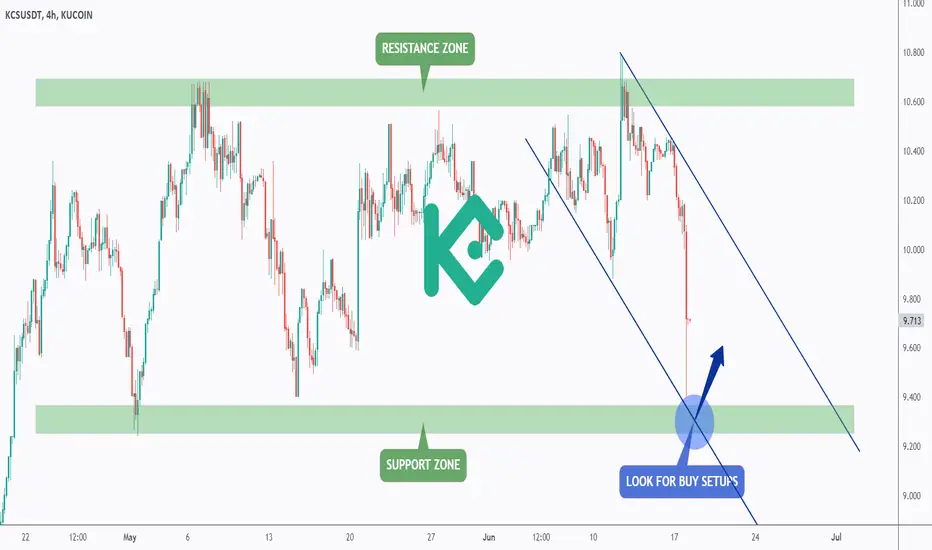
KCS - Strong Again!Hello TradingView Family / Fellow Traders. This is Richard, also known as theSignalyst.
📈 KCS has been overall bearish , trading within the falling channel in blue.
However, KCS is currently approaching the lower bound of the channel.
Moreover, it is retesting a strong support - the lower bound of its range.
🏹 Thus, the highlighted blue circle is a strong area to look for trend-following buy setups as it is the intersection of the green support and lower blue trendline acting as a non-horizontal support.
📚 As per my trading style:
As #KCS approaches the blue circle zone, I will be looking for bullish reversal setups (like a double bottom pattern, trendline break , and so on...)
📚 Always follow your trading plan regarding entry, risk management, and trade management.
Good luck!
All Strategies Are Good; If Managed Properly!
~Rich
GBPCHF - Already Over-Sold!Hello TradingView Family / Fellow Traders. This is Richard, also known as theSignalyst.
📈 GBPCHF has been overall bearish, trading within the falling channel in red.
However, GBPCHF is currently approaching the lower bound of the channel.
Moreover, it is retesting a strong demand zone marked in green.
🏹 Thus, the highlighted blue circle is a strong area to look for trend-following buy setups as it is the intersection of the green demand and lower red trendline acting as a non-horizontal support.
📚 As per my trading style:
As #GBPCHF approaches the blue circle zone, I will be looking for bullish reversal setups (like a double bottom pattern, trendline break , and so on...)
📚 Always follow your trading plan regarding entry, risk management, and trade management.
Good luck!
All Strategies Are Good; If Managed Properly!
~Rich

Possible nice upcoming shortterm rallye to the upside in CADCHFWatch out for a shortterm long entry after a sweep of this daily low.

SOL ( Solana ) - Time to Invest NowBINANCE:SOLUSDT (1W CHART) Technical Analysis Update
SOL is currently trading at $133 and recently had around 35% crash and currently trading around the support zone, if the price correction continues then we can expect the price to reach 110$ and in the worst case it can fall to 78$ range. We will keep our StopLoss below 78$
Entry level: $ 132
Stop Loss Level: $70
TakeProfit 1: $ 154.85
TakeProfit 2: $ 200.26
TakeProfit 3: $ 268.70
TakeProfit 4: $ 393.75
TakeProfit 5: $ 603.01
TakeProfit 6: $ 800.77
TakeProfit 7: $1000 <-- Peak of the bull run
Max Leverage: 2x
Position Size: 1% of capital
Remember to set your stop loss.
Follow our TradingView account for more technical analysis updates. | Like, share, and comment your thoughts.
Cheers
GreenCrypto
