UJ: “Reversal” & “BOBBI” Setup on “Momentum” Entry (28/100)System has identified two setups. A break out break back in, “BOBBI”, and a “Reversal” playbook setup along with “momentum” shift market entry during the third hour of the ASIA 12-Candle Window.
RISK: 2R
TARGET: 8R
***DISCLAIMER***
This is a new system based strategy being live tested for the purpose of gathering data. The system generates between 3-6 signals per session upon detecting a qualifying setup and entry signal. Currently being tested only in ASIA and only using USD/JPY pair. The win rate and expectancy are unknown. Please do not take these trades.
Reversal

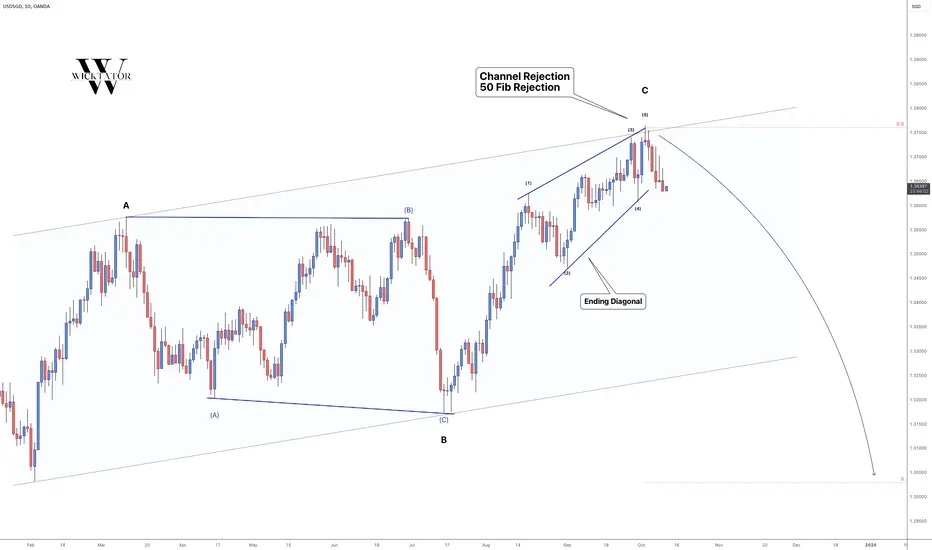
USDSGD - Text Book Reversal!USDSGD has recent topped with a beautiful rejection! We had the 50 fibonacci, channel AND an ending diagonal, all indicating a reversal!
Now that we've topped, we can look for any pullbacks to add a position for the massive drop.
Trade idea:
- Watch for pullback
- once pullback appears, look for a trendline break or structure rejection
- Enter with stops above the highs (above 50 fib)
- Targets: 1.305 (700pips), 1.27 (1000pips)
Goodluck and as always, trade safe!
AUD-NZD Buy Opportunity. 3+ R:R Reversal TradeWe are wedging down and losing momentum for a continued downside push. On the HTF we have major imbalances above and will require mitigation of supply in order to continue this downtrend.
Looking for a FVG mitigation below and to find support at 70% retracement fir upward push to break out of wedge
AUD-NZD Buy Opportunity. 3+ R:R Reversal

BTC - What Next ❗️📹Hello TradingView Family / Fellow Traders. This is Richard, also known as theSignalyst.
📈 Here is a detailed update top-down analysis for #BTC.
Which scenario do you think is more likely to happen? and Why?
📚 Always follow your trading plan regarding entry, risk management, and trade management.
Good Luck!.
All Strategies Are Good; If Managed Properly!
~Rich

Nifty Analysis for Trade Plan 1. Trend - Sideways
2. Price trading on the lower side of the support
3. 2 levels to pay attention to get directional move for momentum trading

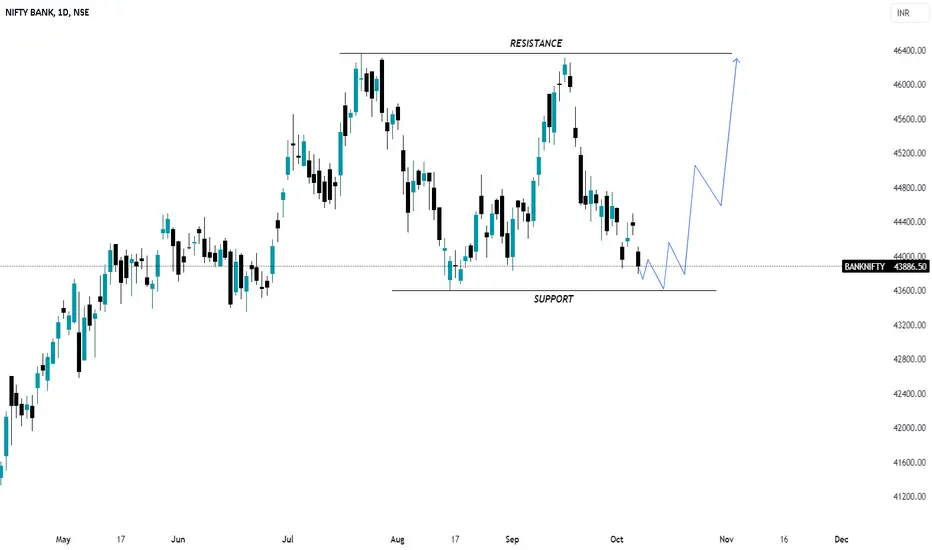
Banknifty Analysis for this week1. Trend - Sideways
2. Price Trading at support area
3. If this support breaks then view changes to short term bearishness
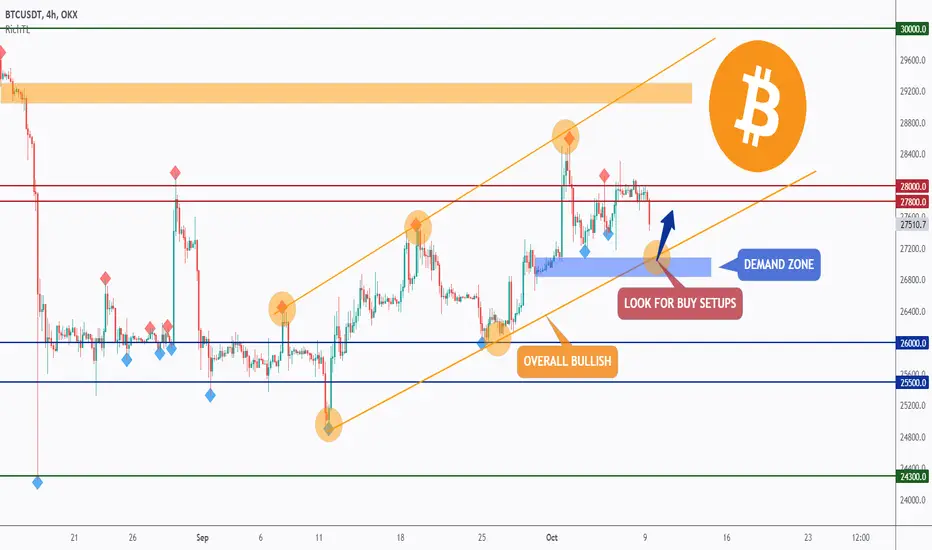
BTC - Wait For The Bulls ↗️Hello TradingView Family / Fellow Traders. This is Richard, also known as theSignalyst.
This week, BTC rejected the 28,000 resistance and is currently trading lower, so the bears are in control from a short-term perspective.
However, the overall bias is still bullish as BTC is still trading inside the rising channel in orange.
Moreover, the zone 27,000 is a demand zone.
🏹 So the highlighted orange circle is a strong area to look for trend-following buy setups as it is the intersection of the blue demand zone and lower orange trendline acting as a non-horizontal support.
As per my trading style:
As BTC approaches the lower orange circle zone, I will be looking for bullish reversal setups (like a double bottom pattern, trendline break , and so on...)
📚 Always follow your trading plan regarding entry, risk management, and trade management.
Good luck!
All Strategies Are Good; If Managed Properly!
~Rich
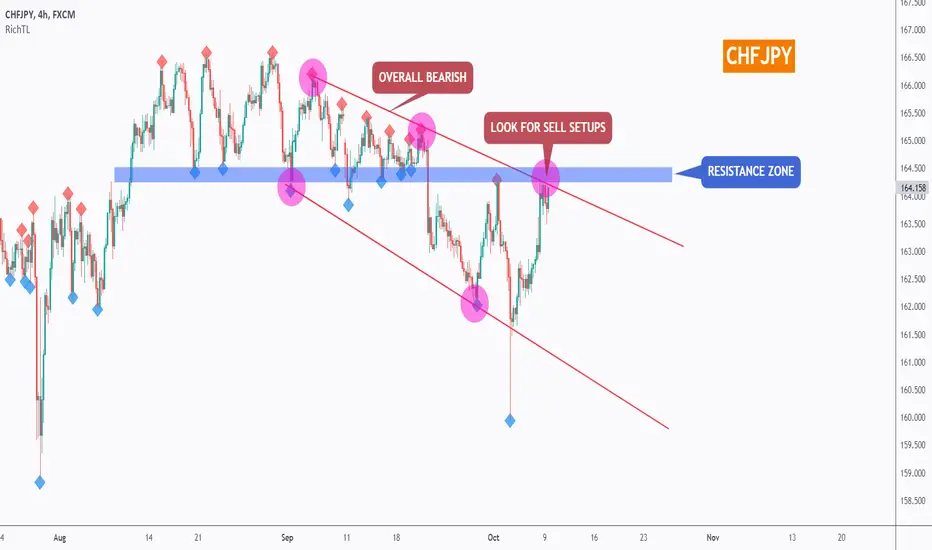
CHFJPY - Looking For Sell Setups ↘️Hello TradingView Family / Fellow Traders. This is Richard, also known as theSignalyst.
CHFJPY has been overall bearish trading inside the falling broadening wedge pattern in red, and it is currently approaching the upper trendline.
Moreover, the zone 164.5 is a resistance zone.
🏹 So the highlighted purple circle is a strong area to look for sell setups as it is the intersection of the blue resistance and upper red trendline.
As per my trading style:
As CHFJPY approaches the purple circle zone, I will be looking for bearish reversal setups (like a double top pattern, trendline break , and so on...)
📚 Always follow your trading plan regarding entry, risk management, and trade management.
Good luck!
All Strategies Are Good; If Managed Properly!
~Rich
AMD opening @ reversal zone with max dip ~97-98Watch AMD for a bounce at 97 on a market open fakeout.
I already alerted puts (bearish) @ 108 and the stock is already down -8%. That's a large gain in 3 days. Watch for key reversal. If it doesn't reverse, can see a lot of volatility.
Tagged the puts idea.
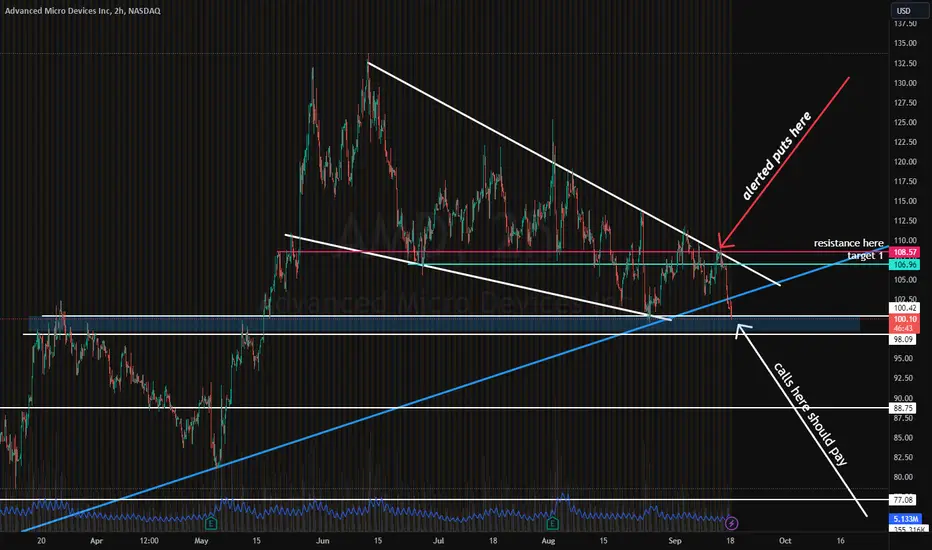
💯 AMD not a lot of sell pressure down here. Watch itFor a swing I'll try to get a good entry on AMD. I've been trading it up and down for 2 weeks now. See my ideas. At 108 I said it should get rejected and fall back to support. We are at 103.XX now. I ideally want 99-101 for a long entry but I don't think there's too much selling pressure here anymore.
Watch it above 104.60 for a breakout.
We all see the flag on AMD daily chart:
Follow and like this idea for more insights. Welcome to join my community! Thanks for reading.

NVDA opening @ reversal zone with max dip ~417Watch NVDA at this opening reversal zone. Potential to keep dipping to 417 on a market-open fakeout.
I will add more insight later. But watch this play.

AMD @ flag trendline & 200 SMA. Next major demand zone 85 to 88If you remember my post from earlier this/ last week, my max dip on NASDAQ:AMD short term was 96-97. This is exactly where we're opening today. Expecting a small reversal that which the strength of will wholly depend on CME_MINI:ES1! CME_MINI:NQ1! AMEX:SPY NASDAQ:QQQ
200 SMA bounces are usually very strong. When price starts heading below this SMA, you should start to be cautious. Of course, sometimes there's a mini fakeout under the SMA and right back up.
Watch this critical level here.

📈 AMD back @ flag's top trend. Watch for breakout/ rejectionJust a recap of this trade so far:
Posted this @ 108 calling for a bearish rejection.
After it failed to bounce from 101-103, I was certain it'd head over to 95-98, or the bottom TL at most.
When we hit the bottom TL, I called for a buy signal @ 95.
Will tag all these for proof.
Now we are at the top TL, which is the ultimate PT from 95. We hit this in 2 days. +10% in 2 days. That's right.
When you wait for swings to come to you, you will make the most money.
Here's the alert @ 95-96:
We waited a week or two for this perfect bounce. That's the best way to swing.
One way to swing is to buy, buy more, buy more, and buy some more. Another way, is to wait for the right moment and wait for the trade to come to you. If you miss it, you miss it. All good, there's tons of trades on the market.
NASDAQ:AMD NASDAQ:QQQ AMEX:SPY NASDAQ:TSLA NASDAQ:NVDA

TSLA watching for 255-253 again todayThis move is highly unsustainable for NASDAQ:QQQ - I called a bull run this morning @ 10 AM. We are up +2% almost on AMEX:SPY SP:SPX AMEX:DIA - watching for pull back now on buyer weakness and reality setting in.
But why TSLA? Why not NASDAQ:NVDA or NASDAQ:AMD ?
TSLA had "bad news" today
With a market pull back, TSLA will get smacked the hardest. Maybe even back to 250.
Risking $40 on 0dte to potentially make $200. High R/R.
I ran out of minds so posting here.

2.5% pump in 2 hours with no dips? Sustainable?Don't chase. A pull back can be violent. Better off getting puts for a daytrade than chasing calls here. Good luck. Trade carefully.

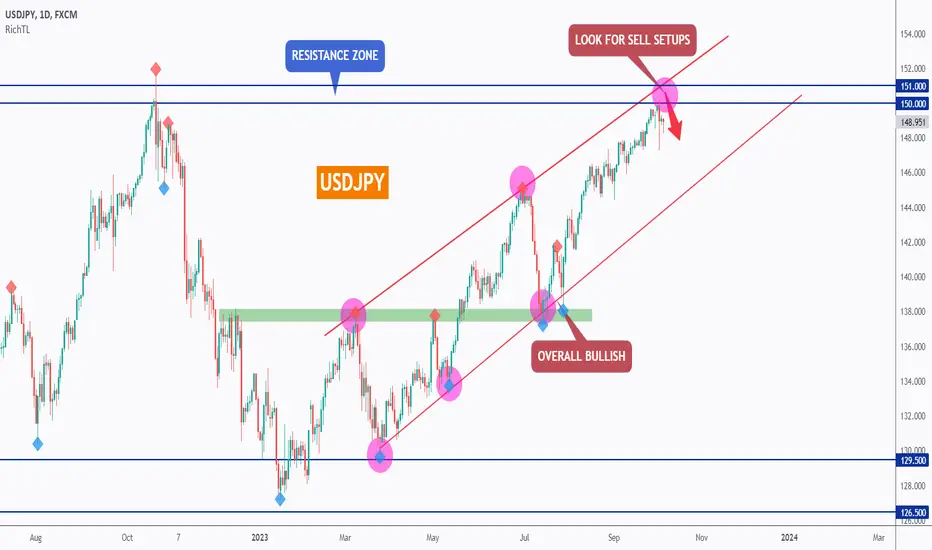
USDJPY - Getting Over-Bought ❗️ AgainHello TradingView Family / Fellow Traders. This is Richard, also known as theSignalyst.
USDJPY has been overall bullish trading inside the rising broadening wedge pattern in red, however it is currently approaching around the upper trendline.
Moreover, the zone 150.0 is a resistance zone and strong round number.
🏹 So the highlighted purple circle is a strong area to look for sell setups as it is the intersection of the blue resistance and upper red trendline.
As per my trading style:
As USDJPY approaches the purple circle zone, I will be looking for bearish reversal setups (like a double top pattern, trendline break , and so on...)
📚 Always follow your trading plan regarding entry, risk management, and trade management.
Good luck!
All Strategies Are Good; If Managed Properly!
~Rich
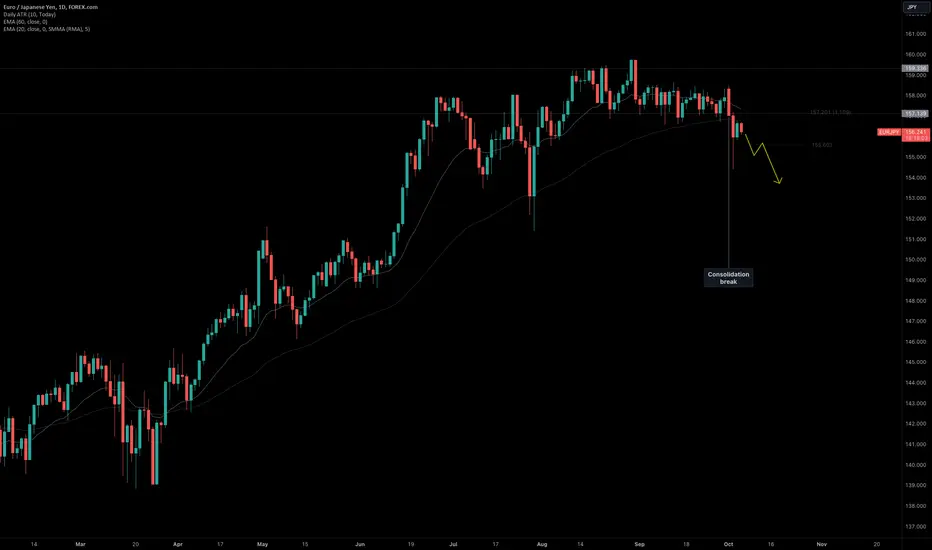
EURJPY Continuation PlayEURJPY has been trading in a range between 157.139 and 159.336 since early August. Earlier this week, price finally broke below the lower range boundary and it looks like price will remain below it.
I currently have a bearish sentiment. Although price may take a pause post-breakout, I anticipate continuation to the downside will remain likely as this reversal is underway.
USDCHF Reverses After Double-TopPrice made the original high on September 27th. A few days later, a retest of the high occurred on October 3rd.
After today's New York close, price continues to push to the downside. As long as price holds below the labelled neckline at 0.91492, I believe we can expect a bearish outlook.

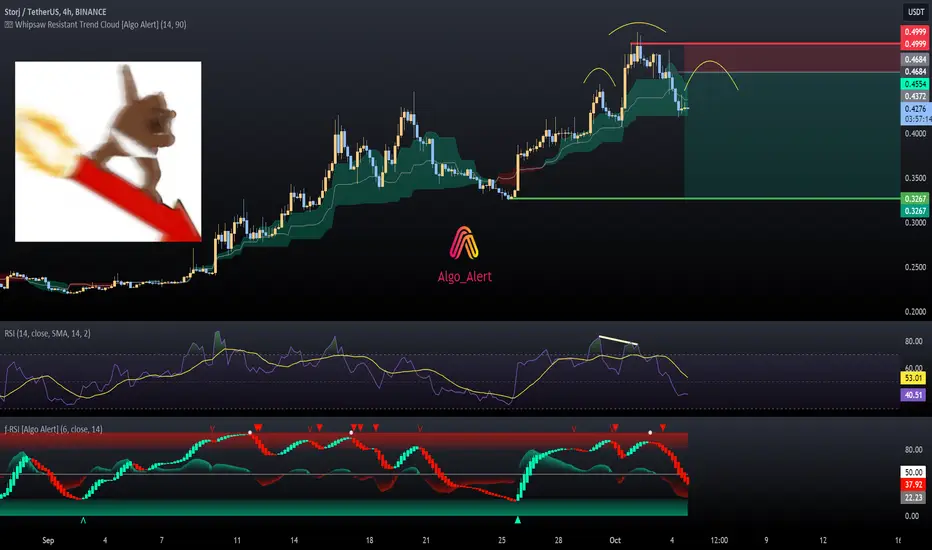
Bearish set-up on STORJUSDTReasons for short:
- Head and Shoulders formation
- Bearish Divergence on RSI
- Bearish reversal signal on FRSI
- Price crossed below the whipsaw-resistant trend cloud signalling the beginning of a potential downtrend
Levels:
Entry - $0.4687
Take Profit - $0.3267
Stop Loss - $0.4999
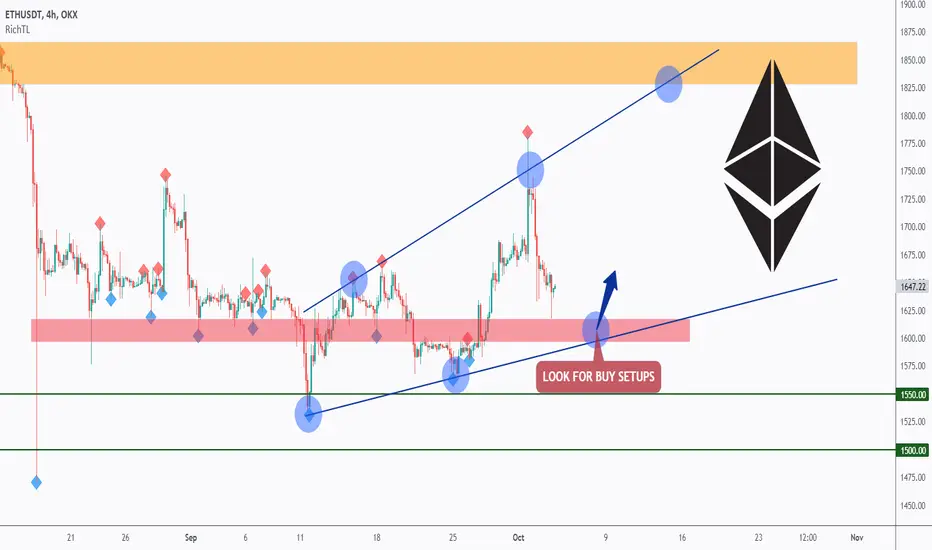
ETH - Longing For One More Impulse ↗️Hello TradingView Family / Fellow Traders. This is Richard, also known as theSignalyst.
After rejecting the 1500.0 support zone, ETH has been overall bullish trading inside the rising wedge in blue, and it is currently approaching the lower bound of the wedge.
Moreover, the zone 1600.0 is a support zone.
🏹 So the highlighted blue circle is a strong area to look for trend-following buy setups as it is the intersection of the red support and lower blue trendline acting as a non-horizontal support.
As per my trading style:
As ETH approaches the lower blue circle zone, I will be looking for bullish reversal setups (like a double bottom pattern, trendline break , and so on...)
📚 Always follow your trading plan regarding entry, risk management, and trade management.
Good luck!
All Strategies Are Good; If Managed Properly!
~Rich
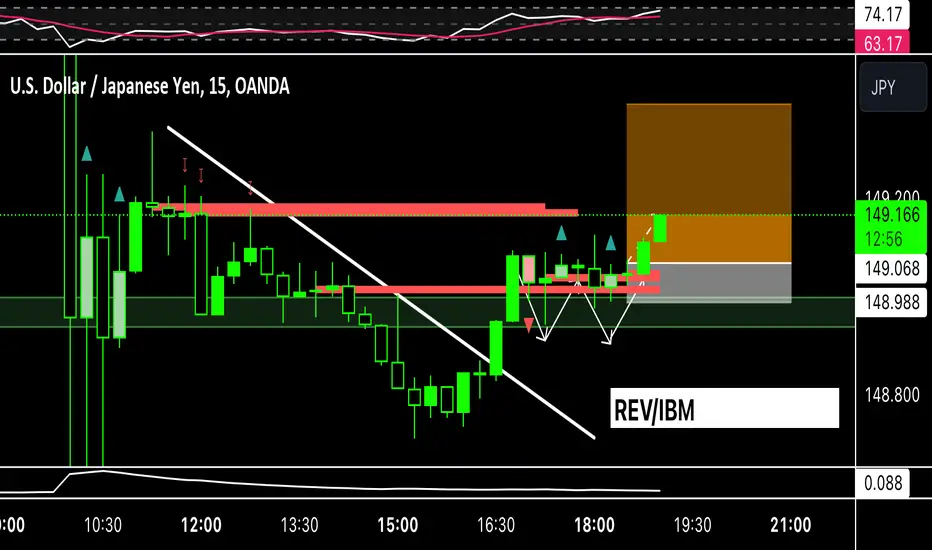
UJ: “Reversal” Setup on “IBM” Entry (10/100)System has identified a “REV” playbook setup and a potential “inside bar momentum” shift market entry during pre-market of the ASIA 12-Candle Window.
RISK: 1R
TARGET: 4R
***DISCLAIMER***
This is a new system based strategy being live tested for the purpose of gathering data. The system generates between 3-6 signals per session upon detecting a qualifying setup and entry signal. Currently being tested only in ASIA and only using USD/JPY pair. The win rate and expectancy are unknown. Please do not take these trades.
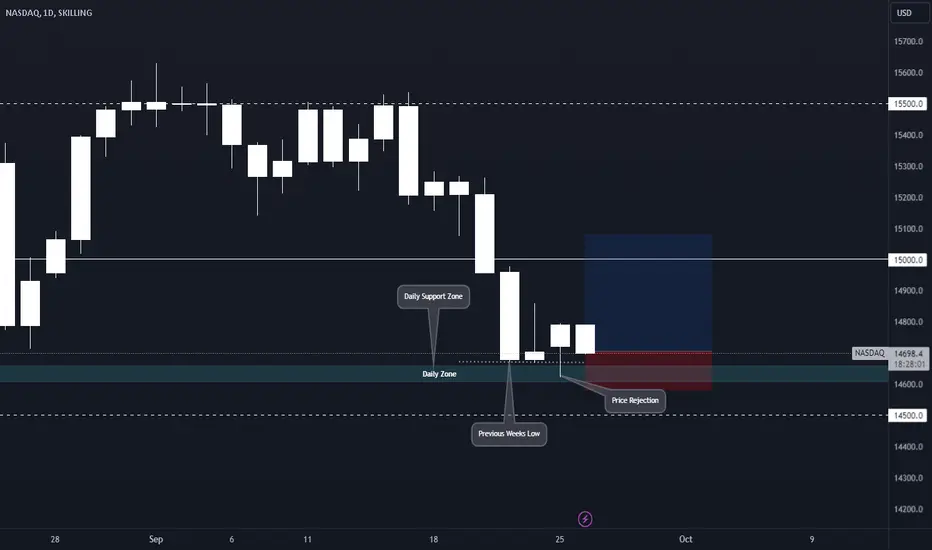
Nas100 Daily Support Zone BullishNas100 is at a daily support zone
Its just above previous weeks low.
Price looks to have rejected Daily Zone.
Stop Below possible low of week.
Island reversal pattern forming for Home Depot?Island reversal pattern forming for Home Depot NYSE:HD ?
Started in Feb 22 almost a year ago after earnings report.
If it completes, exceeding 339, then it will be a bullish reversal and 400-420 will be in play. So for next earnings it's possible that price will gap higher. Still watching though.
This is not advice. Do your own research and trade your own plan!!
