BTC - Market Structure 101!Hello TradingView Family / Fellow Traders. This is Richard, also known as theSignalyst.
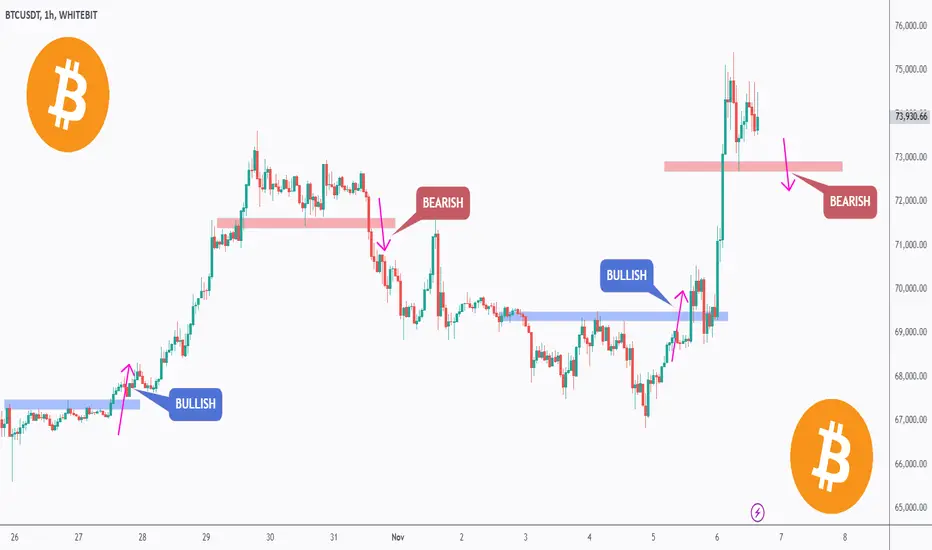
The BTC market structure has been very clean lately, which I find interesting.
📉Previously, after breaking below the last major lows (marked in red), BTC dipped.
📈Similarly, after breaking above the last major highs (marked in blue), BTC surged.
🔄If history repeats itself, and the current last major low marked in red is broken to the downside, we can expect another dip in BTC towards the $69,000 - $70,000 demand zone.
Meanwhile, as long as the current minor low in red holds, BTC would be overall bullish short-term and further upside is expected.
🕝What do you think?
📚 Always follow your trading plan regarding entry, risk management, and trade management.
Good luck!
All Strategies Are Good; If Managed Properly!
~Rich
Reversal
Dogecoin Primed For Liftoff?! Here I have COINBASE:DOGEUSD on Daily & 1Hr Chart!
A lot of Bullish signs are popping up on all Time-Frames for $DOGEUSD! Let's lay it out:
Daily Chart-
*Price made its Lowest Low @ .0805
*Price has created a Bullish Divergence on the RSI when price was able to make a Higher High @ .1321, disrupting the Downtrend Pattern.
*Fib Retracement Tool from the Lowest Low to Higher High places the Golden Ratio Zone @ ( .1033 - .1002 ) where Price has already Retraced to and is showing Exhaustion from the Bears!
1Hr Chart-
*Zooming into the Golden Ratio Zone, we see Price is exhibiting signs of a Bullish Wedge, potentially in the Reversal Variation!
*Lower Lows on Price creating Bullish Divergence with Higher Lows on RSI
I suspect we will see Price give us a Bullish Break to this Wedge and continue creating Higher Highs/Higher Lows continuing the Uptrend which will then contend with the Resistance Levels:
( .1355 - .1440 )
( .1700 - .1800 )
( .1990 - .2200 )
**If Price gives us a Bearish Break to the Wedge, Be Vigilant to False Breaks testing the .09 cent Support Level & Rising Support

cup and handle bull cypher fadingtheres no reason to this this stock will climb for many days without a contraction and consolidation period toward the volume area labled with dots in center. this is to bear in mind that the current pattern is very bullish on lower time frames, but ahowing signs of being highly overbought. im going to short this knowing that volatility is rising and the sell zone has been hit multiple times.

Gold- Where is the next 1k pips trade?As I've outlined in both written and video analyses on FOREXCOM:XAUUSD , I’m anticipating a substantial pullback in gold prices.
Let’s look at this objectively: just as trees don't grow to the sky, neither does Gold.
With a remarkable 2,000-pip rally over the last 20 days, the likelihood of a meaningful retracement is increasing.
Each new high reached only makes a sharper pullback more probable.
That said, I’m not rigidly fixed on one outlook.
In yesterday’s analysis, I noted that a new all-time high seemed highly probable.
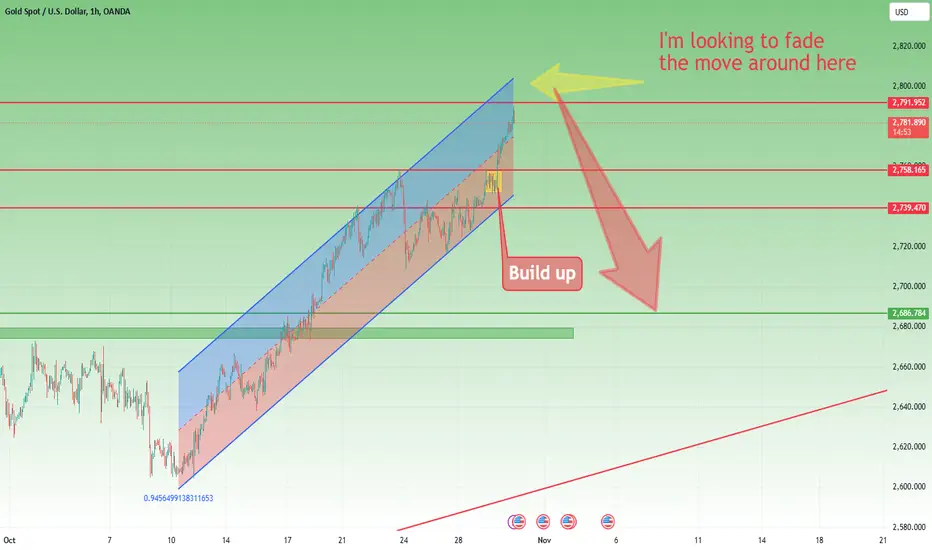
Acting on this, I opened a small long position after observing a buildup consolidation just under the previous ATH, which I closed at 2770.
The key question now isn’t whether gold will start pulling back, but rather where that pullback will begin.
On the 1-hour chart, since the low near 2600 on October 10th, Gold has been trading within an ascending channel.
Each time the price touches the upper boundary of this channel, it has reversed back down. Based on this behavior, I anticipate a similar reaction if gold approaches or slightly exceeds 2800, and I plan to fade any move above that level.
In conclusion, for those looking at potential 1,000-pip opportunities, I believe the short side currently holds more promise. In the short term, a retracement toward 2700 seems more realistic than an extension to 2900.
P.S: Looking at previous times when Gold has made ATHs, the reversal from the top has been more than 1000 pips.
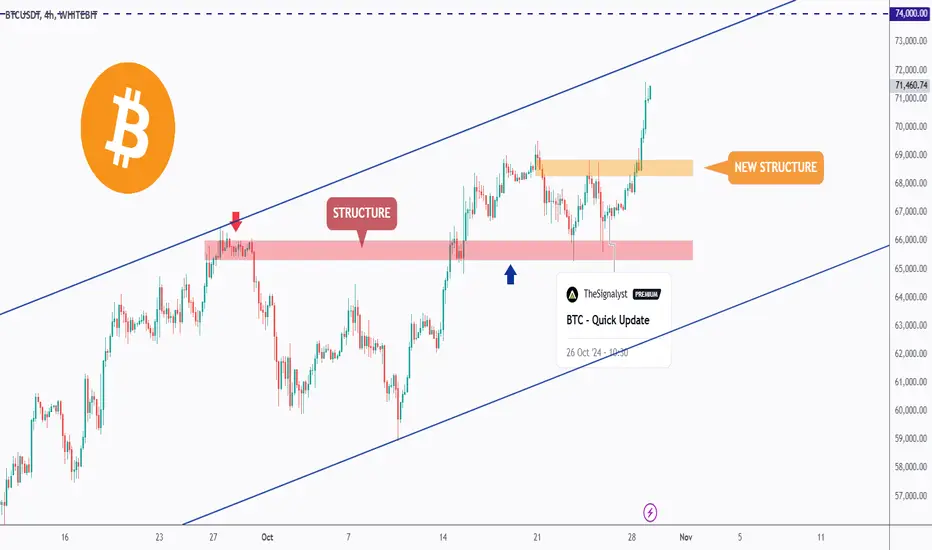
BTC - Bearish Pressure Soon?Hello TradingView Family / Fellow Traders. This is Richard, also known as theSignalyst.
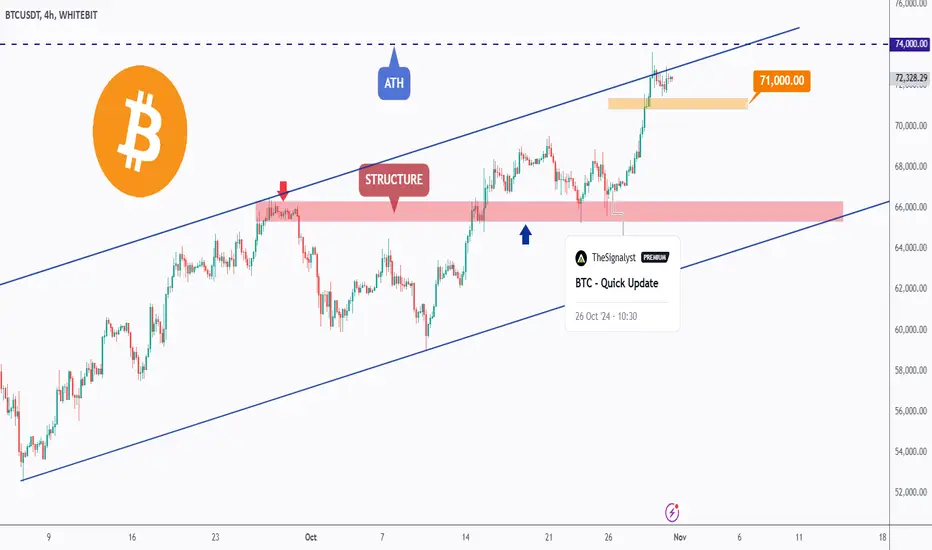
📈 As per my last analysis, attached on the chart, BTC rejected the red structure and traded higher creating a new short-term structure marked in orange.
However, BTC is currently hovering around the upper bound of the channel and all-time high $74,000.
🏹For the bulls to remain in control long-term , a weekly candle close above $74,000 is needed.
📉In parallel, if the last minor low at $71,000 is broken downward, a bearish correction towards the lower blue trendline would be expected.
📚 Always follow your trading plan regarding entry, risk management, and trade management.
Good luck!
All Strategies Are Good; If Managed Properly!
~Rich
Double Bottom with Billions of Metric Tons of Lithium - SLIHere I have AMEX:SLI on the Daily Chart!
Technical -
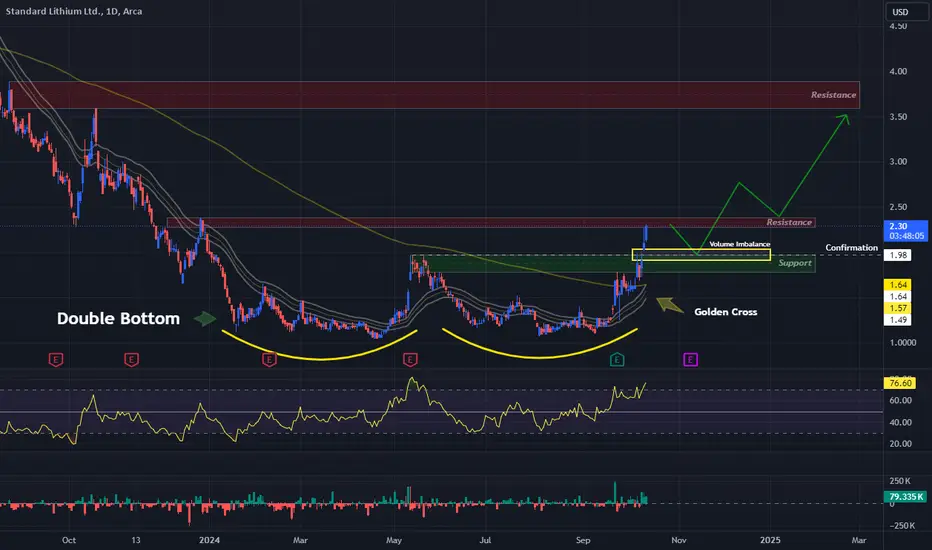
A Double Bottom Reversal Pattern has formed and with the Bullish Rally started from the ~1,800% increase in the Estimate to Reported Results for Earnings and Revenue on Sept. 24th, we see Price Breaking our Confirmation of Pattern @ 1.98!
This weeks Price Action has created a Volume Imbalance between ( 1.91 - 2.03 ) that Price may choose to Fill before it pushes Higher!
Now Price is struggling with the Resistance of Previous High @ ( 2.28 - 2.38 )
-If this rise can be sustained in becoming a New Higher High than our Confirmation of Pattern, we can expect Price to Retest this Break of Confirmation to find Support!
*If the Retest of the Break is successful, we can then suspect Price to find Resistance again at Previous Highs @ ( 3.59 - 3.89 )
Indicators:
- Golden Cross with 200 EMA and Dynamic S&R
- RSI is Above 50
- Strong Bullish presence in Volume leading to Confirmation of Pattern
Fundamental -
Under all this utter devastation that Hurricane Helene and Milton have done to North Carolina and Florida and now with the wildfires ravaging Wyoming, these disasters have uncovered massive Rare Earth Elements and Metal Deposits containing around Billions of Metric Tons of essential components needed to power our shift forward from the Industrial Age to what feels like the Digital Age.
-Adding potential future mining sites to the already known deposits in Nevada, Pennsylvania and California.
EV and other technology advancements will come soon now with these essential minerals and metals possibly on the Brink of Extraction!
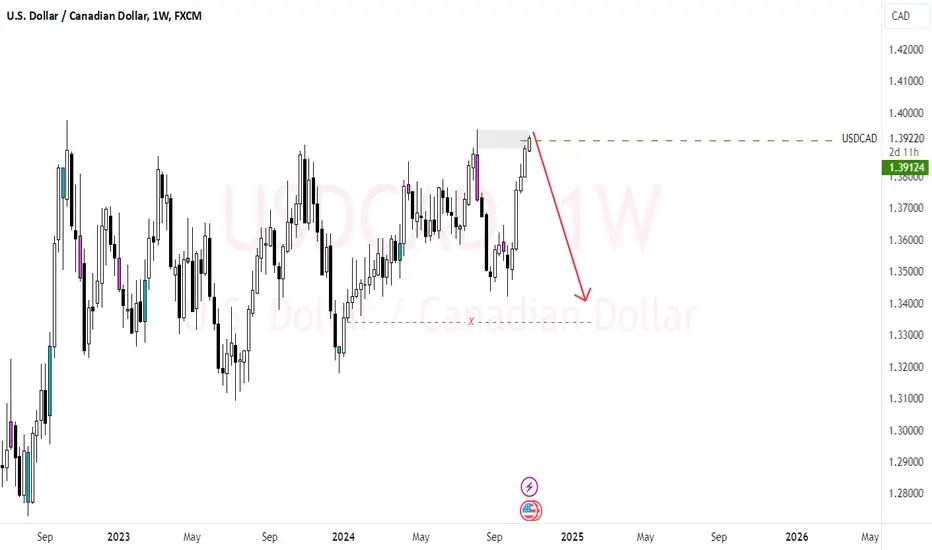
USD CAD Bearish viewExpecting USDCAD to fall from this level. Entry would be after the reversal pattern formed in that area.
This is just for an educational purpose only.
GU look like it setting up for a nice entry for London sessionI been looking for a solid sell entry to continue the bearish trend that GU has been in. The dollar failed to break out and is now retracing to grab more liquidity to push up. in turn giving us a nice entry for a sale. We have to be patient and allow price to find its resistance levels. Expecting a nice set up for London.

BTC - Still Bullish...Hello TradingView Family / Fellow Traders. This is Richard, also known as theSignalyst.
📈 As per my last analysis, attached on the chart, BTC rejected the red structure and traded higher creating a new short-term structure marked in orange.
📈As long as the structure marked in orange holds, BTC will remain bullish, and a movement towards the upper bound of the blue channel and all-time high at $74,000 is expected.
📉 If the orange zone is broken to the downside, a bearish correction toward the $65,000 round number would be expected.
📚 Always follow your trading plan regarding entry, risk management, and trade management.
Good luck!
All Strategies Are Good; If Managed Properly!
~Rich
Palladium is the new Gold... Thank me later!Hello TradingView Family / Fellow Traders. This is Richard, also known as theSignalyst.
📌What is Palladium used for?
Palladium is used in catalytic converters for automobiles, in fuel cells to generate power, in jewelry, dental fillings, and electronic components. Catalytic converters convert the toxic gases from automobiles into less harmful substances.
📌How Rare is Palladium?
Palladium is one of the rarest metals on earth and even more scarce than platinum – 15 times more rare to be precise. If all the platinum in the world fits in your house, then every ounce of palladium can easily squeeze inside your living room.
📌Technical Analysis:
This week, Palladium rejected the $1000 round number and support zone and broke the Daily structure marked in red.
As long as the bulls hold, I expect a bullish continuation towards the $1700.
📚 Always follow your trading plan regarding entry, risk management, and trade management.
Good luck!
All Strategies Are Good; If Managed Properly!
~Rich

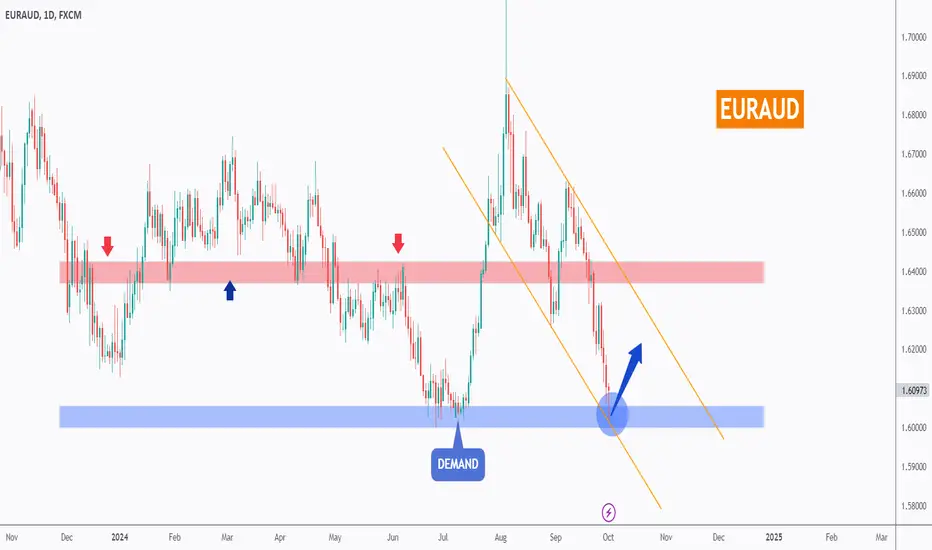
EURAUD - Already OverSold...Hello TradingView Family / Fellow Traders. This is Richard, also known as theSignalyst.
📈 EURAUD has been bearish trading within the falling channel in orange.
Currently, EURAUD is approaching the lower bound of the channel.
Moreover, the zone marked in blue is a strong demand.
🏹 Thus, the highlighted blue circle is a strong area to look for buy setups as it is the intersection of the demand zone and lower trendline acting as non-horizontal support.
📚 As per my trading style:
As #EURAUD approaches the blue circle, I will be looking for bullish reversal setups (like a double bottom pattern, trendline break , and so on...)
📚 Always follow your trading plan regarding entry, risk management, and trade management.
Good luck!
All Strategies Are Good; If Managed Properly!
~Rich
BTC - Bearish Short-Term...Hello TradingView Family / Fellow Traders. This is Richard, also known as theSignalyst.
📉After breaking below the previous low of $68,000 (marked in red), BTC's momentum shifted from bullish to bearish in the short term.
The question is: until when or where?
As long as the bears remain in control, the next major support zone that could hold BTC up is the $63,000 demand zone.
📈Around that demand zone, we will monitor price action and look for bullish setups to confirm a potential reversal.
📚 Always follow your trading plan regarding entry, risk management, and trade management.
Good luck!
All Strategies Are Good; If Managed Properly!
~Rich

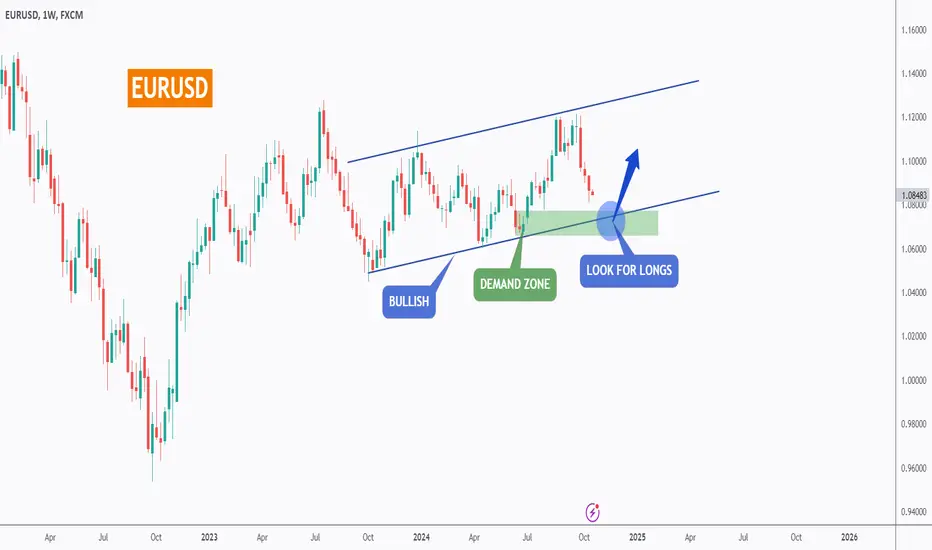
EURUSD - Macro View...Hello TradingView Family / Fellow Traders. This is Richard, also known as theSignalyst.
📈 EURUSD has been overall bullish, trading inside the flat rising channel in blue.
Moreover, it is approaching a demand zone marked in green.
🏹 The highlighted blue circle is a strong area to look for buy setups as it is the intersection of the demand zone and lower blue trendline acting as a non-horizontal support.
📚 As per my trading style:
As #EURUSD approaches the blue circle zone, I will be looking for bullish reversal setups (like a double bottom pattern, trendline break , and so on...)
📚 Always follow your trading plan regarding entry, risk management, and trade management.
Good luck!
All Strategies Are Good; If Managed Properly!
~Rich
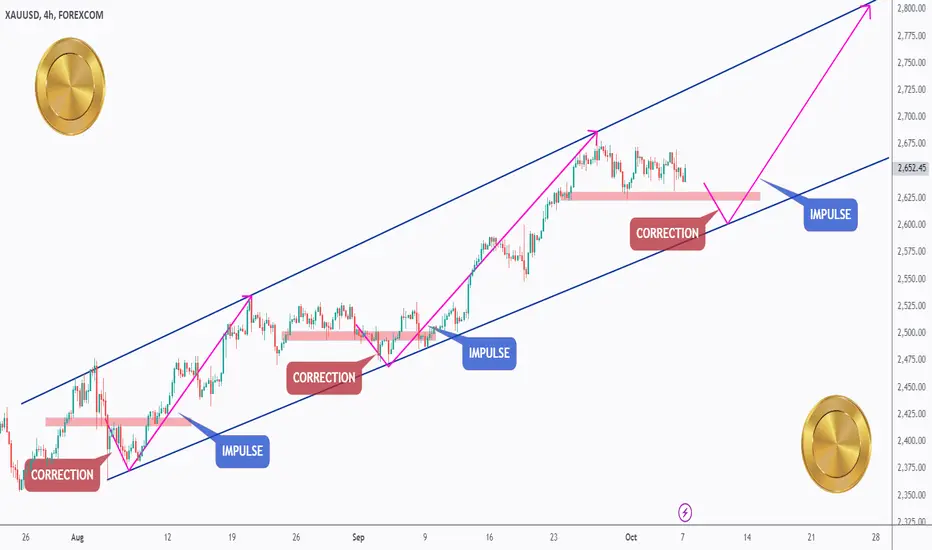
GOLD - History Repeating Itself...Hello TradingView Family / Fellow Traders. This is Richard, also known as theSignalyst.
📔I find the Gold 4H chart interesting.
Do you see a pattern here?
Look at the first two purple projections.
Gold broke below a low (marked in red), which signaled the start of a correction.
The correction was short-lived as the bulls took control again by breaking back above the red zone, triggering the next impulse phase.
Currently, Gold seems to be pausing, which might indicate the start of another correction phase.
🔄If history repeats itself, to signal a new impulse movement, we first need a break below the current low around $2,625, followed by a break back above it.
This projection could lead to the upper bound of the blue channel, around $2,800.
📚 Always follow your trading plan regarding entry, risk management, and trade management.
Good luck!
All Strategies Are Good; If Managed Properly!
~Rich
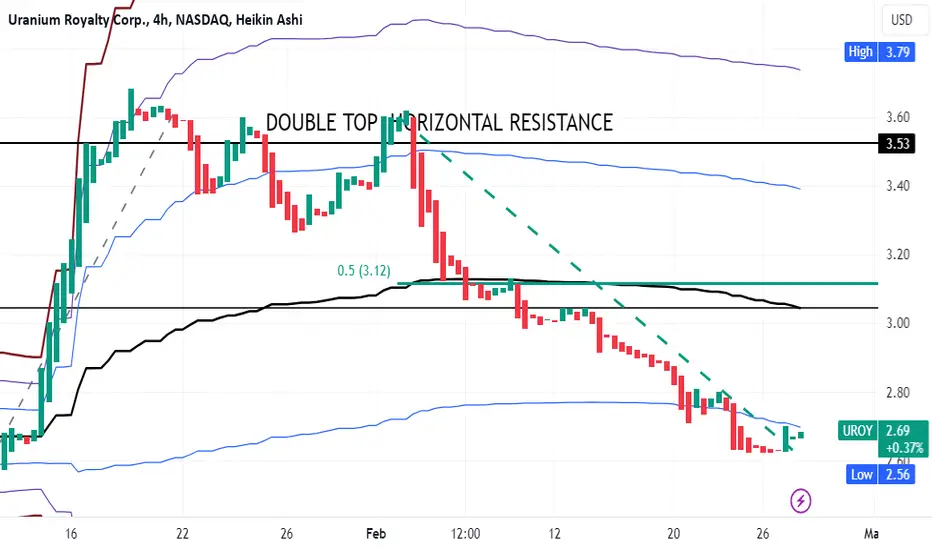
UROY an energy penny stock LONGUROY basically sells rights to mine uranium for a percentage of the production. It is a penny
stock in the nuclear subsector of energy which is undergoing a renaissance in this era of
fossil fuel addiction detoxification in the context of climate change remediation agendas.
The 240 minute chart shows a parabolic move in mid January followed by consolidation
and capitulation into a double top all at about the first anchored VWAP line above the mean
followed by a trend down into the present level near to the first lower VWAP line.
I will take a long trade here targeting the mean VWAP confluent with a standard Fibonacci
retractment which is the green line on the chart. $.05 is taken as a safe stop loss at the lows.
The target is 0.40 upside yielding a R:r of 8. I have positions in URA and UEC at this time.
The entire uranium subsector is cycling from warm to hot again.
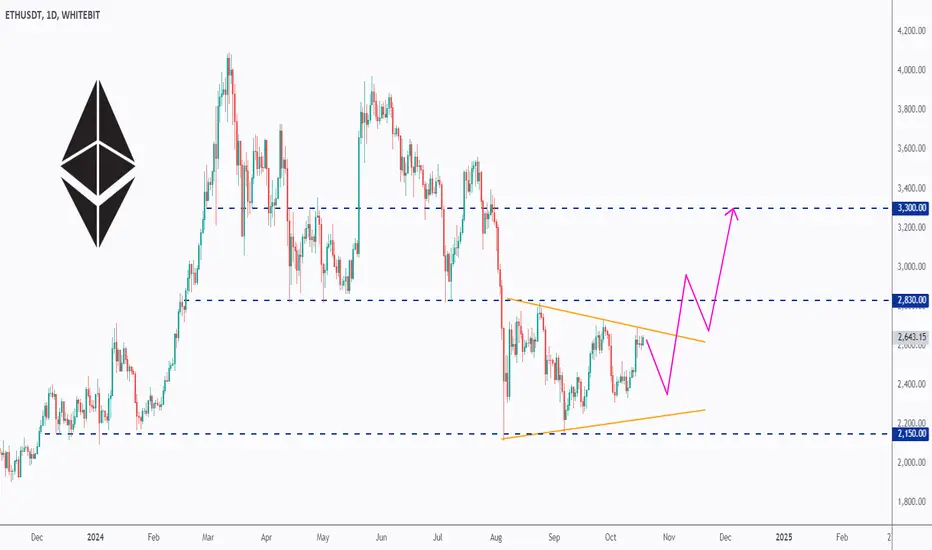
ETH - Roadmap to $3,300!Hello TradingView Family / Fellow Traders. This is Richard, also known as theSignalyst.
ETH has been hovering within a large range, forming a symmetrical triangle marked in orange.
📈 For the long-term bullish trend to be confirmed, a break above the $2,830 level is needed.
In that scenario, a move toward the next resistance at $3,300 is expected.
📉 Meanwhile, another bearish leg within the triangle is anticipated.
📚 Always follow your trading plan regarding entry, risk management, and trade management.
Good luck!
All Strategies Are Good; If Managed Properly!
~Rich
Traders could veer towards the yen with risk events loomingIt is no coincidence that VIX futures have been creeping higher in recent weeks despite Wall Street hitting record highs, as traders are presumably hedging downside risk as we approach the US election. And that means it may not take much to spook traders out of bullish bets with markets at frothy levels, and that could see the yen strengthen as a safety play. Matt Simpson takes a technical look at yen pairs of interest.

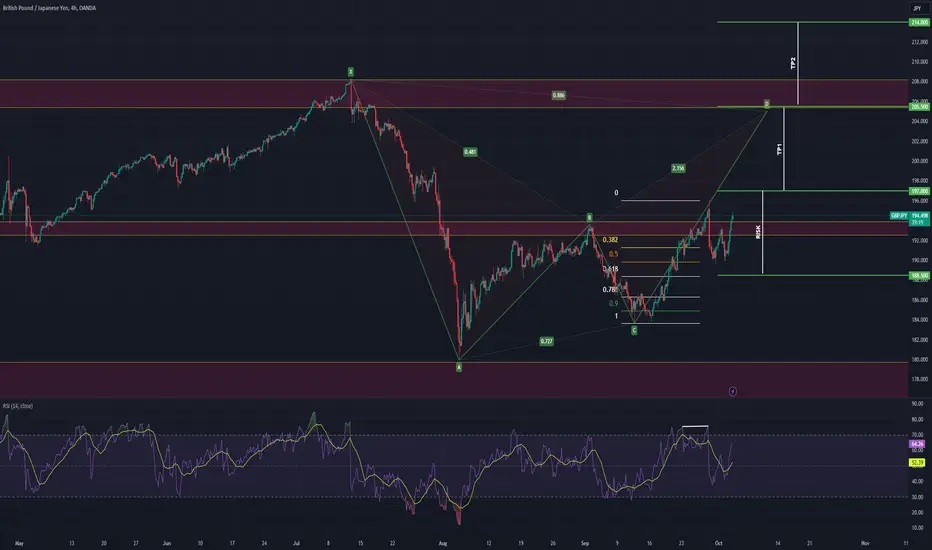
GBPJPY Bullish Reversal OpportunityGBPJPY price is breaking a credible resistance zone. If the price action is able to print a convincing Higher High, it may be a signal towards a proper Bullish breakout and a potential new ALL TIME HIGH may become more likely.
After the Bulls surf the potential wave till TP1, a probable opportunity may arise for the Bears in the form of a probable Harmonic reversal from key Fibonacci Harmonic price levels which increases the importance of moving SL to Break Even if TP1 hits.
Till then, opportunity may be seized by the Bulls.
Trade Plan:
Entry @ 197
Stop Loss @ 188.5
TP1 @ 205.5000
TP2 @ 214.0000
No. of Trades: 2
Move SL to Break Even if TP1 hits.
Parabolic Reversals, A+ setup explained with todays NAS R5 shortRecap of todays NY Session with my shorts on NAS and Gold. I am explaining the parabolic reversal setup in detail since it happens quite often currently and is one of my favourite setups.

BTC - Do You Remember This? Now What?Hello TradingView Family / Fellow Traders,
📍Following my last BTC Monthly log view analysis on November 11, 2022 , we anticipated the bulls taking control after rejecting the lower green trendline and horizontal support.
Currently BTC is approaching its all-time high!
What's Next?
📈 If the current all-time high (highlighted in red) is surpassed, we anticipate a 254% increase, mirroring the last bull cycle. This aligns with the upper boundary of the green channel and the 200k - 250k round numbers.
⚠️ However, the journey may encounter bumps, leading to sharp correction movements to shake out weak hands.
This bearish scenario, would mean retesting the lower green trendline before surging!
📚 Always follow your trading plan regarding entry, risk management, and trade management.
Good luck!
All Strategies Are Good; If Managed Properly!
~Richard Nasr

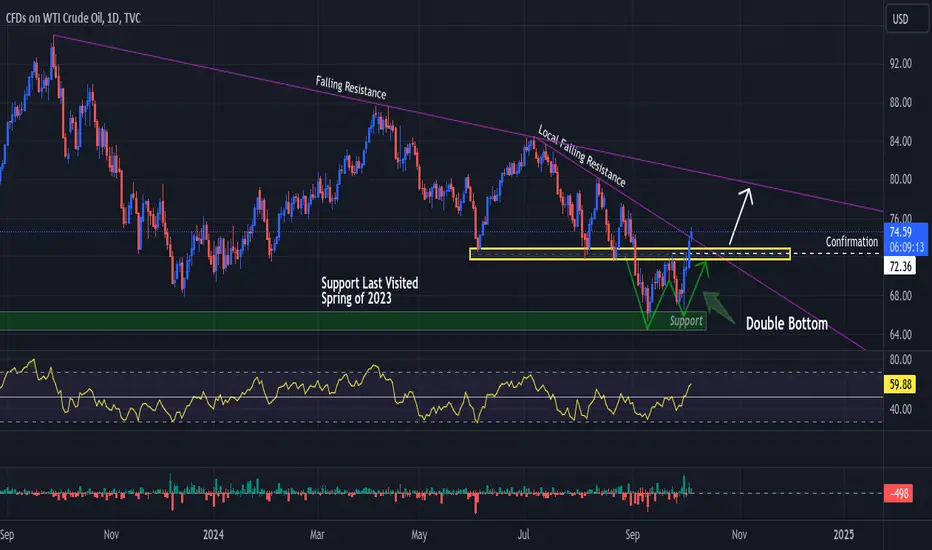
USOIL Rallies, Tensions Rise, Could Price Soar More??Here I have TVC:USOIL on the Daily Chart!
Starting with Technical, we can see Price has formed a Double Bottom at a Support Area that's kept Price afloat for quite some years now, but was last visited and acted as Support for Price back in the Spring of 2023!
Price has Broke the Confirmation of Pattern @ $72.36 and is now Breaking the Local Falling Resistance from prior July & August 2024 Highs. Regardless, Price Action has Broken Structure and created Higher Highs and Lows, confirming Uptrend, starting with the Higher Low of the Double Bottom on Oct. 1!
- Currently we want to see this Bullish Rally continue Breaking Above the Falling Resistance and staying above the ( $71 - $72 ) Range that Price has been interacting with Signaling Bulls in fact are in control, then for a Test of the Break of Confirmation of Pattern and Test of the Break of Local Falling Resistance!
* Once successful, we will see Price rise to the next Falling Resistance created from the Highs of Sept. 2023 & Apr. 2024!
- Massive Bullish Volume enters on the 2nd Low of the Double Bottom on Oct. 1
- Price on RSI is Above 50 with the Break of the Confirmation of Pattern
Now Fundamental, the biggest factor that seems to be at play for TVC:USOIL is all the Geo-political confrontation stirring up. Not only is the Russia/Ukraine war still ongoing, the tensions between Israel/Iran are seeing massive implications across the board!
- Oct. 1 being the beginning of the Iran missile attacks on Israel tradingview.sweetlogin.com
- Now worries arise that Iran's Oil Facilities may be in danger as a possible Retaliatory Israeli Strike Target! With Iran eyeing Israel's Energy Infrastructure, Power Plants, Refineries and Gas Fields!
tradingview.sweetlogin.com
* Oct. 7th is the Year Anniversary to the Israel/Hamas conflict and suspicions arise that we could be looking at things intensifying further!
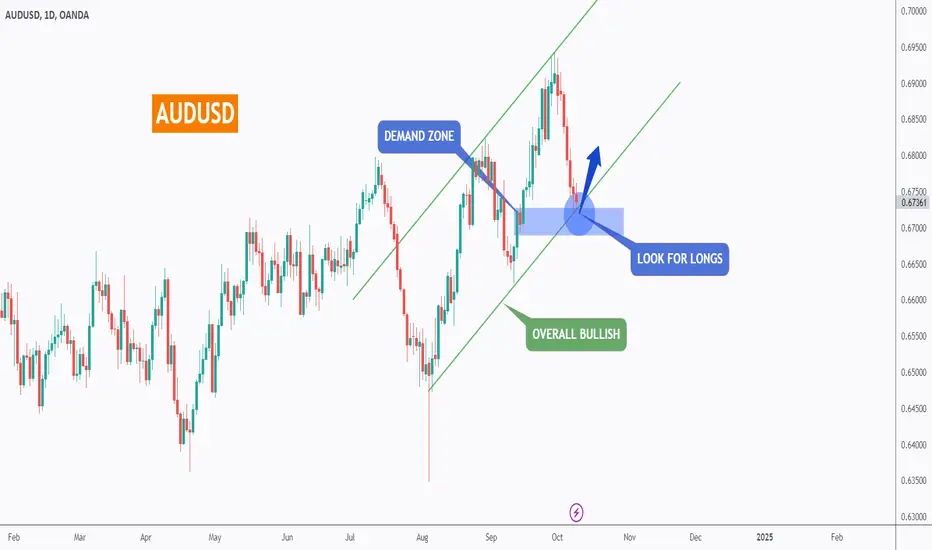
AUDUSD - Follow the Bulls!Hello TradingView Family / Fellow Traders. This is Richard, also known as theSignalyst.
📈AUDUSD has been overall bullish, trading inside the rising channel in green.
Moreover, it is approaching a massive demand zone in blue.
🏹 The highlighted blue circle is a strong area to look for buy setups as it is the intersection of the demand zone and lower green trendline acting as a non-horizontal support.
📚 As per my trading style:
As #AUDUSD is around the blue circle zone, I will be looking for bullish reversal setups (like a double bottom pattern, trendline break , and so on...)
📚 Always follow your trading plan regarding entry, risk management, and trade management.
Good luck!
All Strategies Are Good; If Managed Properly!
~Rich
QQQ breaks above downward trendQQQ reverses after massive selloff and goes into bullish rebound
Thursday Oct 1 saw massive sell off on high volume, signals reversal coming
confirmation of reversal came Friday Oct 4 when it broke the trend and held above
Gap fill on Friday morning was quickly followed by rally staying above downward trend entire day.
Made an entry at 484 expecting more buying to come
