Looking for catalysts - Gold Outlook July 7 - July 11, 2025All about last week you can find here:
FX_IDC:XAUUSD Gold is currently seeking fresh catalysts this week. 🧐
While the economic calendar appears light for this time of year, a lack of economic data doesn't mean nothing is happening. Geopolitical events, especially tariff wars or other flashpoints, remain significant. Are there increasing signs for peace in the Middle East between Israel and Hamas? 🕊️
This week Gold could take advantage from an exisiting reversal head and shoulders pattern and painting pitchfork in the chart shows possibillities for Upside targeting $3400.
## Geopolitical News Landscape 🌍📰
Israel / Iran ⚔️🛑☢️
After fierce clashes in June, a **ceasefire** began June 24. 🇮🇷 Iran's Supreme Leader reappeared July 6, claiming victory 🎤. Tehran has now **banned IAEA inspectors** ❌🔍. Over 900 Iranians reportedly killed ⚰️.
🔮 Outlook: ⚠️ Nuclear tensions growing, diplomacy frozen 🧊. Regional powers remain on high alert 🚨.
India / Pakistan 🗻🔫🕌
Tense calm in Kashmir 😐. India launched its sacred **Amarnath Yatra** 🕉️ under heavy security 🛡️. Pakistan killed 30 militants near the Afghan border ⚔️, while China 🐉 admitted sharing intel 📡.
🔮 Outlook: Diplomatic track stays open 🕊️, but **border flare-ups** and water disputes 💧 remain volatile 🔥.
Gaza Conflict 💣🏘️🕊️
Israel launched deadly airstrikes ✈️, including one on a beach café ☕🏖️ killing 22. Dozens more died 💔. IDF admitted accidental strikes on aid sites 🚚❌. U.S.-led talks seek a **60-day truce** 🤝.
🔮 Outlook: Ceasefire possible 🛑, but **humanitarian crisis** worsening 🚨🩺. Trust remains fragile 💔.
Russia / Ukraine ⚔️
Zelenskyy 🇺🇦 and Trump 📞 discussed new air defense aid 🎯. Russia answered with **massive drone strikes** on Kyiv 🚁🔥. NATO boosts arms shipments 🔫 and backs Ukraine’s domestic weapons production 🏭.
🔮 Outlook: War grinds on ⚙️. No peace in sight, with **global stakes** rising 📈.
U.S. / China Trade War 💼📦🔥
With new tariffs looming 📆💣, Treasury said “multiple deals” are near 🤝. Trump claimed a **partial deal with China** 🐉, though tariffs remain high 📊.
🔮 Outlook: More piecemeal deals 🍰, but a **full-scale trade reset** looks unlikely before elections 🗳️.
🌍 Global Trade War 📉🚢💸
Trump’s shifting tariffs 🎯 hurt global growth 🌐. Markets hit record highs 📈 but investment chills ❄️. The 💵 dollar had its sharpest 6-month drop 📉 in decades.
🔮 Outlook: Businesses remain cautious ⚠️. **Supply chains** reroute 🔄. No global rebound without clarity 🔍.
Trump vs. Powell 💥🏛️📉
Trump demanded Powell’s resignation ❌📉, accusing him of weak rate policy 📊. Powell held firm 🧊, citing inflation risks 📈. Trump eyes replacements 👀🪑.
🔮 Outlook: Fed independence 🏛️ under fire 🔥. **Rate policy** may get politicized ahead of 2025 elections 🗳️.
📈 U.S. Inflation 🛒💰🧾
Inflation slowed to 0.1% 🐢, but tariffs raised prices on appliances 🔌 (+4.3%) and toys 🧸. Fed projects 3% inflation by year-end 📊.
🔮 Outlook: As **tariffs bite** 🦷, inflation likely to climb 📈. Fed stays cautious 🧐 on cuts.
Technical View 📐📈
Analysis Period: May 25 - June 6, 2025 | Forecast: June 7-11, 2025
1. ICT (Inner Circle Trader) Methodology Analysis 🧠
Market Structure
Higher Timeframe Bias: The chart shows a clear bullish market structure with higher highs and higher lows from the major low around 3,250. 🐂
Current Structure: Price is in a consolidation phase after reaching highs near 3,370, showing potential distribution. ⚖️
Key ICT Concepts Identified:
Fair Value Gap (FVG): Multiple gaps visible during the strong rally from 3,250 to 3,370. 💨
Order Blocks: Significant demand zone around 3,250-3,260 level (major accumulation area). 📦
Liquidity Zones:
Buy-side liquidity above 3,370 (recent highs). 💸
Sell-side liquidity below 3,320 (recent consolidation lows). 📉
Market Maker Models: Classic accumulation-manipulation-distribution pattern visible. 🔄
Session Analysis:
London Session: Shows strong directional moves. 🇬🇧
New York Session: Continuation of trends with increased volatility. 🗽
Asian Session: Consolidation and range-bound behavior. 🌏
2. Gann Analysis 🧙♂️
Gann Angles & Time Cycles:
Primary Trend: 1x1 angle supporting the bullish move from 3,250. ↗️
Resistance Angles: 2x1 and 3x1 angles providing resistance around current levels. 🚧
Time Cycles:
7-day cycle showing completion around June 2-3. 🗓️
14-day cycle suggesting potential reversal window June 7-9. ⏳
Gann Price Levels:
Major Support: 3,250 (1/8 level). 🛡️
Current Resistance: 3,370 (7/8 level). 🛑
Next Target: 3,400 (full octave completion). 🎯
Geometric Relationships:
Price squared relationship suggests 3,380-3,400 as natural resistance. 📐
Time-price balance indicates consolidation period before next major move. 🕰️⚖️
3. Fibonacci Analysis ✨
Retracement Levels (from 3,250 low to 3,370 high):
23.6%: 3,341.6
38.2%: 3,324.2
50.0%: 3,310.0
61.8%: 3,295.8
78.6%: 3,265.6
Extension Levels:
127.2%: 3,402.6
161.8%: 3,444.2
200.0%: 3,490.0
Current Analysis:
Price has respected the 23.6% retracement level multiple times. ✅
Strong support confluence at 38.2% level (3,324). 💪
Extension targets suggest potential move to 3,402-3,444 range. 🚀
4. Institutional Levels Analysis 🏦
Psychological Levels:
3,300: Major round number providing support. 💯
3,350: Mid-level resistance. 📊
3,400: Next major psychological target. 🎯
Institutional Order Flow:
Accumulation Zone: 3,250-3,280 (heavy institutional buying). 💰
Distribution Zone: 3,350-3,370 (profit-taking area). 💸
Breakout Target: 3,400+ (next institutional objective). ⬆️
Volume Analysis:
High volume on the initial move up from 3,250. 📈
Decreasing volume during consolidation (typical distribution pattern). 📉
Volume expansion needed for breakout confirmation. 💥
5. Cycle Timing Analysis ⏰
Short-Term Cycles:
3-day cycle: Currently in compression phase. 🤏
7-day cycle: Completed around June 2-3. ✅
14-day cycle: Due for completion June 7-9. ⏳
Medium-Term Cycles:
Monthly cycle: Bullish momentum phase. ⬆️
Quarterly cycle: In expansion phase. 🌟
Cycle Projection:
Next major cycle turn expected June 7-9. 🔄
Potential for either breakout or correction during this window. 🤞
6. FORECAST: June 7-11, 2025 🔮
Primary Scenario (60% probability): Bullish Breakout 🚀
Target 1: 3,400-3,410
Target 2: 3,440-3,450
Catalyst: Break above 3,370 with volume. 💥
Timeline: June 7-9 initial move, June 10-11 extension.
Secondary Scenario (35% probability): Corrective Pullback ⬇️
Target 1: 3,320-3,325 (38.2% Fibonacci)
Target 2: 3,300-3,310 (psychological support)
Catalyst: Failure to break 3,370 resistance. 🚫
Timeline: June 7-8 decline, June 9-11 consolidation.
Low Probability Scenario (5% probability): Deep Correction 📉
Target: 3,280-3,290 (61.8% Fibonacci)
Catalyst: Major risk-off sentiment. 😱
Timeline: Extended throughout the week.
7. Key Assumptions & Risk Factors 🤔
Bullish Assumptions:
Continued institutional accumulation at current levels. 🏦
Breakout above 3,370 with confirming volume. ⬆️
Favorable macroeconomic backdrop for gold. 🌍
Weakness in USD supporting gold prices. 💵
Geopolitical tensions maintaining safe-haven demand. 🕊️
Bearish Risk Factors:
Profit-taking at psychological 3,400 level. 🤝
Stronger USD due to economic data. 💹
Reduced safe-haven demand. 📉
Technical failure at key resistance levels. 🚧
Central bank policy shifts. 🏛️
8. Trading Recommendations 💡
Entry Strategies:
Bullish Setup: Buy on pullback to 3,340-3,345 with stop below 3,320. 🎯
Breakout Play: Buy break above 3,372 with stop below 3,350. 🚀
Conservative: Wait for retest of 3,324 support area. patiently 🧘
Risk Management:
Position Size: Limit to 2-3% of portfolio per trade. 📏
Stop Loss: Always use stops below key support levels. ⛔
Take Profit: Scale out at Fibonacci extension levels. 💰
Key Levels to Watch:
Immediate Resistance: 3,365-3,370 🛑
Support: 3,340-3,345 🛡️
Breakout Level: 3,372 🚀
Major Support: 3,320-3,325 💪
9. Conclusion ✅
The XAUUSD chart presents a constructive bullish setup with multiple confluences supporting higher prices. The completion of various cycles around June 7-9 suggests a potential catalyst for the next major move. While the primary bias remains bullish targeting 3,400+, traders should remain alert to the possibility of a corrective pullback to test lower support levels. 🧐
The institutional accumulation pattern, combined with favorable Gann angles and Fibonacci projections, supports the bullish thesis. However, proper risk management is essential given the potential for volatility around key psychological levels. ⚠️
Please take the time to let me know what you think about this. 💬
-------------------------------------------------------------------------
This is just my personal market idea and not financial advice! 📢 Trading gold and other financial instruments carries risks – only invest what you can afford to lose. Always do your own analysis, use solid risk management, and trade responsibly.
Good luck and safe trading! 🚀📊
Reverseheadandshoulders

Beyond the Headlines - Gold Outlook June 16-20, 2025Beyond the Headlines: Gold's Ascent Amidst Global Shifts & Key Technicals 🌐🚀
Everything about the last week can be found here:
OANDA:XAUUSD 💰📈
We all know what's going on, I believe. Israel struck Iran 💥, and this conflict will likely take a bit before things cool down. 🥶
---
## Geopolitical News Landscape 🌍📰
### Israel / Iran
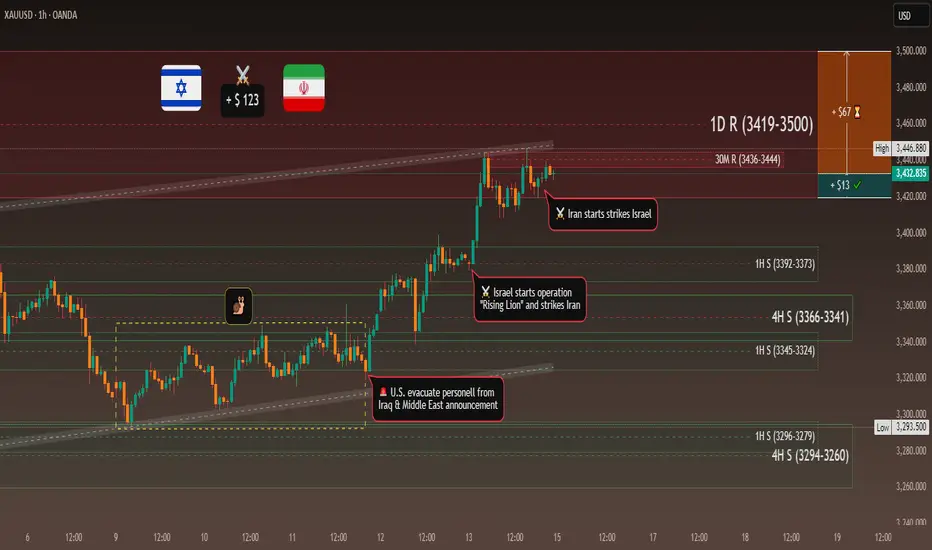
Since June 12, Israel launched "Operation Rising Lion," targeting Iranian nuclear sites like Natanz and Esfahan – over 128 killed, Iran claims. 🇮🇷 retaliated with missile and drone strikes on Haifa and Tel Aviv, killing at least 10. 🚀
**Outlook:** 🔥 Tensions are spiraling. Without urgent mediation, full-scale regional war remains a real risk. 💣
### India / Pakistan
Since the May ceasefire, few clashes have occurred. However, both navies increased readiness, signaling potential escalation at sea. 🚢
**Outlook:** ⚖️ Peace is fragile. A strategic dialogue is key to avoiding a renewed border or maritime conflict. 🙏
### Gaza Conflict
Between June 7–15, Israeli strikes killed at least 41 Palestinians, including 8 near an aid center in Rafah. Over 55,000 total deaths, and famine is looming. 💔
**Outlook:** 🆘 Gaza remains a humanitarian catastrophe. Global pressure for access and a ceasefire must intensify. 🕊️
### Russia / Ukraine
June 13–15: Russia returned the bodies of 1,200 Ukrainian soldiers in a rare POW swap gesture. 🤝 Fighting remains intense in Sumy and Toretsk; Russia hit a major oil refinery. 🏭
**Outlook:** 🕊️ While symbolic moves continue, no peace is in sight – battlefield outcomes will shape diplomacy. ⚔️
### U.S. - China Trade War
The U.S. hiked tariffs to 55% on key Chinese goods. 🇺🇸🇨🇳 responded with 10% on U.S. imports. Talks yielded a partial truce, but military-use rare earths remain unresolved. 💻
**Outlook:** 🔧 Tech remains the battleground. Without progress on critical materials, the trade war may deepen. 📉
### Global Trade War
The OECD revised global growth downward due to rising tariffs from the U.S. targeting 🇨🇳, 🇲🇽, 🇨🇦. Global trade volume is expected to shrink by 0.2–1.5%. 📉
**Outlook:** ⛓️ Supply chain disruption is spreading. Global trade will stay under pressure without coordinated policy. 🌍➡️🌍
### Trump vs. Powell
Trump labeled Powell a "numbskull" for not cutting rates, suggesting he might "force something" if re-elected. 🗳️ The Fed maintains policy independence ahead of a critical June decision. 🏛️
**Outlook:** ⚔️ Political pressure on the Fed is mounting. Expect more friction as the election cycle heats up. 🔥
### U.S. Inflation
CPI rose 2.4% YoY in May (from 2.3%); Core CPI held steady at 2.8%. Monthly growth was modest at 0.1%. Key rises were seen in healthcare and vehicle prices. 🚗🏥
**Outlook:** Inflation is stable but sticky. 🚦 The Fed will likely hold rates steady until clearer disinflation signals appear. 📊
---
## Technical View 📐📈
### Market Structure:
Gold shows a clear **bullish market structure** with higher highs and higher lows. ⬆️ Recent price action suggests we're in a strong uptrend with institutional buying pressure. 🏦
### Key Levels:
* The chart shows a significant low around the **$3,245 area** (marked as "Low") which could act as a key institutional support level. 💪
* The current high near **$3,446** represents a potential institutional resistance zone. 🛑
* Look for potential **order blocks** around the **$3,380-$3,400 range** where price consolidated before the recent breakout. 🧱
### Fair Value Gaps (FVG):
There appear to be several gaps in the price action during volatile moves, particularly during strong rally phases. These could act as future support/resistance areas. 📉📈
### Gann Analysis:
The price movement shows strong adherence to Gann principles:
* The rally from the low follows a steep angle, suggesting strong momentum. 🚀
* Key Gann angles would place support around the **$3,300-$3,320 zone**. 📐
* The current price near **$3,436** is testing natural resistance levels based on Gann square calculations. 📏
### Fibonacci Levels:
From the significant swing low to the current high:
* 23.6% retracement: ~$3,395 📉
* 38.2% retracement: ~$3,370 📉
* 50% retracement: ~$3,345 📉
* 61.8% retracement: ~$3,320 📉
The golden ratio levels suggest key support on any pullback would be around the **$3,370-$3,345 zone**. ✨
### Institutional Levels:
* **Weekly/Monthly Levels:** The **$3,400** and **$3,450** areas appear to be significant institutional levels based on round numbers and previous price action. 🏦💰
* **Smart Money:** The accumulation pattern before the breakout suggests institutional participation. 🧠💡
### Cycle Timing:
Based on the timeframe (appears to be 30-minute bars from May 26-June 15):
* We're seeing approximately **3-week cycles** in the major moves. 🗓️
* The current rally phase appears to be in its mature stage. 🌳
* The next potential cycle turn could be approaching, suggesting caution for new longs at current levels. ⚠️
---
### Trading Considerations:
* Watch for rejection at current levels near **$3,446**. 📉
* Key support confluence around **$3,370-$3,345** for potential re-entry. 🎯
* Volume and momentum divergences would be critical for timing any reversal. 📊🔄
Other indicators tend to show bullish scenario enhancements. 🚀
Gold has formed a ** Standard Bullish Flag pattern ** over a time from early April till today. 🚩🐂
Also, the structure of a ** reverse Head & Shoulders ** is existing and has broken the neckline! 🔄🗣️
Another indicator is an existing "** Ascending Bull Flag **." ⬆️🚩
Please take the time to let me know what you think about this. 💬
-------------------------------------------------------------------------
This is just my personal market idea and not financial advice! 📢 Trading gold and other financial instruments carries risks – only invest what you can afford to lose. Always do your own analysis, use solid risk management, and trade responsibly.
Good luck and safe trading! 🚀📊
Turbulent Week Ahead? Gold Outlook June 9-13, 2025Hey fellow traders,
Let's dive into the OANDA:XAUUSD outlook for the upcoming week, June 9-13, 2025. The recent price action has been a rollercoaster 🎢, and the next few days promise even more fireworks 🎇.
Looking back at the 30-minute chart from May 22 to June 6, gold saw an initial consolidation, then a strong rally to multi-week highs near 3,420. However, this was followed by a sharp, dramatic reversal, pushing prices back below 3,300. This "bull trap" 🐂 pattern suggests underlying weakness and potential preemptive market positioning.
Another view on this could be the possibility that a gap on the chart at 3300-3295 of around $5 could get closed. Since strong support is right below this, it could serve as a good launchpad 🚀 for an upward rally. Let's see if the upcoming Asia session on Monday triggers this because its only - $14 from $3309.
Key Drivers for the Week Ahead:
📅 June 9, 2025 (Monday)
US-China High-Level Trade Talks Commence in London
High-level delegations from the United States and China began trade discussions in London. This meeting followed an announcement by President Donald Trump on Friday, June 6, 2025, who described a preceding 90-minute phone call with Chinese President Xi Jinping as "very positive".
The US delegation included Treasury Secretary Scott Bessent, Commerce Secretary Howard
Lutnick, and US Trade Representative Jamieson Greer, reflecting a coordinated approach to addressing complex trade issues. The talks were primarily aimed at resolving the ongoing bilateral trade war, with a particular focus on tariffs and the global supply of critical rare earth minerals.5 While no specific time for the commencement of talks was provided, it is understood they began during London's daytime, approximately (10:12 CEST / 04:12 EDT).
These discussions occurred in the context of a temporary 90-day agreement reached on May 12, 2025, which had seen the US reduce its tariffs on Chinese imports from 145% to 30%, and China reciprocate by lowering its tariffs on US goods from 125% to 10%.9 However, this temporary truce is set to expire in early August, and President Trump had recently accused China of violating the agreement, specifically regarding critical mineral exports. The broader bilateral relationship remains strained by issues extending beyond tariffs, including restrictions on advanced chips, student visas, and concerns over China's state-dominated economic model.
The prompt scheduling of these high-level talks immediately after a leader-to-leader call suggests a tactical move towards de-escalation of immediate trade tensions, aiming to prevent a full-blown trade war. The objective appears to be managing current conflicts rather than achieving a fundamental resolution, especially with the May 12 agreement nearing its expiration. The core disputes, such as control over rare earths and technology, are deeply entrenched and reflect a broader geopolitical competition rather than mere economic disagreements. This pattern of temporary de-escalation followed by persistent underlying tensions indicates a long-term,structural competition. It suggests that trade policy is increasingly intertwined with national security and geopolitical strategy, implying that businesses should anticipate continued volatility and strategic decoupling in certain sectors, rather than a return to pre-trade war normalcy.
Other big movers for gold will be the US inflation reports. 💥
📅 Wednesday, June 11 (14:30 CEST / 08:30 EDT):
We get the crucial US Consumer Price Index (CPI) data.
Watch for Core CPI (YoY) with a forecast of 2.9% and headline CPI (YoY) at 2.5%.
📅 Thursday, June 12 (14:30 CEST / 08:30 EDT):
The US Producer Price Index (PPI) follows.
Forecasts are for Core PPI (YoY) at 3.0% and headline PPI (YoY) at 2.6%.
📊 These numbers are critical. If inflation comes in hotter 🔥 than expected, it will likely strengthen the US Dollar 💵 and push real interest rates higher 📈, making gold less attractive. This could trigger further declines 📉, especially given the current market structure. Conversely, cooler 🧊 inflation could spark a significant rebound 🔄.
Beyond US data, keep an eye 👁️ on speeches from various European Central Bank (ECB) officials throughout the week, including President Lagarde on Tuesday (23:15 CEST / 17:15 EDT). Their collective tone 🎤 could influence EUR/USD dynamics and indirectly impact the US Dollar Index, offering a counterbalance ⚖️ or amplification to gold's movements.
Key Numbers and Technical Levels to Watch:
Gold is currently sitting on a substantial speculative net long position of 187.9K contracts. This is a massive amount of bullish bets 📊🐂, making gold highly vulnerable to rapid liquidation 💣 if the fundamental picture turns sour. A "long squeeze" could amplify any downside move.
Immediate Support: The 3,300 level is paramount. A decisive break below it would signal further weakness. Below that, 3,250 is strong technical support where we saw a bounce previously.
Overhead Resistance: Look for resistance at 3,350-3,360, and then the recent peak of 3,420. Reclaiming these levels would require a significant shift in sentiment.
Expect high volatility ⚡, especially around the US inflation releases. Trade smart 🧠, manage your risk ⚖️, and stay nimble! 🏃
Geopolitical News Landscape 🌍
India / Pakistan
The ceasefire from May 10 is holding, but diplomatic relations remain frosty. India has launched a global image campaign to gain support, while Pakistan insists on dialogue and accountability.
Outlook: Without substantial agreements on border terrorism and water issues, tensions will stay latently high, with potential for new escalation risks. ⚠️
Gaza Conflict
Violence escalated again in early June. Israel intensified attacks, killing civilians seeking aid in Gaza City, and at least six people were killed at a distribution point.
Outlook: The humanitarian situation continues to worsen 🚨, and international mediation efforts are urgently needed. However, an immediate ceasefire seems unrealistic. ❌
Russia / Ukraine
In the first week of June, Russia launched one of its largest series of attacks: hundreds of drones and missiles hit Kharkiv and Kyiv, resulting in civilian casualties. Simultaneously, a planned prisoner exchange has stalled.
Outlook: Strategic air attacks will likely continue 💥, and the prisoner exchange remains deadlocked. Without a diplomatic initiative, the conflict will stay entrenched. 🕳️
U.S.–China Trade War
Following talks between Trump and Xi, new negotiation rounds are expected in London. China has opened up rare earth exports, a sign of cautious de-escalation.
Outlook: If dialogue channels open 🗣️, systemic trust could grow, but genuine reforms remain uncertain. 🤔
🌐 Global Trade War
The OECD has lowered its growth outlook to 2.9%, warning of protectionism 🧱 and delayed investments. The ECB is also maintaining synchronization with the FED.
Outlook: Without de-escalation, the world faces a global economic slowdown 🐌 and permanent fragmentation of supply chains. 🔗
🏛 Trump vs. Powell
Trump has again complained about the FOMC's hesitancy, nicknaming Powell “Too Late,” and demanding a full 1% interest rate cut.
Outlook: Pressure is mounting 📣. Whether the Fed yields depends on if inflation and labor data allow for a loose policy. 🎯
💵 U.S. Inflation – May 2025
Forward-looking data shows a weakening services sector and consumer prices rising again as tariffs pass through. Official CPI data for May 2025 will be released on June 11.
Outlook: Higher inflation could halt the Fed's "dereflexion" course — a dilemma ⚖️ between growth 📈 and price stability. 🛑
Technical View 📐
Regarding the major Head and Shoulders (H&S) reversal pattern on the 4H chart I shared previously, I'd like to explain some new developments that are altering its potential outcome.
Since the price has re-entered and fallen below the neckline, I activated my "second brain cell" 🧠 to guess what could be next. This led me to revise the larger 4-hour chart structure with the adjustments shown in the accompanying image.
As you can also see in the updated version below, a reversed H&S pattern remains a possibility, as the proportions still appear valid. 🔄
Potential Scenarios for Gold 🧩
Under this revised idea, Gold could potentially reach the neckline entry at 3397 (+88) from the current price. This is one plausible scenario. ✅
Alternatively, the price could drop further to the "Head" at 3120 (-191 from the current 3309), which would, of course, invalidate this H&S pattern. ❗
While this is speculative 🔮, given that trading often involves psychological movements and their resulting impacts, I believe this is a favorable approach to forecasting.
Another reason to see it as bullish is the formed standard bull flag 🚩🐂.
Please take the time to let me know what you think about this. 💬
-------------------------------------------------------------------------
This is just my personal market idea and not financial advice! 📢 Trading gold and other financial instruments carries risks – only invest what you can afford to lose. Always do your own analysis, use solid risk management, and trade responsibly.
Good luck and safe trading! 🚀📊

Shoulder on Shoulder - Need a dump this Week😥 The past week was complicated, and I don't want to bore you with all the political goings-on, which I hope you're already aware of. I'm a bit short on time right now, but I still wanted to share this perspective with you all.
💁♂️ It is Shoulder on Shoulder H&S everywhere!
💡 My concept of a plan:
🧗 Let's climb the Pinky way down
3289 - Actual Price
3271 - 🏁 S1
3232 - 🚪 Pink Neckline entry
3245 - 🤞 S2 & Head of White reverse H&S
3204 - 👀 Pink Start from Left Shoulder
3184 - 🎯 TP 1 - Fibo 1.272
3163 - 🎯 TP 2 - Fibo 1.414 or 3166
3134 - 🎯 TP 3 - Fibo 1.618 or 3154
3120 - 👀 Head of Yellow reverse H&S
3079 - 🎯 TP 4 - Fibo 2
🗣️ Important: FED Chair Powell speaking June 02 Mon at 1 PM EDT
What are your toughts about this? Please write it in the comments.
-------------------------------------------------------------------------
This is just my personal market idea and not financial advice! 📢 Trading gold and other financial instruments carries risks – only invest what you can afford to lose. Always do your own analysis, use solid risk management, and trade responsibly.
Good luck and safe trading! 🚀📊

SOL Breakout on the Horizon!SOL has been flashing some strong bullish signals lately. It formed a reverse head and shoulders pattern in August, with a classic cup and handle within. Then, in early October, a double bottom formed on the right shoulder of the reverse head and shoulders. Now, with candlesticks looking to break out of a bullish wedge, all signs point toward a potential breakout. The technicals are aligning, and significant gains are on the horizon.

URA - Looking Good for Major MoveThe URA base appears to be a major reverse head and shoulders formation with price projections into the 40s. The move thus far appears to be impulsive with wave 5 targets also shown at the 1 and 1.618 levels. Still appears to be under the radar

SLV - Finally Catching Up With GoldPrecious metals continue to rocket higher and even as Central Banks around the world flock to gold and lighten up on US Dollar exposure, lagging far behind is silver that is still quite a ways from its all time high close to 50. Reverse head and shoulders formations show some possible targets in the 34-35 area but my best speculative bet is that SLV will hit its previous high, perhaps forming a mega cup and handle formation. For many silver enthusiasts, prices reaching $100-200 seems quite plausible. While it's always best to acquire the physical metal, as the ETFs erode value over time due to management fees, Silver is still cheap in my book. With the gold/silver ratio around 80 and falling, I expect silver to outperform gold going forward.

Reverse Head and shoulders1-3 month time frame, next earnings release could be catalyst along with recently launched open source AI tools.
Appears to be reverse h&s forming

BTCUSDT Technical AnalysisWhen the BTCUSDT 4-hour chart is examined; It is observed that the price movements continue on the trend line with the formation of the Inverse Head and Shoulders Formation. As long as the crypto's level of 55554 is not broken down, it is evaluated that the price movements above the level of 58753 can exceed the level of 65022 and target the level of 69969.

Daily Buy Trigger on the charts. Reverse Head and Shoulder?Is this the beginning of a right shoulder on a Reverse Head and Shoulder Pattern? If so, this looks like a tremendous opportunity to catch a good Risk vs Reward Trade
Long on TVS MotorsRisk Disclaimer - Only for Educational Purpose.....
1) Big Picture trend is good UP
2) I Dropped to Lower Time Frame where Trend was Down And was Looking for Reversals
3) Found Reverse Head & Shoulders Patter.

ALKEM LAB BULLSIH PATTERN _Daily Timeframe_NSE:ALKEM
Stock is consolidating between 3350 to 3450 approximately a month. Price 3350 is holding as good support.
Currently we can see there is a morning star pattern(Bullish Pattern) at support which is a sign of strength. We can go long at these levels and keep SL below swing. The stock should not open gap down on 28th June.
Following to this check 1hr time frame we can see there is a reverse head and shoulder although the Shoulder length is a bit low compare to usual H&S.
This is a good opportunity for positional traders stock has potential to go 3600 in upcoming weeks.
Keep eye, Thank you.
This is only for educational purpose, please manage your risk accordingly.

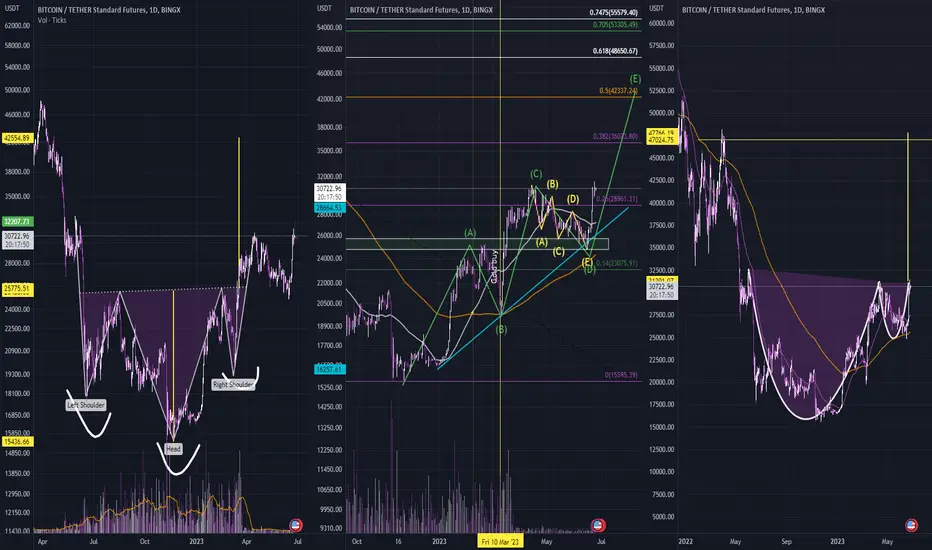
Bitcoin ($BTC) 3 Bullish scenariosLeft Chart:
1. I have displayed a head and shoulder formation that could take around 42k BTC. I already posted this scenario a couple months ago on my Twitter twitter.com
Middle Chart
2. I drew an ABCDE move on the middle chart for longer-term and mid-term price forecasts. The short-midterm ABCDE move, which we have just confirmed/completed, suggests that we were about to reverse towards the upside creating an S/R (Support Resistant) Flip. As for the green wave, we have just finished our C move and bounced off the new demand zone, completing our D move as the price will likely move up as we are currently trending the upside to complete our E move. Targeting aorund 42k based on the 0.5 fib level
Right Chart
3. Simple cup and holder formation that could take us to around 47k BTC.
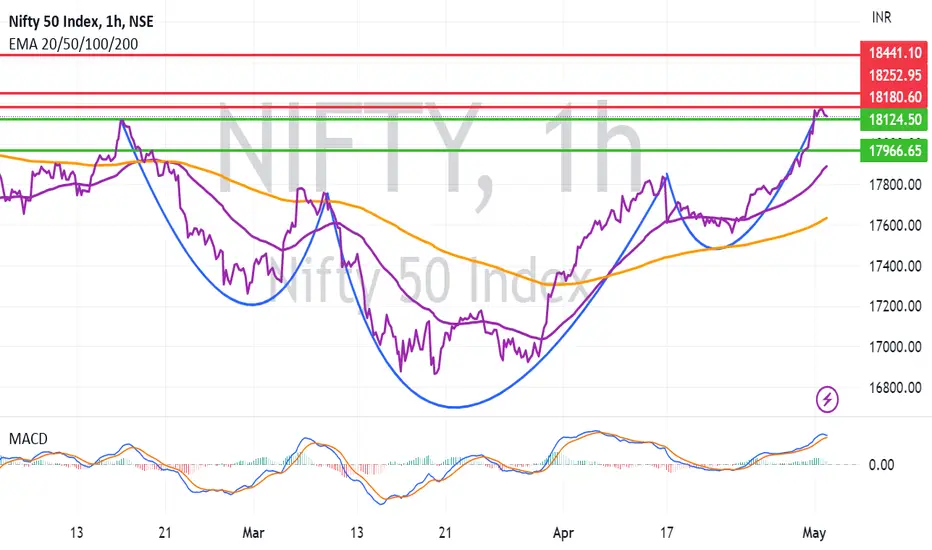
Depicted earlier Reverse Head & Shoulder Break Out in progressIt was depicted earlier that something similar to Reverse Head & Shoulders Breakout is in Progress and that showed today.
Next Resistances: 18270 and 18441.
Immediate Supports: 18153, 18042 and 17966.

Will Reverse Head & Shoulders Breakout be a success? Market Outlook:
Nifty is on a roll and taking all the negative news under it’s wings and rising like a phoenix. The Mother of all bi-monthly economic events FOMC meet and decision on US Federal Reserve rate hike/Pause and US Fed chief Powell’s comments about the future rate decisions awaits to test its resolve. A positive looking Reverse Head & Shoulder like structure is formed on Nifty Chart as you can see below. We will know later this week if the Reverse Head and Shoulder Breakout is successful or not.
One thing is for sure that corrections are temporary but Indian economy, it’s strength remains intact. It may take time but Indian Indices do bounce back. Long Term Investors should trust the story of India and continue to invest for long term irrespective of whether the current Breakout or current rally sustains or not.
Nifty Supports From Current Level: 18124, 17966, 17888 and 17632.
Nifty Resistances from Current Level: 18180, 18252 and 18441.
Alibaba probably forming head & shoulder pattern. 24/March/23.Alibaba’s downward price probably stalled @ 1) Demand Zone 2) Right shoulder of reverse head & shoulder pattern.

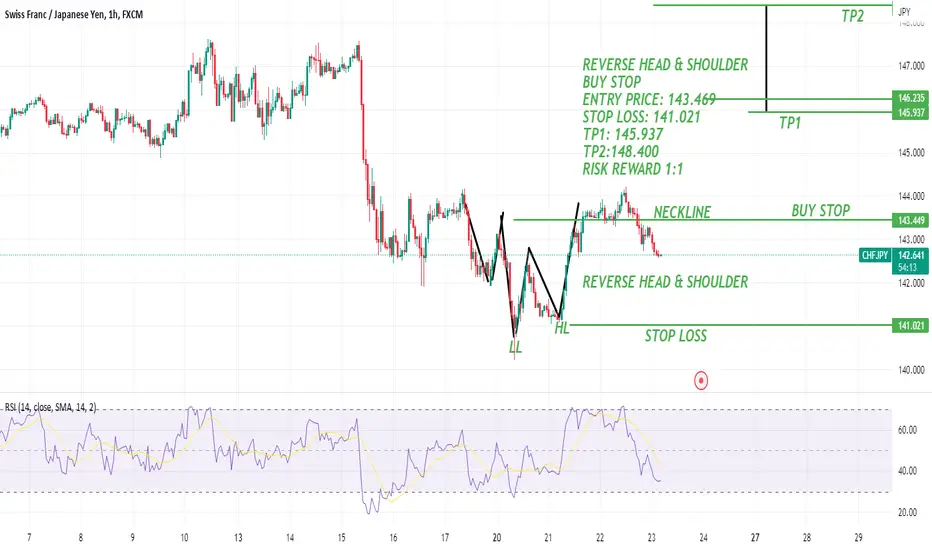
CHFJPY REVERSE HEAD & SHULDERIts showing reverse head & shoulder so we put order type buy stop at break of neck line with below instructions
REVERSE HEAD & SHOULDER
BUY STOP
ENTRY PRICE: 143.469
STOP LOSS: 141.021
TP1: 145.937
TP2:148.400
RISK REWARD 1:1
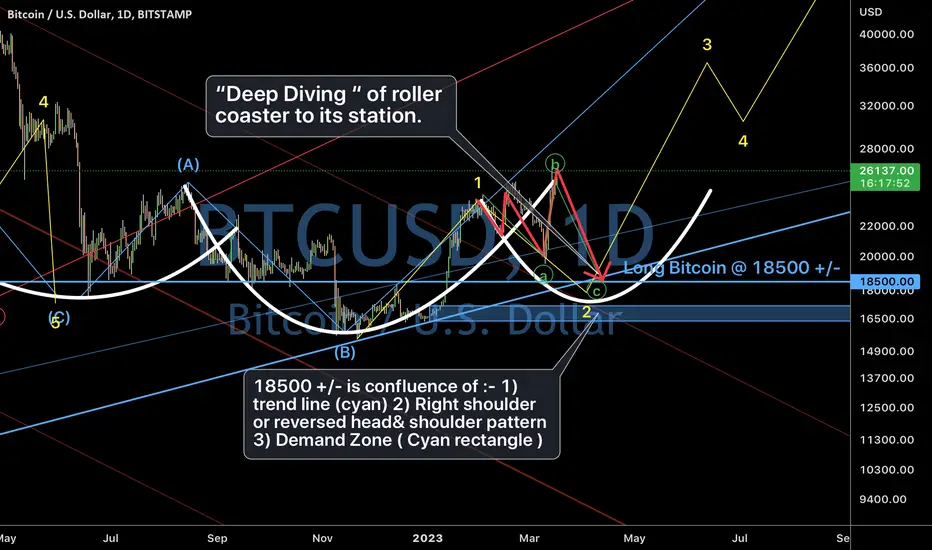
Bitcoin. Traders need “strong heart” for trading. 17/March/23.Hey. Guys we need “strong heart” to ride many “high profile” roller coaster track particularly in “leveraged market” e.g . spot gold/ cryptocurrency etc beside probably “consistency of nagging” from our partner which some can’t “feel” the “romances” of Candlestick dinner/chart But LV bags...
Filcoin, Reverse head & shoulderNow let's check in the weekly, it showed me the pattern of the reverse head & shoulder, so we can consider this pattern from the neck line where we are now.

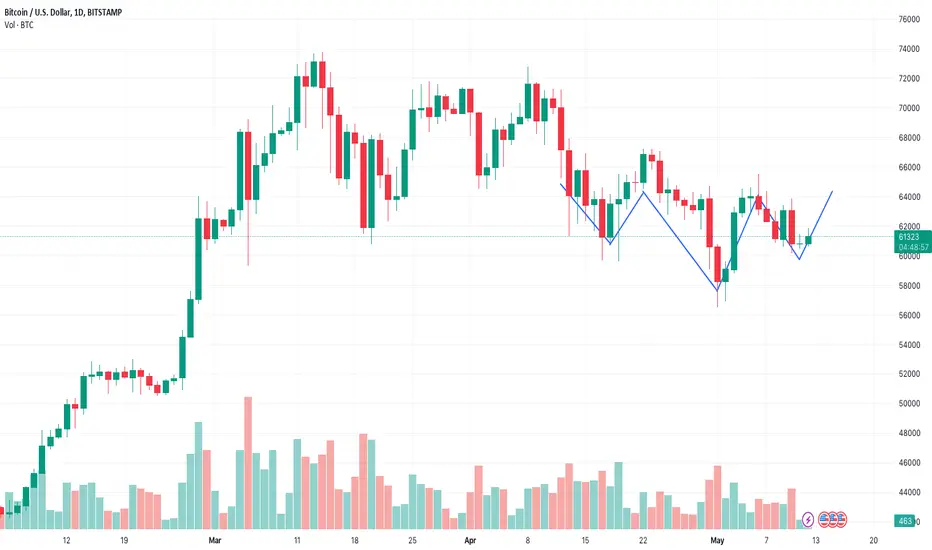
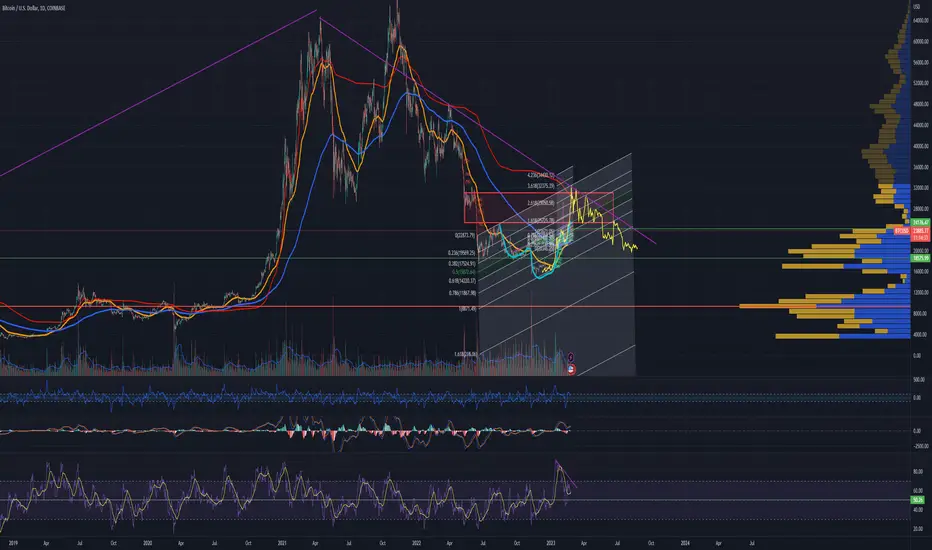
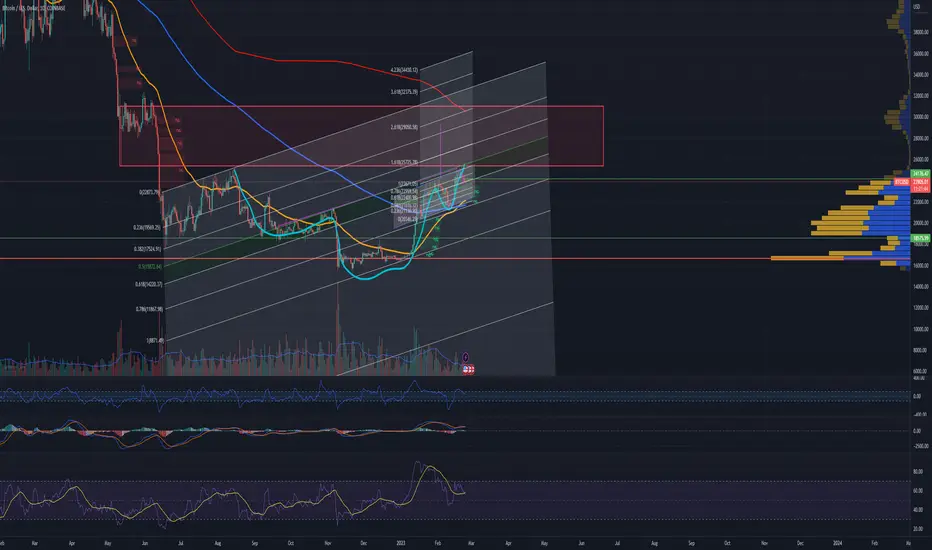
A potential BTC price action rH&SWhen we look on a larger time-frame, foremost 1D, we can see more and more evidence that BTC moves with a channel, respecting the FIBO retracements. Also on a global scale we can see a reverses head and shoulder formation, that could lead to a short and rather rapid price explosion towards the uptrend.
the RSI 13 illustrates that BTC returned from overbought to a normal level, expecting to retest or maintain top upper channel from 50 RSI 13 above. Recharging for a larger move.
We also see that there is not much liquidity at higher price levels, hence the cohort of investors is not deciding to sale, but rather take profit and move some liqudity into the Altcoins, which pop-up.
On a larger time frame we see a massive resistance at 27.5-31.5k, indicated with a red rectangle .
The bitcoin seems to follow closely recovery from 2019 bottom, with a rapid uptake towards higher prices. Will this scenario play-out? This is a bit foreseeing but we see on the chart even more evidences for potential price speculation towards the uptrend.
Important to highlight is the analysis of social sentiment: a large cohort of investors yet believes that this is a suckers rally, hence they do not participate in the market, but their belief may be invalidated when breaking out 25.3 and maintaining this regime, pushing them to loss aversion due to missing the opportunity (also known as FOMO).
A confluence of:
- The rH&S, FIBO extension
- Massive volume resistance at arround 27-32k
- VPVR at around 27-32
- Potential resistance line draw from the 2021 Mai ATH, that has been respected
- On-chain analysis suggesting that the peak of the last bulllrun was in fact in Mai 2021
- On chain analysis, mainly aSOPR but also other parameters suggest a change in Investor's perception of the market towards the bull trend
- Historic fractal pattern from 2019 bottom that has been a black swan event too
- Golden Cross on 1D
- PRice action multiply respecting the 50% retraction
- MACD
- STOCH RSI (not shown in analysis)
This is surely a bet, but backed by several parameters that confluence.
Good luck with trading
A potential BTC price action rH&SWhen we look on a larger time-frame, foremost 1D, we can see more and more evidence that BTC moves with a channel, respecting the FIBO retracements. Also on a global scale we can see a reverses head and shoulder formation, that could lead to a short and rather rapid price explosion towards the uptrend.
the RSI 13 illustrates that BTC returned from overbought to a normal level, expecting to retest or maintain top upper channel from 50 RSI 13 above. Recharging for a larger move.
We also see that there is not much liquidity at higher price levels, hence the cohort of investors is not deciding to sale, but rather take profit and move some liqudity into the Altcoins, which pop-up.
On a larger time frame we see a massive resistance at 27.5-31.5k, indicated with a red rectangle.
The bitcoin seems to follow closely recovery from 2019 bottom, with a rapid uptake towards higher prices. Will this scenario play-out? This is a bit foreseeing but we see on the chart even more evidences for potential price speculation towards the uptrend.
Important to highlight is the analysis of social sentiment: a large cohort of investors yet believes that this is a suckers rally, hence they do not participate in the market, but their belief may be invalidated when breaking out 25.3 and maintaining this regime, pushing them to loss aversion due to missing the opportunity (also known as FOMO).
A confluence of:
- The rH&S, FIBO extension
- Massive volume resistance at arround 27-32k
- VPVR at around 27-32
- Potential resistance line draw from the 2021 Mai ATH, that has been respected
- On-chain analysis suggesting that the peak of the last bulllrun was in fact in Mai 2021
- On chain analysis, mainly aSOPR but also other parameters suggest a change in Investor's perception of the market towards the bull trend
- Historic fractal pattern from 2019 bottom that has been a black swan event too
- Golden Cross on 1D
- MACD
- STOCH RSI (not shown in analysis)
This is surely a bet, but backed by several parameters that confluence.
Good luck with trading
US30 possible buyUS30 has made a possible small reverse head and shoulders on the 800 and 200ema support on the 15min chart, we could see a buy to continue the trend

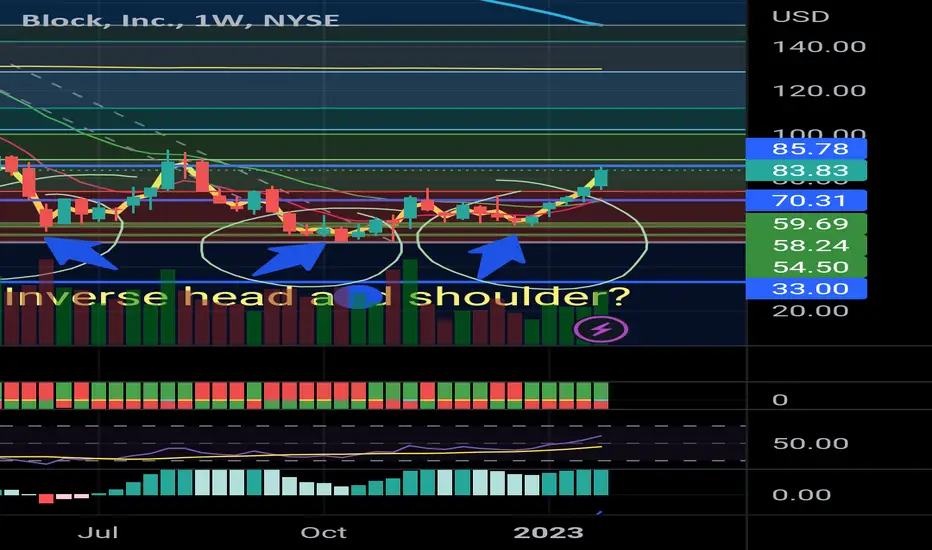
Square Reverse Head and Shoulder at fib? I believe I'm looking at a reverse head and shoulder on Block (SQ) on the weekly. This could indicate a longer term breakout above the fib. I'm thinking of small position size to front run the break out, a little more on a pullback (considering RSI) and larger size after a breakout up to 100. Tech's recent run in January and Block's extremely strong pullback in 2022 set up nicely for profit making.