REZUSDT at a Critical Point– Testing a Major Long-Term TrendlineComplete Analysis:
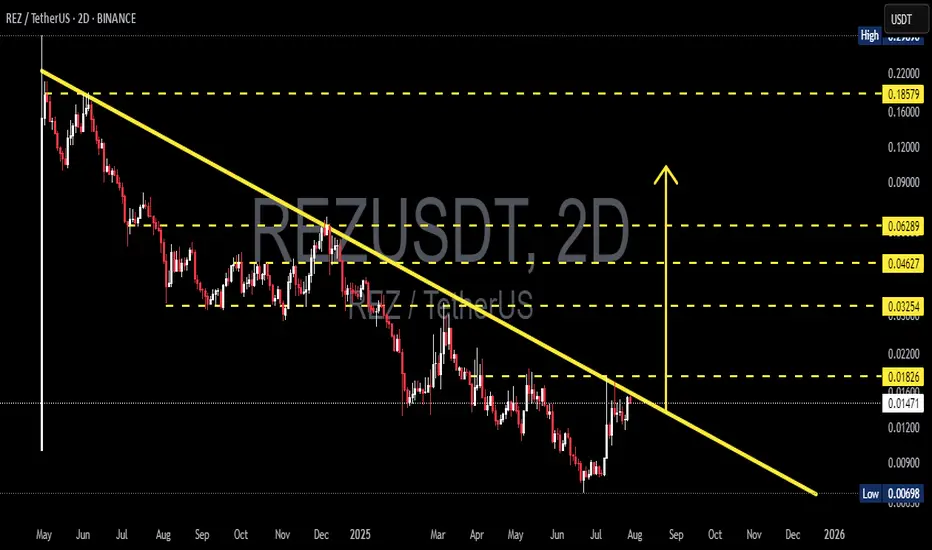
The REZUSDT pair is currently showing a highly compelling setup, as price approaches a long-term descending trendline that has held since May 2024. This is a pivotal moment that could dictate the next significant move—either a bullish breakout or a bearish rejection continuation.
---
📉 Pattern and Structure
The chart is forming a large Descending Triangle pattern, with the descending trendline consistently pushing the price lower for over a year.
Price is now nearing a key horizontal resistance at approximately 0.01826 USDT, which also intersects with the long-term trendline.
The lowest support level sits at 0.00698 USDT, marking the bottom from a major previous decline.
---
📈 Bullish Scenario
If the price successfully breaks and closes above the trendline (~0.01826 USDT), then:
The next potential upside targets could be:
0.03254 USDT
0.04627 USDT
0.06289 USDT
This breakout could signal a trend reversal in the medium term, especially if accompanied by strong volume.
---
📉 Bearish Scenario
However, if the price gets rejected at this resistance area:
It could pull back toward:
The minor support at 0.01200 USDT
The major support at 0.00698 USDT
A rejection at this trendline would confirm the continuation of the bearish descending triangle pattern, which traditionally favors further downside.
---
🧠 Conclusion:
REZUSDT is currently in a make-or-break zone. The market’s reaction to the descending trendline will be crucial in determining the next move. Traders should monitor volume and wait for a solid candle confirmation before entering any position.
#REZUSDT #CryptoAnalysis #TechnicalAnalysis #AltcoinBreakout #DescendingTriangle #CryptoTrading #TrendlineBreak #SupportResistance #REZAnalysis #BreakoutWatch